376. T2-Prepared TrueFISP Blood Oxygen Level Dependent (BOLD) Imaging in an Animal Occlusion Model
Steven M. Shea, MS,1 David S. Fieno, Ph.D.,1 Brian E. Schirf, MD,1 Yong-Zhong Li, MD,1 Richard Tang, MD,1 Kathy R. Harris, MS,2 Reed A. Omary, MD, MS,1 Debiao Li, Ph.D.1
Radiology, Northwestern University, Chicago, IL, USA, Feinberg Cardiovascular Institute, Northwestern University, Chicago, IL, USA.
Introduction: The blood oxygen level dependent (BOLD) effect is a potential mechanism for clinical measurement of myocardial perfusion reserve. During vasodilation, increased blood flow to the myocardium causes an increase in the venous blood oxygen saturation resulting in an increase in T2* and T2 relaxation times. In the past, cardiac BOLD imaging has been plagued by artifacts caused by low signal-to-noise ratios (SNR), blood flow, field inhomogeneity, and cardiac motion.1,2 However, recently a new technique for cardiac BOLD imaging using a T2-prepared TrueFISP sequence showed promising results.3 To better evaluate the utility of this sequence and to compare it with first-pass perfusion studies, the technique was tested in a dog occlusion model.
Methods: Dogs (n=5) were imaged on a 1.5 T Siemens Sonata scanner. Before MRI, a thoracotomy was performed under sterile conditions for the placement of an external Doppler flowmeter and an external hydraulic occluder in the left circumflex artery (LCX) in each animal. After recovery, animals were transported to the MRI facility, anesthetized, intubated, and ventilated. A segmented, ECG-triggered, 2D TrueFISP sequence with T2-preparation3,4 was used for BOLD imaging with the following imaging parameters: TR/TE=3.0/1.3 ms; T2-preparation duration=40 ms; phase-encode lines/segment=5–9; in-plane resolution=1.5–1.0×1.2–1.0 mm2; slice thickness= 5.0 mm; averages=2–4; breathold=20–30 s. Three short-axis slices were acquired during baseline conditions. Then, adenosine was administered intravenously (0.15–1.0 mg/min) to produce a two-fold increase in flow from vasodilation based on Doppler flowmeter readings. After this, the LCX was occluded to a level below baseline flow using the external hydraulic occluder. True-FISP BOLD images were acquired again for the short-axis slices. The final step was to acquire dynamic first-pass perfusion images using a saturation recovery (SR) TrueFISP sequence5 and an intravenous injection of Gadolinium MR contrast agent. Three short-axis slices were acquired every heartbeat with a resolution of 4.0×2.0 mm2 and a slice thickness of 5.0 mm. Image data was analyzed by measuring the SNR at baseline and at occlusion-stress in three territories: the myocardial tissue supplied by the left anterior descending coronary artery (LAD) near the anterior papillary muscle; the myocardial tissue supplied by the LCX near the posterior papillary muscle; and the anterior septal region which is supplied by the septal artery. Normalized signal differences between baseline and occlusion-stress were calculated with the following equation: (Soccl-stress−Sbaseline)/Sbaseline. Differences between the three regions were analyzed using ANOVA and a Tukey post-hoc test.
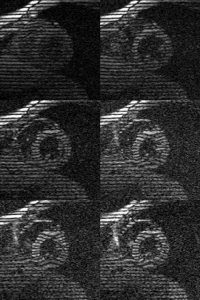
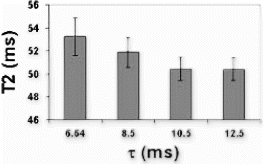
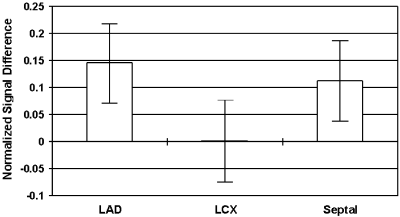
Results: T2-prepared TrueFISP BOLD images showed clear changes in signal intensity in the LAD and septal artery fed regions of the myocardium during occlusion-stress, but no changes in the LCX region (Figure ). This was confirmed with the signal measurements comparing the three different regions (Figure ). Significant differences were found between the LCX and LAD regions (p<0.001) as well as between the LCX and the septal regions (p<0.001). No significant difference was found between the LAD and septal regions (p=0.456). Comparison with SR-TrueFISP first-pass perfusion images showed excellent correlation regarding areas of enhancement.
Conclusion: T2-prepared TrueFISP BOLD imaging demonstrated the ability to accurately identify an area of occluded flow in an animal model. BOLD imaging has potential advantages over first-pass perfusion techniques due to the elimination of temporal resolution constraints. This leads to increased spatial resolution and coverage of the heart in BOLD techniques as well as removing the need for contrast agents. We conclude that this T2-prepared TrueFISP BOLD technique provides an index of myocardial blood flow in this animal model and has the potential to be a sensitive marker of myocardial perfusion reserve.
Figure 1. Examples from two different occlusion studies: (a) T2-prepared TrueFISP BOLD image at baseline, (b) T2-prepared TrueFISP BOLD image at stress-occlusion, (c) SR-TrueFISP first-pass perfusion at stress-occlusion, (d) T2-prepared TrueFISP BOLD image at baseline, (e) T2-prepared TrueFISP BOLD image at stress-occlusion, (f) SR-TrueFISP first-pass perfusion at stress-occlusion. Notice the regions with increased signal (arrows), indicating vasodilation.
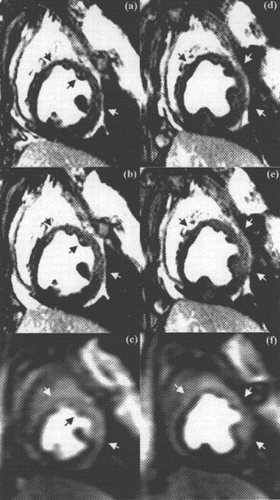
Figure 2. Results of normalized signal differences in the territories of the LAD, LCX and septal arteries.
Reference
1. Beache GM et al. Circulation 2001; 104: 1214–1217.
2. Wright KB et al. Magn. Reson. Med. 2001; 46:573–578.
3. Fieno DS et al. Proc. ISMRM 2002; 2002:513.
4. Shea SM et al. J. Magn. Reson. Imag. (2001) 15:597–602.
5. Schreiber WG et al. Proc. ISMRM 2002; 218.
377. Real-time Imaging Of Cardiac Strain Using Fastharp: A Comparison Between Breath-hold And Nonbreath-hold Studies
Smita Sampath,1 Andrew J. Derbyshire,2 Nael F. Osman,3 Jerry L. Prince.1
Electrical and Computer Engineering, Johns Hopkins University, Baltimore, MD, USA, Laboratory of Cardiac Energetics, NHLBI, Bethesda, MD, USA, Department of Radiology, Johns Hopkins University, Balitmore, MD, USA.
Introduction: Standard sequences used to estimate myocardial deformation, such as MR tagging, stimulated echo, and phase–contrast require long breath-holds lasting about 8–16 heartbeats. The HARP technique [1] was proposed recently as a rapid technique to quantify cardiac strain from tagged images. Tagged MR images comprise of multiple spectral peaks in the Fourier domain. HARP exploits the fact that when an off-centered spectral peak is filtered and its inverse Fourier transform is obtained, the phase of the resulting harmonic image is related to the underlying motion. The FastHARP pulse sequence was developed to provide the capability to acquire these harmonic images in real-time. Using this sequence, images acquired in two heartbeats are used to compute in-plane quantities of myocardial deformation thus reducing the time for breath-holds considerably.
Purpose: The ability to instantaneously detect ischemia during MR dobutamine stress testing is crucial to patient safety. Further, a continuous monitoring of the cardiac function while the patient is breathing is most desirable. The purpose of this study, hence, was to compare measures of myocardial function during free breathing and breath-hold studies performed on normal volunteers using the FastHARP pulse sequence.
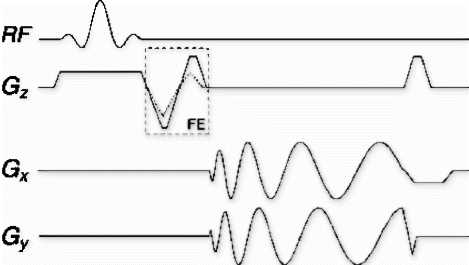
Method: Experiments were performed on six healthy normal volunteers (age 30±8) on a 1.5 T system (CV/i, GE Medical Systems, Waukesha, WI). The FastHARP sequence is based on a gated, multiphase, interleaved, gradient echo EPI pulse sequence and uses a 1–1 spatial modulation of magnetization (SPAMM) tagging scheme. For each volunteer, a short axis slice was prescribed. The volunteer was then made to hold his breath for two heartbeats during which the FastHARP sequence was used to acquire around fifteen harmonic images per heartbeat with 1–1 SPAMM tags in orthogonal directions on alternating heartbeats. For each image, a 32×32 region around the harmonic peak was obtained in four shots each with an echo train length of 8. A 62.5 kHz BW resulted in a TR of 9.7 ms and hence a temporal resolution of 38 ms. This procedure was then repeated with the volunteer breathing freely. Reference scans were also obtained for each case to allow a phase sensitive combination of the data from the multiple coils. HARP software tools were used to then generate strain maps and plots. The Lagrangian strains obtained during free breathing and breath-hold studies for the six volunteers were then compared using linear regression analysis and Bland Altman plots.
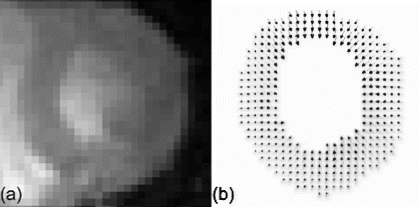
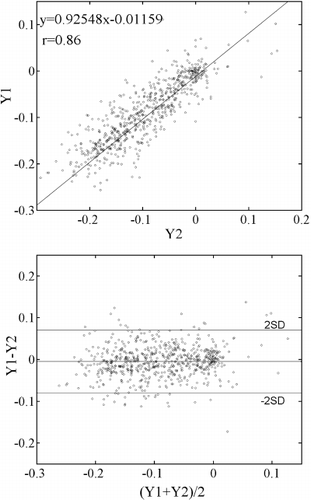
Results: Figure displays Eulerian circumferential strains overlaid on synthetic tagged images [3] in five time frames for the two scans in one volunteer. Both sets of images reveal qualitatively similar amounts of circumferential shortening. The Lagrangian strain curves shown in Fig. further corroborates this similarity. Figure quantitatively compares the Lagrangian circumferential strains (LCS) using linear regression. The correlation coefficient between the breath-hold (Y1) and the nonbreath-hold (Y2) FastHARP scan for data obtained from all six volunteers is 0.86. Comparisons between LCS's are also displayed using Bland–Altman plots in Figure . The mean differences were: 1) −0.005±0.037 (mean±standard deviation) between breath-hold FastHARP and nonbreath-hold FastHARP.
Conclusion: We have been able to show from these studies that the strains obtained during breath-hold and free-breathing studies are qualitatively very comparable. For these six volunteers, a quantitative coefficient of correlation in Lagrangian strains between the two modes was found to be 0.86.
Figure 1. Eulerian circumferential strain overlaid on synthetic tagged images for (a) two-heartbeat breath-hold Fast HARP (b) two-heartbeat non-breath-hold FastHARP.
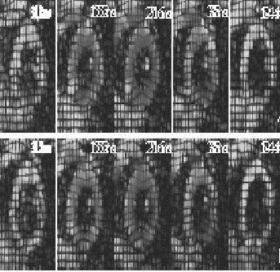
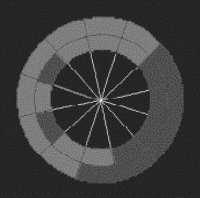
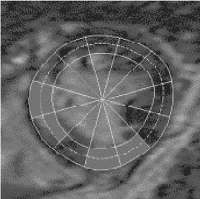
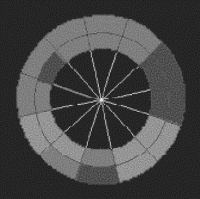
Figure 2. (a) Short axis slice of the left ventricle divided into octants. (b) Lagrangian circumferential strains (in %) for the octants during breath-hold (dotted line) and non-breath-hold (solid line) FastHARP for one volunteer.
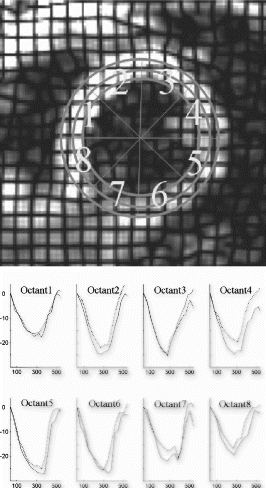
Figure 3. (a) Correlation between LCS between Y1(breath-hold) and Y2(non-breath-hold) (b) Bland Altman plot comparing LCS between Y1(breath-hold) and Y2(non-breath-hold).
Acknowledgments
This research was supported by NIH/NHLBI.
References
1. Osman NF, Prince JL.; Visualizing myocardial function using HARP MRI. Phys. Med. Biol. 2000; 45:1665–1682.
2. Sampath S., Derbyshire J. A., Osman N. F., Atalar E., Prince J. L. Real-time imaging of cardiac strain using ultra FastHARP sequence. In: Proc ISMRM 9th Scientific Meeting and Exhibition., 2001; 111.
3. Osman N. F., Sampath S., Derbyshire J. A., Atalar E., Prince J. L. Synthetic tagged MR images for real-time HARP imaging. In: Proc ISMRM 9th Scientific Meeting and Exhibition. 2001; 829.
378. Multi-coil Real-Time MR Imaging and Tracking for Guiding Interventions
Juan M. Santos,1 Michael V. McConnell,2 John M. Pauly.1
Electrical Engineering, Stanford University, Stanford, CA, USA. Cardiovascular Medicine, Stanford University, Stanford, CA, USA.
Introduction: Guiding interventional procedures requires both large- and small-FOV imaging, as well as tracking the position of one or more coils on interventional devices. Accordingly, we have developed a flexible system architecture that allows real-time acquisition and interactive display of image and position data from multiple coils.
Purpose: Develop and test a multi-coil real-time imaging/tracking system.
Methods: An adaptive architecture was used for the real-time imaging system. This extends the functionality of our conventional single-sequence, single-coil real-time system as it allows switching between sequences on a per-acquisition basis and allows inputs from multiple coils. This provides an excellent platform for a real-time multi-coil imaging and active tracking system.
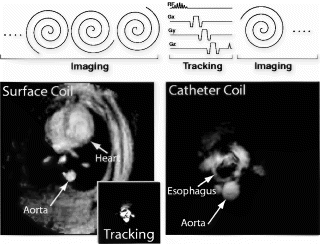
Catheter tracking. Rapid sequence switching was implemented for real-time active tip-tracking, as originally developed by Dumoulin. In this method, a sequence of orthogonal projections is acquired using the catheter coil as receiver. The peaks of these projections localize the catheter coil in three dimensions. By implementing a tracking pulse sequence block that is interspersed in the real-time continuous acquisition imaging system, a complete set of tracking projections can be acquired in a single TR to give the location of the catheter (see sequence figure). It is designed to have the same flip angle, gradient area, and TR as the imaging block to maintain the steady state.
Multi-coil inputs. This adaptive architecture also provides separate receiver channels for the coil inputs. This allows rapid selection of the coil to display (e.g., large-FOV surface coil vs. small-FOV catheter coil), or it allows the use of several coil inputs to form a combined display, to color-code individual channels, or to use multiple coil position data to determine device direction.
User interface. Finally, an enhanced interactive user interface and display allows the operator to select the coil(s) to display and independently select the coil for tracking. The real-time interface also allows interactive adjustment of scan parameters, such as FOV, image plane, frame rate, and flip angle. [Baseline imaging parameters were 4 cm FOV, 65 ms TR, 6 interleaves, 3–15 frames/sec, 30 degree flip].
Scan modes. Thus, this system provides three scanning modes for using catheter tracking. The first simply images a fixed FOV with an external receiver coil, but shows the tip of the catheter coil as a bright spot or cursor on the image. The coil causes a local enhancement of the RF field in its vicinity, so the coil is evident provided it is in the imaging plane. A cursor can be positioned and updated on the image based on the processed projection data. The second mode uses an external receiver coil for imaging, but uses the processed projection data to continuously center the image on the catheter coil by feeding the coil offsets directly back to the pulse sequence in real time. This mode can be enhanced by combining the catheter coil image, using a distinctive color, on to the large-FOV anatomical image from the external coil. The third mode uses the catheter coil for both imaging and tracking, when small-FOV imaging is desired.
Results: This system was tested in phantoms and in an in vivo rabbit model using a transesophageal catheter coil and a standard 5-inch surface coil (see Figure ). In the initial phase of the imaging procedure (left image), the surface coil is used for real-time imaging to provide large-FOV anatomic landmarks. As the catheter is advanced, tracking is activated with the catheter coil so the image position is updated in real-time based on the catheter position. When the desired anatomic region is achieved, the coil selection is toggled so that the catheter coil is used for both tracking and display (inset shows the catheter coil image at the same FOV). Then, the FOV can be interactively adjusted to “zoom in” on desired structures–in this case the descending aorta adjacent to the esophagus (right image).
Conclusions: An adaptive, multi-coil real-time imaging system provides enhanced imaging and tracking modalities for MR guidance of interventional procedures.
379. Adaptive Real-Time MR Coronary Angiography—First Prospective Clinical Trial
Patricia Nguyen,1 Juan Santos,1 Greig Scott,2 Jan Engvall,1 Michael McConnell,1 Craig Meyer,1 Steve Connolly,1 Dwight Nishimura,1 John Pauly,1 Bob Hu,1 Phillip Yang.1
Stanford University, Palo Alto, CA, USA, Stanford Univerisity, Palo Alto, CA, USA.
Introduction: MR coronary angiography (MRCA) has yet to be routinely implemented in clinical setting. Some of the current limitations include image quality, anatomic coverage, and scan protocol. To address these issues, we have developed an adaptive real-time architecture (aRT). The aRT instantaneously selects the desired element on a phase-array receiver coil and dynamically reconfigures between real- time and high resolution pulse sequences. This integrated real-time system enables considerable flexibility in MRCA.
Purpose: A prospective clinical trial has been conducted to determine the clinical utility of this system.
Methods: A total of 43 subjects (35 patients referred for cardiac catheterization and 8 normal volunteers) have been recruited consecutively to evaluate scan time, anatomic coverage, image quality, and detection of coronary lesions. The anatomic coverage was based on the number of coronary segments visualized using the 9 coronary segment model. Image quality of each coronary segment (grade1–4: 1=excellent; 2=good, 3=fair, and 4=non-diagnostic) was assessed based on both vessel border contiguity and artifact. Three investigators blindly reviewed the MR images for CAD. Their findings were compared to the coronary angiograms reviewed by interventional cardiologists.
Using a modern PC (AMD) as a sequencer, the aRT generates an arbitrary waveform to switch from real-time localization (RT) to gated high-resolution (HR) imaging sequence in 1 TR (39 ms). The 2 sequences share the same spectral-spatial pulse (11 ms) and spiral read-out gradient (16 ms), generating identical TR (39 ms) and FOV (20 cm). The only difference is the number of interleaves between RT (6) and HR (16), resulting in spatial resolutions of 2.2- and 0.7-mm, respectively. Scanning was performed on a GE Signa 1.5T CV/i scanner with high performance gradient (40 mT/m peak amplitude and 150 mT/m/msec slew rate) with a dedicated coronary coil consisting of two 4-inch phase-array receiver coils overlapped in a linear array to eliminate mutual inductance. The coil, designed to increase SNR and anatomical coverage, is placed in cranial–caudal position along the subject's left chest. The proximal coil covers the right coronary artery (RCA), left circumflex artery (LCx), left main, and proximal-left anterior descending (LAD). The distal coil covers the mid- and distal-LAD. The aRT has been designed to switch between the 2 coils in real-time and reconstruct HR images from individual or both coils.
Results: All studies were completed in less than 45 minutes and required a mean of 12 breath-holds (16-heartbeats). Of the total number of coronary segments, 92% (355/387) of the segments were visualized. Excellent or good (grade 1–2) image quality was achieved in 87% of the segments. Analysis of the coronary arteries revealed sensitivity of 82% and specificity of 94%. Sample images of the RCA, LCx, LAD, and distal-LAD with diagonal branch are shown in Figs. .
Conclusion: The aRT integrates real-time localization and high-resolution sequences to provide a rapid and flexible scan protocol for MRCA. Instantaneous switch between real-time adjustment of the scan plane and resultant high-resolution images enable short scan times, wide anatomical coverage, high image quality, and reliable detection of CAD.
380. Coronary Flow Quantification Using Fourier Velocity Encoding
Christof Baltes, Sebastian Kozerke, Peter Boesiger.
Institute for Biomedical Engineering, University & ETH, Zurich, Switzerland.
Introduction: In recent reports the feasibility of measuring intra-coronary blood flow using fast magnetic resonance (MR) techniques was demonstrated [1]. It has been indicated that MR flow quantification holds potential to non-invasively assess the significance of coronary stenoses. However, the accurate determination of flow and vessel area remains challenging. High spatial and temporal resolution is required to reliably assess flow profiles within the coronary arteries [2,3].
To improve the accuracy of flow quantification in small vessels, Fourier velocity encoding (FVE) with a small number of encoding steps was implemented. Simulations and in-vitro experiments have been performed to reveal the benefits of FVE. Further, initial volunteer measurements demonstrate in-vivo feasibility.
Purpose: The aim of this work was to implement and evaluate Fourier velocity encoding with a small number of encoding steps for coronary flow quantification.
Methods: The phase contrast (PC) is usually used for MR flow quantification. To accurately quantify vessel area, sufficient spatial resolution [2] is required necessitating signal averaging to obtain adequate image quality.
Recently, FVE with a small number of encoding steps [4] was proposed allowing for relatively short scan times and thus facilitating in-vivo application. In this work the accuracy of FVE is compared with PC for equivalent scan durations.
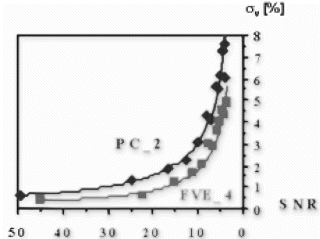
Computer Simulations: Both techniques were simulated for a voxel containing laminar flow with a maximum velocity of 30 cm/s and an encoding velocity of VENC=50 cm/s. After repeating the simulation 50 times with normally distributed noise added, the standard deviation σv of the velocity was calculated as percentage of VENC.
In-Vitro Experiments: The FVE method was implemented into a 3D sequence on a 1.5 T Intera MR system (Philips Medical Systems, Best, The Netherlands). In the experimental setup a small tube (diameter: 5.3 mm) was connected to a steady flow circuit (100–600 ml/min) and the fluid parameters were matched to the properties of blood (T1/T2=1100/650 ms). FFE sequences (resolution: 0.4 mm×0.4 mm×4.0 mm, VENC=30–80 cm/s) were used for velocity mapping, whereby FVE was performed with four encoding steps and PC with two signal averages. To estimate the volume flow the tube area was estimated by the full-width-at-ten-percent-of-the-maximum criterion [5].
In-Vivo Experiments: Five healthy volunteers (age: 24±4) were placed in supine position with a cardiac coil wrapped around their chest. Velocity data was acquired using ECG triggered, segmented TFE sequences (resolution: 1.0 mm×1.0 mm×6 mm, VENC=40 cm/s) applying FVE with four encoding steps (TE=5.2 ms) and PC with two signal averages (TE=4.4 ms). Navigator gating was used to compensate for respiratory motion resulting in scan durations of about 3:21 min. Subsequently, volume flow was calculated from the velocity maps acquired in the right coronary artery (RCA).
Results: Computer Simulations: As shown in Figure , FVE allows a more accurate velocity determination for lower SNR compared to PC.
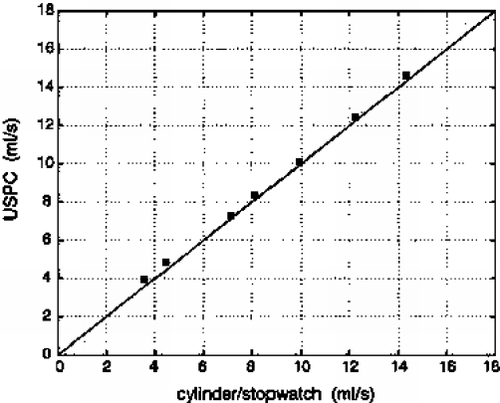
In-Vitro Experiments: Volume flow measured by both techniques keeps within the 10 percent limits of the reference value (flow meter). Linear regression (FVE=1.0*PC-4.3, r=0.99) yields a good agreement between PC and FVE. Thus, the accuracy of FVE is given even for a small number of encoding steps.
In-Vivo Experiments: Figure shows a cross section of the heart including the RCA. Using FVE flowing blood can be distinguished from static tissue, as depicted in Figure .
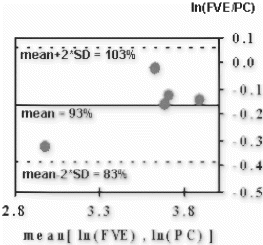
Although a slight underestimation of the flow measured by PC compared to FVE is perceivable (Figure ), no significant difference between both techniques can be ascertained. All measurements keep within the confidence interval.
Conclusion: In this work computer simulations demonstrated the encoding properties of FVE and its potential benefits to quantify flow in small vessels. It was shown, that the accuracy of FVE is given even for a small number of encoding steps allowing an in-vivo application. In-vivo feasibility of FVE was confirmed by measuring coronary blood flow in 5 healthy volunteers. The investigations yielded a good agreement between both techniques. In conclusion, FVE allows the measurement of coronary blood flow and might permit a higher spatial resolution at the same scan time compared to PC.
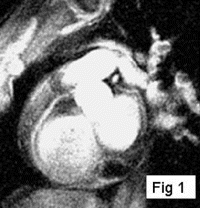
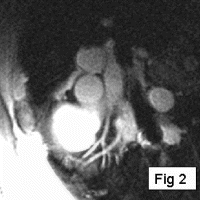
Figure 2. (a) Cross-section of the heart including the RCA, (b) slice encoding zero velocity, (c) slice encoding maximum velocity depicting maximum flow in the RCA (bright spot).

Figure 3. Bland–Altman graph comparing the volume flow over one cardiac cycle measured in the RCA of 5 healthy volunteers.
References
1. Nagel, E, et al. MRM 41:544–49, 1999.
2. Hoogeveen, R. M., et al.MRM 41:520–28, 1999.
3. Hofman, M. B., et al. MRM 35:521–531, 1996.
4. Bittoun, J., et al. MRM 29:674–680, 1993.
5. Hoogeveen, R. M., et al. MRM 8:1228–1235, 1998.
381. Improved Robustness and Scan Efficiency of Respiratory Gating in Coronary MRA Using 3D Motion Adapted Gating (3D-MAG)
Matthias Danne,1 Kay Nehrke,2 Claus J. Witt.1
Kardiologische Abteilung, Albertinen-Krankenhaus, Hamburg, Germany, Philips Research Laboratories, Hamburg, Germany.
Introduction: Free breathing coronary MRA based on respiratory navigator gating and tracking has been demonstrated to be of clinical value for the assessment of coronary artery disease1. However, in patients with drifting or irregular breathing patterns respiratory gating often results in excessive scan times or even aborted scans, if the initially chosen gating window position turns out to be non-optimal in the retrospective view. To overcome these problems 3D-MAG combines the multilevel approach of the recently introduced PAWS technique2 with motion tracking3 and 3D segmented k-space acquisition schemes.
Purpose: To compare the performance of 3D-MAG and conventional respiratory gating with respect to navigator scan efficiency in 3D coronary MRA.
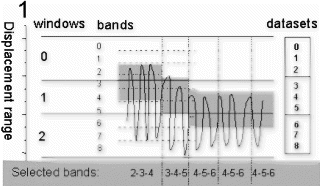
Methods: 3D-MAG has been implemented and tested on a clinical scanner (Intera 1.5 T, Philips Medical System). Similar to PAWS2, multiple gating windows grouped around the conventional gating window are used, which are assigned to separate, complete k-space data sets. Additionally each window is subdivided into three bands, which are assigned to different k-space segments of the corresponding data set. This principle was extended to ECG-triggered 3D acquisitions, where the segmentation of k-space due to the displacement range was combined with the segmentation due to the transient state (Figure ). During the scan the different data sets are filled according to the navigator displacement. The scan terminates when three consecutive bands are filled and, hence, an image can be reconstructed from one complete data set. Thus, the optimal gating window, which covers the most frequent motion state, is selected automatically. However, for several reasons the current implementation of 3D-MAG still uses a short navigator preparation phase prior to the scan to estimate the end-expiration position: firstly, to choose an initial gating window that allows a direct comparison of the scan efficiency of 3D-MAG and standard gating within one examination, secondly, to limit the number of required gating windows and, hence, reconstruction memory, and thirdly, to insure the accuracy of slice-tracking by selecting a navigator reference kernel not to far away from the likely final acceptance range.
39 patients with suspected coronary artery disease underwent free breathing navigator-gated MRA (5 mm diaphragmatic gating window with additional slice-tracking). In all patients a conventional ECG-triggered 3D segmented k-space gradient echo sequence4 was used (acquisition window 76 ms, in plane resolution 0.7×0.79 mm, 3 mm slice thickness). In 11 of these patients additional examinations were performed using an ECG-triggered 3D True-Fisp sequence (acquisition window 84 ms, in plane resolution 1×1 mm, 3 mm slice thickness).
For each examination, the acquisition time of the 3D-MAG scan was compared to the expected acquisition time of a conventionally gated scan. The latter value was estimated from the filling of the initially chosen gating window, which is otherwise used for standard gating.
Results: The average relative scan time of 3D-MAG was 203% compared to 251% for standard gating (100%: all profiles accepted). Thus, 3D-MAG reduced on average the acquistion time by 19%, which corresponds to approx. 2 minutes. The histogram in Figure shows that 3D-MAG effectively prevented excessive scan times above 400%. Using standard gating these acquisitions would in practice require a restart with modified gating window position.
The image quality seemed to be comparable to that obtained by standard gating (cf. Figure ), although an objective comparison was not possible within the scope of this study. However, from the technical point of view no degradation of image quality is expected, since the gating window width does not change. On the contrary, one may expect a better image quality due to increased patient comfort resulting from shorter scan time.
Conclusions: 3D-MAG considerably increases scan efficiency and robustness of respiratory gating. Furthermore, 3D-MAG improves the patient comfort and the operator-friendliness of free-breathing MRI, because a repositioning of the gating window due to drifting breathing patterns is no longer required. Apart from the more complicated implementation, this approach has no principal drawbacks compared to conventional gating.The authors thank Peter Börnert for fruitful discussions.Support by the European Commission (IST-2000-28168 MRI-MARCB).
Figure 1. Multiple gating windows with subdivision into three bands (a) and two matching k-space segmentations for 3D acquisitions (b: ellipsoidal, c: rectangular 2D phase encoding space). The arrows in (b,c) indicate the path of the transient (b: radial, c: linear).
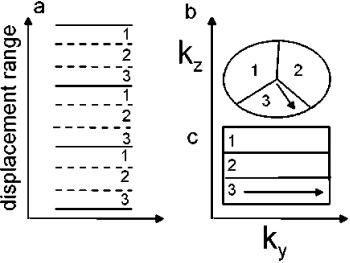
Figure 2. Histogram showing the distribution of relative acquisition times for 3D-MAG and standard gating (100%: all profiles accepted). To display the long (estimated) scan times occurred for standard gating a break of the horizontal axis has been inserted.
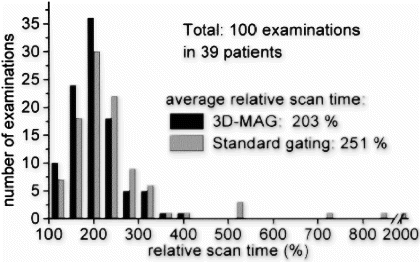
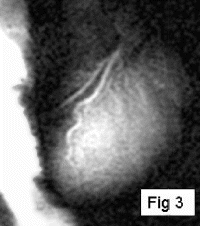
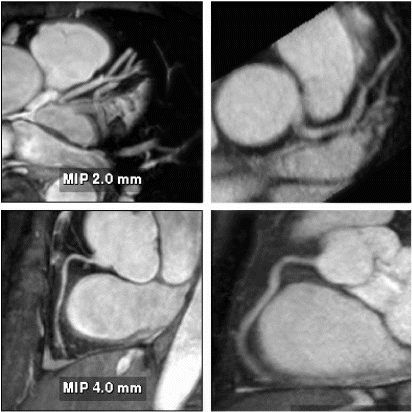
Figure 3. Reformatted images of LAD (top) and RCA (bottom) obtained from the 3D-MAG scans (left:True-Fisp, right: gradient echo).
References
[1] Kim, W. Y. et al. New Engl. J. Med. 2001, 345:1863–1869.
[2] Jhooti, P. et al. Magn. Reson. Med. 2000, 43:470–480.
[3] McConnel, M. V. et al. Magn. Reson. Med. 1997, 37:148–152.
[4] Stuber et al. J. Am. Coll. Cardiol. (1999), 34:524.
382. Chemical Shift Catheter Tracking for Intravascular MRI
Chris A. Flask, Daniel Elgort, Ken-Pin Hwang, Jonathan S. Lewin, Jeffrey L. Duerk.
Departments of Radiology and Biomedical Engineering, Case Western Reserve University/University Hospitals of Cleveland, Cleveland, OH, USA.
Introduction: Catheter tracking and visualization in interventional MRI is a useful tool for both intravascular imaging as well as cardiovascular therapies (e.g., stent placement, balloon angioplasty, etc). Passive tracking methods using susceptibility artifacts can provide adequate catheter visualization. However, these methods are dependent on the orientation of the device in the magnetic field and on the slice thickness of the acquired image acquisition. Active tracking methods utilizing tuned microcoils provide accurate localization for scan plane determination, but are not as useful for steering catheters through the complex vasculature because of their point-like nature. Guidewire antennas provide a larger field-of-view for catheter visualization/profiling, but suffer from local heating which may result in significant tissue damage.
Purpose: To demonstrate the feasibility of a wireless catheter tracking and visualization method for intravascular MRI. The method is based on the selective excitation of a chemically-shifted NMR signal source within a catheter. This tracking/profiling method would provide the necessary selectivity and large field of view for catheter visualization necessary to allow catheter steering when overlaid onto a previously acquired roadmap image. This new method provides the same capabilities as guidewire antennas without the risks of localized tissue heating.
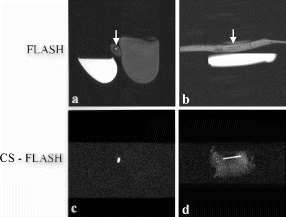
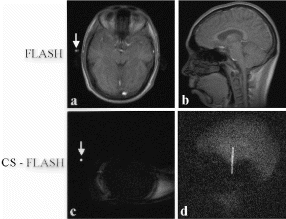
Methods: A prototype catheter was created by infusing 1 ml of concentrated acetic acid (σ∼7ppm) doped with 1mM Gd contrast (Magnevist™, Schering AG) into a plastic 1 ml syringe (ID=4.7 mm). This solution provides a signal source with a proton chemical shift frequency distinct from typical tissue protons. The syringe was placed into a vascular phantom and near a volunteer's head to develop the tracking/profiling sequence. A FLASH (Fast Low Angle SHot) sequence was developed with a 10 ms chemical shift selective excitation (CHESS) pulse to excite the off-resonance spins (TR/TE/FA=20 ms/10 ms/30°). No slice-select gradients were applied in this sequence. Gradient shimming was applied prior to the image acquisition to limit the effects of field inhomogeneities. Imaging acquisitions toggled between CS-FLASH and conventional FLASH to provide alternate catheter and anatomic images. The images from the chemical shift-selective FLASH sequence (CS-FLASH) were compared with standard slice-selective FLASH (TH=5 mm) to demonstrate the capability for acquiring catheter-only images to be overlaid onto previously acquired roadmap images needed for catheter steering.
Results: Axial and sagittal views of the vascular phantom and volunteer head images are shown in Figs. . Figures are FLASH images with a slice-selective excitation pulse. The acetic acid syringe is identifiable within the vascular portion of the phantom and near the volunteer's left ear in the axial image (Figure ). Figures are from the CS-FLASH sequence with the CHESS pulse resulting in the “catheter-selective” images. In an in-vivo intravascular procedure the sagittal catheter-selective image (Figure ) would be overlaid onto the corresponding anatomic image (Figure ).
Conclusions: Actively tracking catheters with chemically-shifted MR signal source provides a safe, wireless method for catheter steering in intravascular MRI. Catheters with a chemically-shifted material, either in a separate internal lumen or via a customized external coating, can be visualized without the added risks of roadmap images from guidewire antennas. In this feasibility study, two FLASH sequences are used to acquire both the anatomical and catheter-selective images. However, other combinations of sequences and materials can be used to optimize the anatomic and catheter imaging independently for the particular interventional procedure (i.e., optimized for speed, catheter/background contrast, tissue/vessel contrast, resolution variations between images, etc.). The bandwidth, center frequency, and the magnitude and phase of the CHESS pulse can also be modified to generate images with selected suppression bands allowing for better visualization of the catheter within the vasculature. This method is easy to implement on conventional scanners and requires only a single receiver channel. With further optimization of the sequence and catheter design, including construction with fully biocompatible materials and a reduction in catheter size, this new method will provide a simple, effective solution to the challenge of real-time in-vivo active tracking for intravascular catheters.
383. Combining MR and X-Ray Images in a XMR System for Guidance in Cardiovascular Interventions
Kawal Rhode, Derek Hill, Reza Razavi, Philip Edwards.
Radiological Sciences, King's College London, London, United Kingdom.
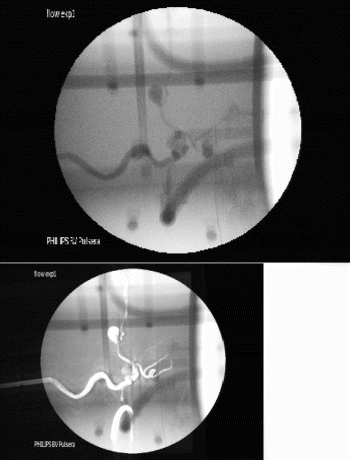
Introduction: Our new XMR interventional facility incorporates a 1.5T MR scanner (Philips Intera I/T) and mobile cardiac x-ray set (Philips Pulsera) in a single operating room, with seamless transfer of patients between the two modalities. Cardiac catheterization can be performed either under MR or x-ray guidance. Interventional procedures that are carried out under two-dimensional (2D) x-ray guidance can now benefit from the three-dimensional (3D) images supplied by MRI. The overlaying of MR images onto x-ray images has several benefits. Firstly, this would assist in interventional guidance under x-ray, since structures that are normally not be visible during x-ray exposure would now be seen. Secondly, by registering MR images to x-ray images, it is possible to locate devices seen under x-ray in the 3D MR images. The development of an XMR image registration technique could assist in a wide range of our clinical applications. Firstly, for patients undergoing diagnostic cardiac catheterisation we have been making non-invasive measurements of blood flow using MRI and invasive measurements of pressure. In cases where the pressure measurement catheter cannot be visualized using MRI, we have used x-ray guidance. With a registration technique it would be possible to relate the sites at which the pressure and the flow measurements are made in these cases. Secondly, for patients undergoing treatment for cardiac arrhythmias by radio-frequency (RF) ablation, a registration technique allows the location of measurement electrodes and the RF ablation catheter in the 3D MR images. This assists in the determination of abnormal electrical pathways/foci and the ability to accurately place the ablation catheter at this location.
Purpose: The aim of our work was to develop and validate a technique to register the 2D x-ray images acquired during an intervention to the 3D MR images of the cardiac anatomy acquired a few minutes earlier.
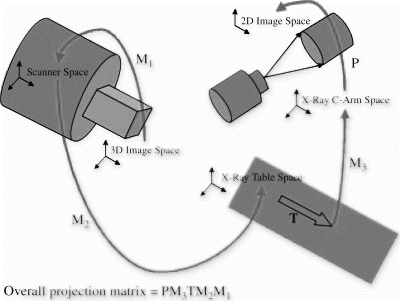
Methods: 2D–3D registration of the x-ray images and the MR images was obtained by tracking the x-ray system using an optical technique. The calculation of the 2D–3D registration matrix needed to map 3D points in MR image space to 2D points in x-ray image space can be broken down into 5 separate stages as outlined in Figure .
Matrix M1 can be calculated using information in the MR image header. Matrices M2M3, and P were found using an acrylic calibration phantom and an optical tracking system (Northern Digital Optotrak 3020). 14 fiducial markers visible under both MR and x-ray were placed on the calibration phantom. Infrared-emitting diodes were placed on the image intensifier and on the x-ray table base and tracked by the Optotrak. Subsequent to the calibration, it was possible to calculate a 2D-3D registration matrix given patient MR images, x-ray images, tracking information, and the patient table translation between the MR system and the x-ray system. The latter was used to determine the translation T and was found using information available from the MR console. The error in this parameter was assessed by translating our calibration phantom along the patient table and comparing the measurements from the MR console and those obtained using the Optotrak. The registration technique was validated using a vascular phantom imaged under both MR and x-ray modalities. 9 fiducial markers were placed on the phantom. The phantom was imaged using 2 x-ray views and registration matrices were calculated for these views. Using these matrices, maximum intensity projections (MIPs) were generated from the acquired MR volume. The position of the fiducial markers was determined manually in both the x-ray images and the MIPs to assess the error in the registration.
Results: Figure shows an x-ray image of the vascular phantom for one of the two views used. Superimposed on this is the MIP of the MR volume generated using the registration. In total 12 out of the possible 18 fiducial markers were visible in the x-ray images. The 2D RMS error in locating the fiducial markers was 3.6 mm. The error in determining the translation T was 0.12±0.26 mm (1 s.d., n=4).
Conclusion: Our results show sufficient accuracy for relating MR and x-ray images of the great vessels and cardiac chambers. Bending of the patient table during transfer of heavy patients from MR to x-ray will increase the error in the determination of matrices M2 and T. Also patient movement on the patient table will increase the overall registration error. In further work, we will compensate for any patient motion during transfer from MR to x-ray using image-image registration technology, with the tracked solution providing a starting estimate. Correction of x-ray and MR geometric distortion will further increase the accuracy of our results.
384. Interrupted Steady-state Free-precession Magnetization Preparation For Navigator-gated 3D Coronary Mra
Michael E. Huber, Sebastian Kozerke, Ph.D., Peter Boesiger, Ph.D.
Institute for Biomedical Engineering, University & ETH Zurich, Zurich, Switzerland.
Introduction: Steady-state free-precession (SSFP) [1] has successfully been combined with free-breathing navigator-gated 3D coronary MRA by other investigators [2]. However, for high SSFP image contrast between the coronary blood and the surrounding tissue, a magnetization preparation phase is required to achieve steady-state conditions. On the other hand, the duration of this preparation phase, which is usually performed immediately prior to the actual data acquisition, is limited by the constraint that the time delay between the diaphragmatic navigator and the scanning phase has to be kept as short as possible in order to avoid motion artifacts [3].
Purpose: In the present work the conventional SSFP magnetization preparation phase is replaced by a previously described interrupted magnetization preparation phase [4] and combined with free-breathing navigator-gated 3D coronary MRA. This may enable to perform the SSFP magnetization phase prior to the navigator acquisition and hence may allow to achieve better steady-state magnetization conditions and simultaneously reduce the time delay between the navigator acquisition and the actual scanning phase.
Methods: The interrupted magnetization preparation phase (Figure ) was implemented for free-breathing navigator-gated 3D coronary MRA on a 1.5T Philips Intera whole body MR system (Philips Medical Systems, Best, NL) and tested on three healthy subjects. The preparation scheme consisted of an α/2-tip-down pre-pulse with 30 RF dummy excitations performed at the beginning of the cardiac cycle, followed by an α/2-tip-up pre-pulse, which restores steady-state transverse magnetization as longitudinal magnetization. After navigator acquisition, fat saturation (Fat-Sat) and a REST pre-pulse for chest wall suppression, a α/2-tip-down pre-pulse was followed by 5 RF dummy excitations reestablishing steady-state conditions for subsequent SSFP imaging. The new preparation scheme was compared to a conventional magnetization preparation phase as previously used by Stuber et al. (Figure ), where an α/2-tip-down pre-pulse with 20 RF dummy excitations are performed immediately prior to the SSFP imaging part.
The imaging parameters were: FOV=300 mm×272 mm, 256×209 image matrix (in-plane spatial-resolution=1.2 mm×1.3 mm), TR=4.6 ms, TE=2.3 ms, RF excitation angle α=60°, 14 excitations per RR-Interval. A 3D volume of 30 mm thickness was acquired with 10 adjacent slices. For visualization, the data sets were multi-planar reformatted and following image quality parameters were measured: signal-to-noise ratio (SNR) of coronary blood, SNR of myocardial muscle and contrast-to-noise ratio (CNR) between blood and myocardial muscle.
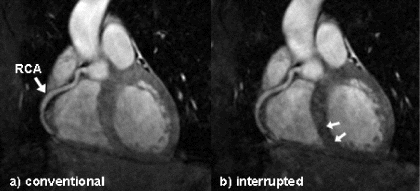
Results: Both magnetization preparation schemes enabled to visualize long portions of the coronary artery tree. In Figure , a comparison of a right coronary artery (RCA) acquired with the conventional SSFP preparation (Figure ) and the interrupted SSFP preparation scheme (Figure ) is presented. In the image obtained with the interrupted magnetization preparation we can further appreciate reduced signal intensity of the myocardial muscle (small arrows) when compared with the conventional magnetization preparation. This observation was confirmed by the evaluation of the image quality parameters, which showed similar SNR for the coronary blood (38.1±3.5 conventional vs. 37.9±2.7 interrupted) and reduced SNR within the myocardial muscle (21.8±4.5 conventional vs. 17.9±3.6 interrupted). As a consequence, CNR between blood and myocardial muscle could be increased in the acquisitions preformed with the interrupted SSFP preparation (16.1±3.7 conventional vs. 20.0±1.2 interrupted).
Conclusion: An interrupted magnetization preparation scheme was successfully implemented for SSFP free-breathing navigator-gated 3D coronary MRA. It allowed for the extension of the magnetization preparation phase required for SSFP imaging, yielding better steady-state conditions for the subsequent scanning phase and therefore increased CNR between the coronary blood and the myocardial muscle. Despite the prolonged preparation phase, the time delay between the navigator acquisition and the actual SSFP imaging part could be significantly reduced by incorporating the navigator into the SSFP magnetization preparation scheme.
Figure 1. Imaging sequence for free-breathing navigator-gated SSFP coronary MRA with two different magnetization preparation schemes: a) conventional b) interrupted.
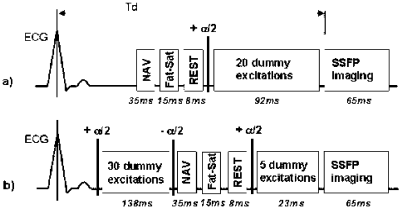
Figure 2. Coronary MRA obtained with a) conventional and b) interrupted SSFP magnetization preparation.
References
1. Oppelt A. et al.; Electromedica 1986; 54:15–18.
2. Stuber M., et al.; Proc. ISMRM 2001; 515.
3. Spuentrup E., et al.; Magn Reson Med. 2002; 47:196–201.
4. Scheffler K., et al.; MRM 2001; 45:1075–1080.
385. Accelerating 3D Cspamm Tagging Using K-t Blast
Salome Ryf, Jeffrey Tsao, Sebastian Kozerke, Peter Boesiger.
Institute for Biomedical Engineering, ETH and University Zurich, Switzerland.
Introduction: Tagging techniques have proven very valuable in extending the understanding of cardiac dynamics and have provided insights into alterations of cardiac motion associated with diseases (1). Recently a three-dimensional (3D) tagging technique for myocardial motion assessment was introduced to provide a true 3D description of cardiac tissue motion (2). Although this method has been shown feasible in volunteers, the large number of recurring breath-holds required for data collection has hampered the application in a larger study population.
A very promising approach for accelerated data acquisition in dynamic imaging has been presented previously (3,4). This method, called k-t BLAST (5), applies sparse sampling to k-t space, thus leading to dense packaging of signal replicas in the reciprocal x-f space. During reconstruction, the aliasing is resolved using knowledge from low-resolution training data.
Purpose: The objective of the current work was to accelerate 3D tagging data acquisition using spatiotemporal undersampling and subsequent repopulation of missing data based on prior knowledge derived from low resolution training data.
Methods: Data acquisition. A 3D tagging pattern is generated using an extension of the 2D-CSPAMM sequence as described elsewhere (2). After tagging preparation in three orthogonal directions with 10 mm grid-line separation, a 3D segmented EPI sequence was applied. Sequence parameters were as follows: FOV: 256×220×102 mm3, matrix: 128×110×51, EPI factor: 11, TR: 35 ms, TE: 6.6 ms, number of heart phases: 15.
For simulation purposes, a fully sampled data set was obtained in a volunteer with no reduction in scan time. Subsequently, this data set was artificially decimated according to the sampling pattern shown in Figure . The overall pattern varies as a function of cardiac phase. The outer regions are sparsely sampled according to a sheared grid pattern; while two central bands in ky–kz space are fully sampled, providing low-resolution training data for prior knowledge based reconstruction (5).
To prove feasibility of the approach, reduced acquisition using the sampling pattern as described above was implemented into the acquisition software of a Philips Gyroscan 1.5T system (Philips Medical Systems, Best, The Netherlands). The current implementation allows for 2.5-fold reduction in scan time by increasing the sampling distance outside the central, fully sampled bands, by a factor of 5. The proposed acquisition scheme was used to obtain 3D CSPAMM tagging data in a healthy volunteer using navigator based guidance for consistent end-expiratory breath-holds as described elsewhere (2).
Data Reconstruction: For k-t BLAST, the data were divided into two sets: a training set and an acquisition set. The training set consisted of the densely sampled central bands of k-space; while the acquisition set consisted of all the data from the k-space periphery and some of the data in the central k-space bands coinciding with the sheared sampling grid in k-t space. Both data sets were inverse Fourier transformed along all axes. The training set yielded a set of low-resolution images in x-f space, while the acquisition set yielded a set of aliased images in x-f space. The aliasing was resolved using the training data as prior information, according to the reconstruction procedure described in Ref. (3). Finally, the training data were substituted back into the reconstruction to further improve data consistency.
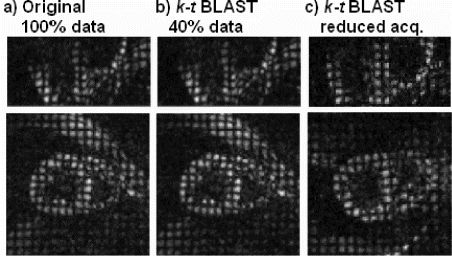
Results and Discussion: Corresponding time frames within the cardiac cycle are shown in Figure depicting the original data (a) and k-t BLAST reconstruction (b) for long-axis (upper row) and short-axis (lower row) orientation. Comparing the original data with the k-t BLAST reconstruction, based only on 40% of the original data, shows only slight differences with the overall features well preserved.
Figure illustrates images obtained with the reduced acquisition scheme in reduced scan time. Tagging features are well preserved indicating the potential of the proposed method to efficiently accelerate 3D cardiac tagging acquisition.
To fully validate the proposed approach, motion parameters derived from fully sampled and undersampled 3D tagging data sets are to be compared next.
Figure 1. Sampling pattern in ky–kz space as a function of cardiac phase (cardiac phases 1–3 are shown) with the four peaks resulting from CSPAMM preparation visible in the central two bands sampled with high density (patterns are cropped along ky for display).
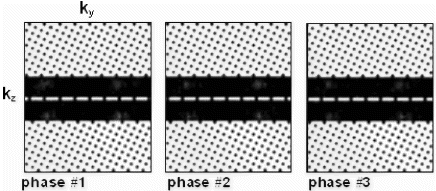
Figure 2. Comparison of 3D tagging images reconstructed from full data (a) and from reduced number of samples in k-t space (40% of full data used) (b) in volunteer #1. Data obtained with the reduced acquisition scheme in volunteer #2 (c). Long-axis (upper row) and short-axis views (lower row) at peak systole are shown.
References
1. Stuber, M., et al., Circulation 1999; 100:361–368.
2. Ryf, S., et al., JMRI 2002; 16:320–325.
3. Tsao, J., et al., MRM 2002 47:202–207.
4. Tsao, J., et al., Proc. 2002; ISMRM
5. Tsao, J., et al., MRM 2002; 46:652–660.
386. Developing a Navigator-Guided Approach to Non-breathhold Multiphase Cardiac Strain Maps Using DENSE
Vinay M. Pai,1 Han Wen.2
Laboratory of Cardiac Energetics, National Institutes of Health, Bethesda, MD, USA, Laboratory of Cardiac Energetics, National Insitutes of Health, Bethesda, MD, USA.
Introduction: An approach is developed which permits non-breathhold measurement of the displacement field of the left ventricular wall over multiple phases of the cardiac cycle. This method can be used to obtain two-dimensional cardiac strain maps over multiple phases of the cardiac cycle with high resolution under normal physiological free breathing conditions. The method combines diaphragm-based cross navigators coupled with phase contrast displacement encoding with stimulated-echo acquisition (DENSE) [1,2].
Purpose: The purpose is to develop a method for obtaining free-breathing multi-phase cardiac strain maps in order to determine the variation in myocardial wall function over the cardiac cycle. This requires implementing a navigator-guided approach by tracking the position of the imaging slice and prospectively correcting this position during the cardiac cycle.
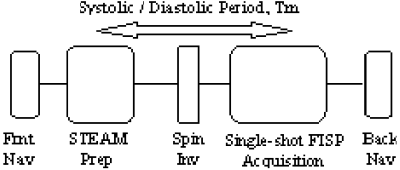
Methods: The scans were performed on a Siemens Sonata 1.5-T whole-body scanner (Siemens Medical Systems, Erlangen, Germany). A block diagram of the navigator-guided DENSE pulse sequence is shown in Figure .
The single-shot FISP-based approach to DENSE acquisition has been discussed elsewhere [3]. In our approach to navigator-guided DENSE imaging, navigators (90–180 crossed navigators) are applied before (FN) and after (BN) the DENSE implementation (Figs. and 2).
An ungated, non-imaging, implementation of the navigators is played out initially in order to determine the acceptable respiratory motion window for imaging. During the gated implementation for imaging, the displacement values obtained from the front navigators are used to check if the diaphragm position is within this respiratory motion window. Standard correlation coefficients are used [4] to determine the displacement of the imaging slice from the displacement obtained by the front navigators. The imaging slice is prospectively corrected, as per the computed displacement, and the back navigators are played out. The displacement value obtained from the back navigators is then used to check whether the diaphragm motion between the front navigators and the center of imaging k-space is less than a predetermined value. While prospective correction is applied to all the imaging acquisitions, only those acquisitions which successfully clear both the checks mentioned above, are accepted. The multiphase implementation is obtained by performing the DENSE exams for a range of mixing periods, or Tm, as shown in Figure .
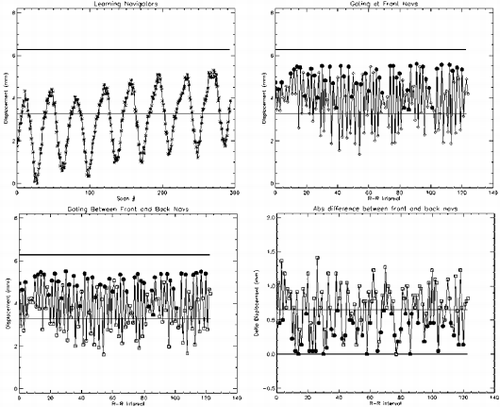
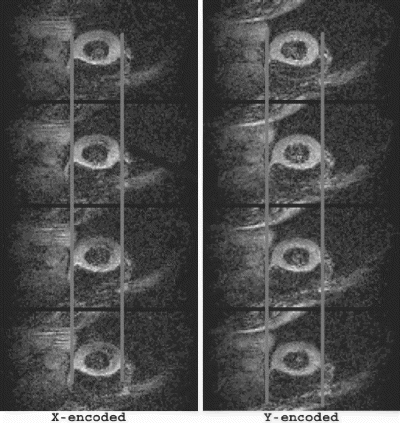
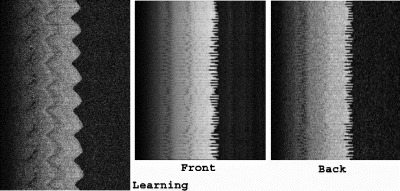
Results: Figure shows the navigator profiles for the learning curve, as well as the navigator profiles from the navigators before and after the DENSE sequence. While the characteristic sinusoidal pattern of respiration is observed in the learning curve, the pattern is overridden in the FN and BN navigators due to the discrete ECG-gated sampling. Figure indicates the cutoff margins in the respiratory cycle, and the dark-filled dots indicate those scans for which the checks indicated above were successfully cleared. In the illustrated study, the displacement acceptance window for the front navigators was +1.0 mm/−2.0 mm about the maximum displacement, while the displacement difference (i.e. the allowable displacement between the front and the back navigators) was 0.65 mm. Figure shows X and Y encoded DENSE images acquired over several phases of the cardiac cycle for a volunteer under free breathing conditions (four phases illustrated in the figure). The temporal resolution between these phases was 25 ms. The vertical lines overlaid on the left ventricle images indicate the success of the navigator approach to prospectively correct for respiratory motion.
These images can be subsequently analyzed by utilizing existing algorithms to develop the multiphase cardiac strain maps.
Conclusions: Navigators can be coupled with phase contrast technique such as displacement encoding with stimulated-echo acquisition (DENSE) in order to obtain the displacement field of the left ventricular wall over multiple phases of the cardiac cycle under non-breathhold conditions. This combination can provide high resolution cardiac strain maps under normal physiological conditions with minimal inconvenience to the patient, as compared to strain maps obtained under breath-hold conditions.
Figure 3. Navigator Profiles for Learning Curve and for Navigators preceding and following the DENSE sequence.
References
1. Callaghan, P T. Principles of Nuclear Magnetic Resonance Microscopy. Oxford: Clarendon Press, 1991; 430 p.
2. Aletras, A H., Ding, S., Balaban, R. S., Wen, H. J. Magn. Reson. Med. 1998; 39:482–490.
3. Wen, H., Bennett, E., Pai, V.M. J. Cardio. Magn. Reson. 2002; 4(1):7–8.
4. Wang, Y., Riederer, S. J., Ehman, R. L. Magn. Reson. Med. 1995; 33:713–719.
387. Comparison of Rectilinear, Radial, and Spider Sampling Schemes in Cine True-FISP Cardiac MRI: Is There an Improvement of Cardiac Functional Parameters with Increase in Temporal Resolution?
Daniel T. Boll, MD,1 Danielle M. Seaman,1 Andrew C. Larson, Ph.D.,2 Orlando Simonetti, Ph.D.,2 Elmar M. Merkle, MD,1 Jeffrey L. Duerk, Ph.D.,1 Jonathan S. Lewin, MD.1
Radiology, University Hospitals of Cleveland, Cleveland, OH, USA, Medical School, Northwestern University, Chicago, IL, USA.
Introduction: Magnetic Resonance Imaging (MRI) has the potential to provide high resolution images of the heart at any part of the cardiac cycle. Its ability to supply excellent contrast between the epicardium and myocardium as well as crucial spatial resolution to distinguish papillary from myocardial structures, establishes cardiac MR as a completely non-invasive method for measuring ventricular volumes. In particular, the enddiastolic and endsystolic left ventricular volumes as well as interdependent ratios such as ejection fraction and left ventricular myocardial mass, are important indicators and predictors of heart failure. The development of steady state imaging with refocusing gradients along all axes (True-ISP) during any Time of Repetition (TR) interval allowed a significant reduction of TR while exploiting differences in the relaxation rates between blood and myocardium, thereby increasing temporal resolution of cardiac imaging. However, employing rectilinear K-space sampling schemes requires multiple cardiac cycles to reconstruct one heart contraction. On the other hand, the implementation of radial K-space acquisition with filtered back-projection (RADIAL) and steady-state projection imaging with dynamic echo train readout (SPIDER), allowed the acquisition of an image series of exactly one heartbeat.
Purpose: To evaluate differences in anatomic definition of cardiac structures and consequent changes in calculated functional parameters with increase in temporal resolution as a function of three sampling schemes in cine True-FISP cardiac MRI.
Methods: Using a 1.5-T MR imager (Magnetom Sonata, Siemens), three K-space sampling schemes of a cine True-FISP sequence were applied in ten healthy volunteers. All sequences provided identical spatial resolution. The imaging protocol consisted of 1) a rectilinear sampling scheme with linear K-space ordering (47.4/1.58/70°/12 TR/TE/FA/ Acquisition Time) with a frame rate of 600 ms per image; 2) a RADIAL sampling scheme (67.5/1.25/50°/3.3 TR/TE/FA/AT) with a frame rate of 82.5 ms per image, with inherently over-sampled low spatial frequencies; and, 3) a SPIDER sampled True-FISP sequence for cine cardiac imaging (52/1.62/55° /1.8 TR/TE/FA/AT) with a frame rate of 90 ms per image. The SPIDER sampling scheme acquired a larger number of radial K-space samples per unit time by collecting a single full symmetric echo pulse plus two asymmetric echoes within each TR. The slice thickness was 5 mm in all trials. The in-plane spatial resolution was 2.3 mm. Two long-axis breathhold series were acquired along with sufficient short axis breathhold series to completely cover the left ventricle.
The signal-to-noise ratio (SNR) for blood and myocardium as well as the contrast-to-noise ratio (CNR) were calculated. Cardiac functional analysis included end-systolic and end-diastolic volumes, ejection fraction, and left ventricular mass. Functional analysis was performed semi-automatically on the short axis series by two independent readers three times for each volunteer and for each sampling modality, by defining left ventricular myocardial wall as well as excluding papillary muscles and apical diaphragmal structures. Statistical analysis evaluated the changes of the functional measurement results based on three sampling techniques. Intra-and interobserver reliability were also determined.
Results: Functional analysis of intraobserver reliability revealed homogenous intraobserver patterns without statistically significant differences in all data subsets of the three sampling schemes analyzed. Intraobserver kappa values ranged from 0.94–0.99.
The interobserver evaluation proved that the measurement results of both readers were consistent in all data subsets of the sampling schemes analyzed and did not show significant differences. Interobserver kappa values ranged from 0.97–0.99.
A direct interstudy comparison of SPIDER and RADIAL sampled True-FISP sequences showed no statistically significant differences in the measured functional parameters. The interstudy kappa values ranged from 0.88–0.98. However, statistically significant differences leading to an underestimation of cardiac volumes and ejection fraction in rectilinear sampled sequences were identified in every volumetric subset when comparing rectilinear with either RADIAL or SPIDER sampling techniques. True-FISP imaging with a rectilinear K-space sampling schemes revealed apparent weaknesses in imaging basal myocardial wall, apical papillary muscle depiction and apical differentiation between diaphragmal and myocardial structures compared to the faster RADIAL and SPIDER sampling schemes. Anatomical border definition in those areas differed significantly depending on temporal resolution and led inconsistently to smaller left cardiac volumes when slower rectilinear sampling schemes are employed. The interstudy kappa values ranged from 0.6–0.79 and 0.37–0.76, respectively.
The quantitative analysis showed no significant differences in CNR between the rectilinear and SPIDER sampled sequences, whereas a significant increase in noise was observed in RADIAL sampled True-FISP sequences.
Conclusions: Employing faster sampling schemes such as RADIAL and SPIDER provided enhanced anatomical border definition while maintaining necessary CNR and SNR for quantitative assessment of functional cardiac parameters. We hypothesize that the high temporal resolution of RADIAL and SPIDER sequences, on the order of 90 ms per frame, thereby improves the accuracy of the functional parameters for clinical use in cardiac MRI compared to rectilinear methods. As such, we conclude that future functional cardiac assessment should be made with RADIAL or SPIDER True-FISP acquisitions.
388. Clinical Implementation of MR-Based Pediatric Cardiovascular Surgical Planning
Dave H. Frakes, MS,1 Mark J. T. Smith, Ph.D.,2 Mark Fogel, MD,3 Shiva Sharma, MD,4 Ajit P. Yoganathan, Ph.D.1
Bme, Georgia Institute of Technology, Atlanta, GA, USA, Ece, Georgia Institute of Technlogy, Atlanta, GA, USA, Children's Hospital of Philadelphia, Philadelphia, PA, USA, Egleston Children's Hospital, Atlanta, GA, USA.
Introduction: One area of rapidly growing significance in the realm of magnetic resonance (MR) applications is that of MR-based pediatric cardiovascular surgical planning. More specifically, the use of MR reconstruction in pre-operative anatomy visualization, and in pre-operative evaluation of potential post-operative anatomies, shows great promise. In this paper we will demonstrate methodologies currently in place for the surgical planning of the Total Cavopulmonary Connection (TCPC), and focus on the clinical implementation of our techniques.
The total cavopulmonary connection is a palliative surgical repair performed on children born with single ventricle (SV) physiology. Children with such physiology have a mixing of oxygenated and deoxygenated blood, which when left untreated leads to inadequate tissue oxygenation [1]. In order to prevent systemic and pulmonary blood from mixing, the surgeon disconnects the pulmonary artery from its ventricular origin, anastomoses the superior vena cava to the unbranched right pulmonary artery (RPA), and constructs a lateral tunnel through the right atrium connecting the inferior vena cava with the RPA. The procedure results in a complete bypass of the right heart with the single ventricle driving blood through the entire circulatory system.
Purpose: Much of the power produced by the single ventricle pump is consumed in the systemic circulation. For this reason minimizing power loss in the modified district is critical for optimal surgical outcomes. Historically, the surgeon's experience has dictated the implemented intervention with little attention paid to achieving minimal power loss. To refocus connection choice on fluid dynamics, our group is developing surgical planning techniques for the TCPC. Such techniques will aid the surgeon in visualizing pre-operative anatomies and then in selecting the optimal TCPC option from possible alternatives for specific patients. This methodology employs combined use of magnetic resonance (MR) imaging and computational fluid dynamics (CFD) to elucidate flow conditions among alternative post-operative morphologies prior to performing the surgical procedure. The ultimate goal of this research is the clinical implementation of the proposed tool to facilitate optimal surgical outcome.
Methods: Our technique begins with the acquisition of MR images containing anatomical information. These images are then used to construct three-dimensional morphological models. In an idealized scenario, surgeons and engineers would then collaboratively construct computer models of possible connections within the framework of the pre-operative reconstructions to serve as input for CFD simulations. These simulations yield the information required to evaluate power loss, which has been identified as the primary factor dictating success or failure in post-operative scenarios [2]. Although the creation of unique models for each individual does allow the determination of the optimal post-operative anatomy for that patient, creating that exact anatomy is difficult to implement in clinical practice. For this reason we have chosen to focus on the general characteristics of successful anatomies in order to establish more achievable goals associated with the execution of the surgery.
Every patient possesses a different pre-operative anatomy. Due to the specifics of certain anatomies, not all characteristics that we have observed to be advantageous in terms of fluid dynamics can necessarily be imparted to every post-operative configuration. In order to address this clinical implementation problem we are developing a template system to be used in surgical planning. This system uses the experimental data we have acquired to identify various successful post-surgical configurations. Pre-operative patient anatomy is a constraint that can obviously not be altered. Now with the aid of the preoperative anatomical reconstructions, the surgeon can select a template that is known to be implementable within the framework of the anatomy that is already present.
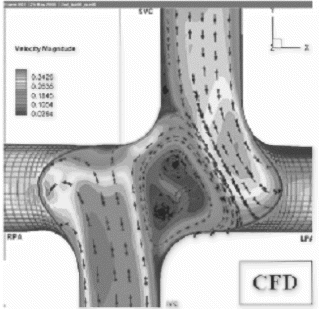
Results: Models of post-operative anatomies have been extensively explored in terms of the power loss manifestations of their components. The results yielded by CFD simulations on idealized in vitro anatomies, an example of which is displayed in Figure , have provided a wealth of information pertaining to the contribution of connection characteristics to minimized power loss.
Furthermore, in vivo analysis has allowed us to identify characteristics contributing to successful and non-successful real world configurations, as the efficacy of the operation is known for individuals having already been surgically treated. Accordingly it is now possible for the surgeon to establish specific goals to accomplish in the execution of the surgery, that when achieved contribute to an efficient configuration. These specific goals as well as new in vitro and in vivo results will be discussed.
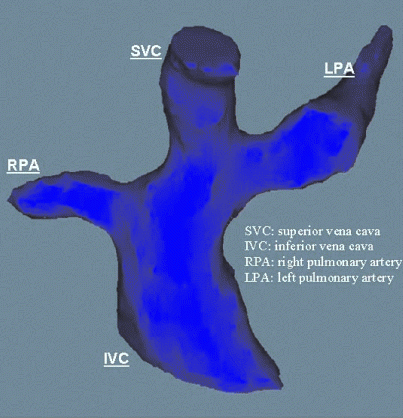
The creation of an effective, validated reconstruction technique in conjunction with this project has been accomplished [3]. This has enabled us to perform extensive analysis of preoperative patient anatomies via reconstruction. One such reconstruction product is displayed in Fig. .
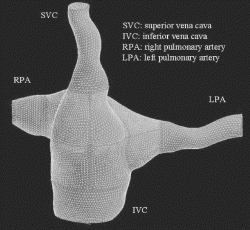
Transitioning patient reconstructions into CFD meshes, like that displayed in Figure , provides the input necessary to perform CFD simulation on real patient anatomies.
Results from these simulations will yield more specific data describing in vivo flow characteristics. Based on this in vivo data, previously acquired in vitro data, and the analysis of previous surgeries, templates describing achievable and efficient post-operative configurations have been realized. These templates and their salient components will de discussed.
Conclusions: The significance of this work lies not only in the technical merit of the proposed methodology, but also in the clinical focus that the project has taken. By shifting our attention to developing a clinically implementable system, we have allowed the experimental value of past research to be realized in a clinical setting. The development of the proposed template system creates a surgical tool capable of providing the surgeon with valuable practical information. This information enables the surgeon to execute a successful operation through the creation of TCPC characteristics known to promote efficient flow and lead to optimal surgical outcomes.
References
[1] Reller, M. D., McDonald, R. W., Gerlis, L.M., Thornburg, K. L. Cardiac Embryology: Basic Review and Clinical Correlations. J. Am. Soc. Echocardiography. Vol. 4; pp. 519–532, Jan. 1991.
[2] Healy, T. M.,Lucas, C., Yoganathan, A. P. Non-invasive Fluid Dynamic Power Loss Assessments for Total Cavopulmonary Connections using the Viscous Dissipation Function: A Feasibility Study. J. Biomech. Eng. (in press), 2001.
[3] Frakes, D. H., Conrad, C. P., Healy, T. M. Monaco, J. W., Fogel, M., Smith, M. J. T., Yoganathan, A. P. Application of an Adaptive Control Grid Interpolation Technique to Morphological Vascular Reconstruction, IEEE Trans. Biomed, Eng. (in press), 2002.
389. Rapid First-Pass Myocardial Perfusion Imaging Combining Parallel Acquisition with TrueFISP
Mark Crowe,1 Qiang Zhang, Ph.D.,2 Daniel Lee,3 Frederick Epstein, Ph.D.,4 Orlando Simonetti, Ph.D.2
Northwestern University, Evanston, IL, USA, Siemens Medical Solutions, Chicago, IL, USA, Northwestern University, Chicago, IL, USA, University of Virginia, Charlottesville, VA, USA.
Introduction: First-pass perfusion studies require imaging of the entire heart every cardiac cycle. This typically requires 6–8 slices, or an acquisition time of 100 msec–120 msec per slice at normal heart rates. Pulse sequences such as TurboFLASH (TFL), hybrid GRE-EPI, and TrueFISP (TRUFI) have been used successfully for perfusion imaging [1–3]. TRUFI has demonstrated improved SNR and CNR when compared to TFL [4]. However, the TRUFI requirements of full gradient rewinding and additional RF pulsing to achieve steady-state make it less efficient than TFL or GRE-EPI. Parallel acquisition techniques (PAT) have been recently introduced as methods of reducing scan time, at the expense of SNR. A new pulse sequence for first-pass perfusion imaging combining the parallel acquisition technique GRAPPA [5], together with a saturation-recovery TRUFI sequence is described here. The high SNR and CNR attained from TrueFISP, along with the speed of parallel imaging may make this sequence ideal for perfusion imaging.
Purpose: Demonstrate the feasibility of combining parallel acquisition with TrueFISP to optimize the tradeoff between acquisition time and SNR/CNR in first-pass perfusion imaging.
Methods: All imaging was performed on a Siemens 1.5T Magnetom Sonata scanner (Siemens Medical Solutions, Iselin NJ) with a high performance gradient system (40 mT/m amplitude, 200 mT/m/sec slew rate) and an 8-channel body coil array. The TRUFI+PAT sequence was implemented using GRAPPA with an acceleration factor of 2. Coil sensitivity calibration data were obtained from fully sampled central k-space (12 lines) acquired as part of each image.
Images were acquired from a phantom using four different acquisition techniques: TFL, GRE-EPI, TRUFI, and TRUFI+PAT. The imaging parameters common to all sequences were: 72×128 matrix, 320 mm×240 mm FOV, and 8 mm slice thickness. A total of 42 lines were acquired with TRUFI+PAT to obtain the same resolution and FOV as the other sequences.
SNR and CNR for these four sequences were compared in phantom compartments of different T1 values to mimic the contrast between enhanced and un-enhanced myocardium. T1/T2 for the two compartments were 222/40 msec and 802/158 msec, respectively. The shorter T1 compartment was used for the SNR calculation, and CNR was based on the difference between the two compartments.The TRUFI+PAT technique was tested in two animals and one normal human volunteer at rest. The animal studies consisted of a pig model of myocardial infarction, and a dog model of myocardial ischemia.
Results: The SNR and CNR measurements from the phantom images are listed in Table . Of the four techniques, TRUFI demonstrated the highest SNR and CNR, but also the longest acquisition time. Combining PAT with TRUFI resulted in a significant reduction in acquisition time with only a slight loss in SNR and CNR. TRUFI+PAT gave a higher SNR and CNR than both GRE–EPI and TFL at a comparable acquisition time.
In the animal and human studies, TRUFI+ PAT images showed uniform enhancement of normal myocardium. In the animal studies, high contrast between regions of normal and abnormal perfusion was observed as shown in the example images in Figure .
Conclusions: Initial results suggest that TRUFI+PAT can provide whole heart coverage with improved SNR and CNR over existing first-pass perfusion sequences.
Figure 1. TRUFI+PAT example images from an ischemic dog model showing reduced perfusion in the inferior wall.

Table 1. Imaging parameters used for each technique
Table 2. SNR and CNR results from the phantom study
References:
1. Atkinson, D. J., Burnstein, D., Edelman, R. R. Radiology 1990; 174:757–762.
2. Ding, S., Wolff, S. D., Epstein, F. H. Magn. Reson. Med. 1998; 39:514–519.
3. Jerosch-Herold, M., Huang, H., Wilke, N. ISMRM Meet. Abstr. 1999; 1882.
4. Schreiber, W. G., Schmitt, M., Kalden, P., et al. Fortschr Röntgenstr 2001; 173:205–210.
5. Griswold, M. A., Jakob, P. M., Heidemann, R. M., Nittka, M., Jellus, V., Wang, J., Kiefer, B., Haase, A. Magn. Reson. Med. 2002; 47:1202–1210.
390. 3D Motion Adapted Gating (3D MAG): A New Navigator Technique for Accelerated Acquisition of Free Breathing Navigator Gated Coronary MR Angiography (MRA)
Matthias Hackenbroch, MD,1 Ulrich Hofer, MD,1 Gabriele Beck,2 Juergen Gieseke,2 Hans Schild, MD,1 Torsten Sommer, MD.1
Department of Radiology, University of Bonn, Bonn, Germany, Philips Medical Systems, Best, Netherlands.
Introduction: Free breathing coronary MRA with respiratory compensation in navigator technique reduces motion artefacts and allows acquisition of high-resolution 3D data sets. However, this results in prolonged scan time due to low navigator efficiency. 3D motion adapted gating (3D MAG) is a new respiratory navigator technique which improves navigator scan efficiency and reduces scan time.
Purpose: The aim of this study was to evaluate the influence of 3D MAG on total acquisition time, image quality and diagnostic accuracy.
Methods: Current implementation of respiratory gating is based on a fixed gating window that is determined from a short navigator preparation phase. Since the motion statistics may change during the scan and the overall optimal gating window may differ from the initially chosen the need for an adaptive method has been indicated. 3D MAG uses multiple gating windows grouped around the conventional gating window. Additionally each gating window is divided into three bands which are assigned to different portions of k-space. The navigator information is used in real time to decide prospectively which band is optimal and which part of k-space has to be acquired next. In other words the navigator window is not dependent on the initial chosen window but is continuously adapting in real time to the actual diaphragmatic drift to choose the overall optimal end-expiratory gating window. The scan is terminated when three consecutive bands are filled and one complete image dataset is collected (Figure ).
48 patients with suspected coronary artery disease underwent cardiac catheterization and free breathing navigator gated coronary MRA (Intera, 1.5 T, Philips Medical Systems, Release 8.1.3). An ECG-gated, 3D segmented-k-space gradient echo sequence (TFE, 5 mm gating window, acquisition window 82 ms, in plane resolution 0.70×0.79 mm) was used. In each patient scans of the coronary arteries (CA) with and without 3D MAG were performed in random order.
The following parameters were evaluated for both sequences: 1. navigator efficiency and total acquisition time, 2. visualized CA length, 3. qualitative assessment of CA visualization (grade 1–4: from excellent (1) to poor (4)) and 4. detection of stenoses>50% in correlation to catheter angiography.
Results: The average navigator efficiencies of the LCA scan and the RCA scan were 46.2±9.5% and 45.3±9.4% in the scans with and 38.8±12.6% and 38.1±12.5% in the scans without 3D MAG (p<0.05). Average acquisition times of the LCA and the RCA were 7.4±1.1 min and 7.6±1.1 min with 3D MAG, compared to 9.2±1.4 min and 9.4±1.4 min without 3D MAG (p<0.05). There were no significant differences in the average contiguously visualized vessel lengths between the scans with and without 3D MAG (p>0.05).
The average scores in the qualitative assessment of the visualization of LM, proximal LAD, proximal LCX and RCA were equal in the scans with and without 3D MAG (p>0.05).There was no significant difference in the sensitivity (81% (22/27) vs. 78% (21/27); p>0.05) and specificity (84% (16/19) vs. 85% (17/20); p>0.05) in the detection of coronary artery stenoses between scans with and without 3D MAG.
Conclusions: 3D MAG is a promising new navigator technique which provides accelerated acquisition of navigator gated coronary MRA while maintaining image quality and diagnostic accuracy. In free breathing 3D coronary MRA acquisition times can be reduced on average by more than 19% for both CA compared to conventional navigator technique.
391. Rapid Peripheral Angiography Using SSFP with Phase-Based Fat-Nulling
Brian A. Hargreaves, Ph.D., Krishna S. Nayak, Ph.D. Dwight G. Nishimura, Ph.D.
Electrical Engineering, Stanford University, Stanford, CA, USA.
Introduction: MRI is a non-invasive technique that can be used for evaluation of peripheral vascular disease, which is a significant cause of disability. For peripheral angiography, flow-independent contrast is important, particularly for ischemic regions where flow is extremely slow.
Refocused Steady State Free Precession (SSFP) sequences (also commercially known as True-FISP, FIESTA or balanced-FFE) provide rapid imaging with high signal and contrast [1]. Modern gradient systems enable SSFP imaging with sufficiently short repetition times that off-resonance artifacts are minimal. SSFP easily produces very good contrast between blood and muscle. Although fat produces a high signal in SSFP, several schemes for fat-suppressed SSFP imaging have recently been proposed [2,3]. Although promising, these schemes all increase scan times. We propose a simple phase-based SSFP technique for flow-independent, fat-suppressed angiography. The signal observed in SSFP sequences is sensitive to resonant frequency, as shown in Figure . The signal magnitude consists of bands of width 1/TR. The signal is refocused at TE=TR/2 but successive bands are 180 degrees out of phase. Selecting TR as the reciprocal of the chemical shift frequency between water and fat, and TE=TR/2, results in robust phase separation of water and fat in images. By setting to zero the pixels that have a phase corresponding to the fat phase, water-sensitive images may be obtained and used as angiograms.
Purpose: This work investigates the feasibility of exploiting the inherent fat-water phase difference in SSFP for rapid flow-independent angiography.
Methods: Angiograms of the lower leg of normal volunteers were acquired using a 1.5 T GE Signa LX scanner with 40 mT/m, 150 T/m/s gradients, and a linear extremity transmit-receive coil. A 3D Cartesian SSFP sequence was used with a 60-degree flip angle, TR/TE=4.6/2.3 ms,M FOV=36×12×12 cm, isotropic 1 mm resolution and a readout bandwidth of +/− 125 kHz. All gradients are refocused over a TR interval, and the readout was along the S/I direction. The protocol did not use contrast agents or specialized shimming. The total scan time was 75 seconds.
Complex 3D images were reconstructed from the data. For robustness, any unwanted phase is removed from the images before separating water and fat. On a per-slice basis, all data points were plotted as a scatter plot in the complex plane. A linear regression was used to determine the average slope of the data, which were then multiplied by a constant phase factor to rotate this line to have a slope of zero. Next, data were separated into lipid and water images based on the sign of the real part. The water images were used to form maximum-intensity projection angiograms.
Results: Figure shows a maximum-intensity projection at three angles from a normal volunteer. The vessels in the popliteal region are clearly shown in the images. Vessel brightness does not vary with position, showing that the contrast is not dependent on flow. Although refocused SSFP sequences using shorter repetition times are common, we did not notice significant degradation due to off-resonance. However, we expect that the use of a localized 3D shimming routine would provide increased robustness for patient scanning, scanning larger regions.
Conclusion: Refocused SSFP with phase-based fat nulling provides asimple, rapid method of creating 3D flow-independentangiograms in regions of slow flow without a contrast agent.
Figure 1. Signal magnitude (a) and phase (b) as a function of resonant frequency offset for SSFP. At TR=4.6 ms and TE=2.3 ms, fat (−220 Hz) and water (0 Hz) are 180 degrees out of phase. This phase separation can be used to null the fat signal in images.
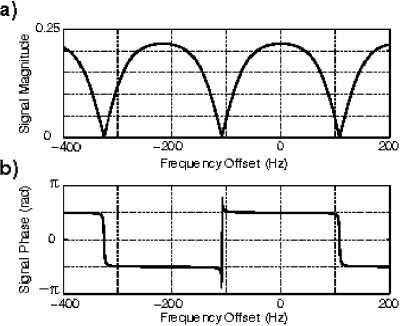
Figure 2. Maximum-intensity projections from a 3D SSFP image set. Fat signal is first nulled by exploiting the fat-water phase difference in the complex images. For 1 mm isotropic resolution over a 36×12×12 cm FOV, the scan time was just 75 seconds.
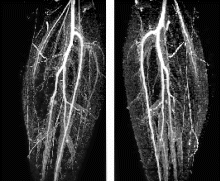
References
1. Oppelt, A., et al. Electromedica 1986; 54:15–18.
2. Scheffler, K., et al. Mag. Reson. Med. 2001; 45:1075–1080.
3. Vasanawala, S., et al. Mag. Reson. Med. 2000; 43:82–90.
392. Normal Human Left and Right Ventricular Dimensions for MRI as Assessed by TGE and SSFP Imaging Sequences
Khaled Alfakih, MBBS,1 Sven Plein, MD,1 Holger Thiele, MD,2 Tim Jones, MSc,1 John Ridgway, Ph.D.,3 Mohan Sivananthan, MD.1
Cardiac MRI, Leeds General Infirmary, Leeds, United Kingdom, Department of Cardiology, University of Leipzig-Heart Center, Leipzig, Germany, Department of Medical Physics, Leeds General Infirmary, Leeds, United Kingdom.
Introduction: Cardiac MRI has been shown to be an accurate and reproducible tool for the estimation of both left ventricular (LV) and right ventricular (RV) mass and volumes. Currently the two pulse sequences, which are in common clinical and research use for acquisition of volumes datasets, are segmented k-space turbo gradient echo (TGE) and more recently steady-state free precession techniques (SSFP). Lorenz et al developed the first normal range for cardiac MRI, utilizing a conventional cine gradient echo sequence performed without breath holding, and reported a mean LV mass of 178±31 for men and of 125±26 for women.
SSFP pulse sequences are becoming the most frequently used technique (because of improved delineation of the endocardial borders), and TGE pulse sequences are now being acquired with breath holding. Comparisons of ventricular volumes between TGE and SSFP pulse sequences showed a systematic difference between the two techniques.
Purpose: To establish normal ranges for the new SSFP pulse sequence as well as for TGE with breath holding.
Methods: We studied 60 normal subjects (30 male and 30 female) with no past medical history, a normal blood pressure, normal cardiovascular examination and a normal resting ECG. MRI studies were performed on a 1.5-Tesla Philips Intera CV MRI system. Imaging was performed using a five-element cardiac phased-array coil with breath holding and vectorcardiographic gating. Survey scans were followed by cine imaging sequences in the axial, two-chamber, and four-chamber planes to allow planning of the left ventricular short axis orientation. Multiple-slice data sets, parallel to the mitral valve, covering the heart in 10–14 short axis slices were acquired using two methods: 1) A TGE pulse sequence (TR=8.8 ms, TE=5.2 ms, flip angle=35°). 2) A SSFP pulse sequence (TR=3.34 ms, TE=1.67 ms, flip angle=55°). Image analysis was performed off-line using Mass analysis software. To minimize subjectivity in contour tracing, we used previously described criteria for the delineation of cardiac borders (1). In all data sets one experienced observer manually traced the contours of the LV and RV at end-diastole and end-systole. LV and RV end-diastolic volume (EDV) and end-systolic volumes (ESV) were computed using a modified Simpson's rule. LV and RV Stroke volume (SV), ejection fraction (EF) and LV mass were calculated. Interobserver as well as intraobserver variability was assessed on six randomly selected data sets after a 12 week interval.
For all parameters the mean±standard deviation were calculated. Interobserver and intraobserver variability were calculated using Bland and Altman's method. For the difference in measurements between males and females independent sample t-tests were performed. For the difference between TGE and SSFP measurements paired sample t-test were performed.
Results: Table shows mean±standard deviation for all LV and RV volumes for both TGE and SSFP acquisitions for both men and women. The SSFP technique measurements for LV and RV EDV were larger (P<0.0001), LV and RV EF were smaller (P=0.0001 and 0.0005) and the LV mass was smaller (P<0.0001) than the equivalent parameters acquired by the TGE technique (Table ).
There was also a statistically significant difference in volumes and mass between men and women which was similar in both pulse sequences. This was present in the LV and RV EDV as well as LV mass (P<0.0001) and for the RV EF (P=0.004 TGE, P=0.001 SSFP) but not in the LV EF (Table ).
Conclusion: We have defined normal ranges for LV and RV volumes in a cohort of normal adults who were screened for cardiovascular disease. The previously reported differences between measurements based on TGE and SSFP pulse sequences were confirmed in this study. This emphasizes the need for separate normal ranges for the different pulse sequences and underlines that the normal ranges for the different pulse sequences are not interchangeable. The results also demonstrate a gender difference in the LV and RV volumes as previously described.
Reference:
1. Lorenz CH, Walker ES, Morgan VL, Klein SS, Graham TP Jr. Normal human right and left ventricular mass, systolic function, and gender differences by cine magnetic resonance imaging. J. Cardiovasc. Magn. Reson, 1999; 1:7–21.
393. Improving Contrast in 3D True-FISP Coronary Artery Imaging Using a Contrast Agent
Vibhas S. Deshpande, MS, Stephanie M. Shors, MD, Christopher J. Francois, MD, Richard M. McCarthy, MD, Steven M. Shea, MS, Paul Finn, MD, Debiao Li, Ph.D.
Radiology, Northwestern University, Chicago, IL, USA.
Introduction: 3D trueFISP (steady-state with free precession) is a promising technique for coronary artery imaging (1). The advantage of using trueFISP is the higher signal-to-noise ratio (SNR) than FLASH (fast low-angle shot). However, if the frequency is off-resonance, sub-optimal fat suppression may hinder the visualization of coronary arteries. In addition, due to data acquisition during signal transience, background tissues such as myocardium may also obscure coronary artery depiction. T1-shortening agents have been shown to be extremely useful for improving coronary artery-background contrast-to-noise ratio (CNR) in conjunction with 3D FLASH MRA (2). The hypothesis here is that T1-shortening agents can also improve the CNR in 3D trueFISP coronary artery imaging.
Purpose: The purpose of this work was to evaluate the potential benefits of contrast agent in improving CNR with 3D trueFISP coronary MRA. A magnetization preparation (MP) scheme for uniform background suppression was developed.
Methods: A 3D segmented trueFISP sequence was used for data acquisition with ‘n’ centrically reordered phase-encoding lines per cardiac cycle. A MP phase preceded data acquisition. It consisted of a 90° saturation pulse, a time delay of 300 ms, an inversion pulse, an inversion time (TI), and 20 dummy cycles with linearly increasing flip angles. The saturation pulse makes the magnetization of all species with relatively longer T1 s to be similar before data acquisition. Therefore, the background can be suppressed uniformly over a large T1 range with a single TI value. In addition, saturation recovery makes the background suppression insensitive to variations in heart rate and poor ECG triggering (3). The optimal TI for fat signal suppression was estimated using simulations.
Simulations. Computer simulations were performed to determine the optimal TI for saturation of the fat signal. The parameters used for the simulations were as follows: R–R interval=1 s, TR/TE/flip angle=4.05 ms/2.03 ms/70°, T1/T2blood=50/36 ms, T1/T2fat=250/60 ms.
Volunteer Studies. Coronary artery imaging was performed in healthy volunteers (n=10) to assess the benefits of contrast injection. The imaging parameters were as follows: TR/TE/flip angle=4.05 ms/2.03 ms/70°, TI=130 ms (for contrast-enhanced imaging only), FOV=(160–175)×380 mm2, acquisition matrix=(100–140)×512, number of partitions=6, slab thickness=18 mm, breath-hold time=24 cardiac cycles, contrast dose=40 cc, injection rate=1.6 cc/s. Magnetization preparation was applied in post-contrast imaging only. SNR and CNR were compared between pre- and post-contrast images.
Results: Simulations. From the simulations, the optimal TI for fat saturation was found to be 130 ms. Figure shows the simulated signal trajectories of blood and fat with the proposed MP scheme. Notice that the fat signal is at minimum after 20 dummy cycles when the center of k-space is acquired.
Volunteer Studies. Maximum intensity projections of the right coronary artery (RCA) and left anterior descending (LAD) coronary artery are shown in Figure . In the pre-contrast RCA image, the depiction of the artery was hindered by the surrounding fat signal, which was poorly suppressed. The post-contrast image shows a markedly improved fat suppression. In the LAD and RCA images, contrast injection substantially improved the delineation of the distal portions of the arteries due to background suppression. Coronary SNR was 12.8±2.7 and 10.2±2.8 (p<0.05), while CNR was 3.2±1.8 and 5.7±1.3 (p<0.05) in pre- and post-contrast images, respectively.
Conclusion: 3D segmented trueFISP with FS is a promising approach for coronary artery imaging. A limitation of using spectrally selective fat suppression is the reduction in FS pulse flip angle at off-resonance and therefore, loss of fat suppression. With contrast injection, IR can be used to effectively null the fat and myocardium using their T1 properties while blood signal is little affected. Although coronary SNR was not improved, uniform background suppression enables better delineation of the coronary arteries and facilitates image processing. In conclusion, contrast agent is useful for coronary artery imaging with 3D trueFISP. Patient studies are required to assess its utility for improved disease detection.
Table 1. Mean values±SD for all LV and RV volumes in both TGE and SSFP for both men and women
Figure 1. Simulation results showing the blood signal (solid line) and fat signal (dotted line) after MP. The fat signal was minimum after 20 dummy cycles when the center of k-space was acquired.
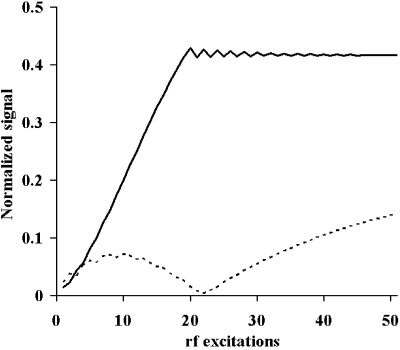
Figure 2. Pre- and post-contrast images of the RCA and LAD. Notice that the fat signal is poorly suppressed in (a) (dashed arrow). The fat and other background signals are well suppressed in (b). As a result, the delineation of the RCA and LAD, especially the distal portions (arrowheads), is markedly improved in post-contrast images (b,d) as compared to pre-contrast images (a,c).
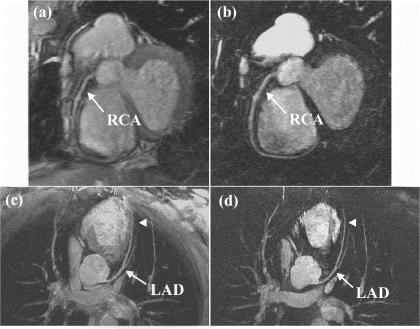
References
1. Deshpande, V. S., et al. Magn. Reson. Med. 46:494, 2001.
2. Li, D., et al. Radiology 219:270, 2001.
3. Tsekos, N. V., et al. MRM 34:530, 1995.
394. Comparison Between Spiral and FLASH Phase Velocity Mapping, with and without Breath-Holding, for the Assessment of Right and Left Coronary Artery Flow Velocity
Jennifer Keegan, Ph.D.,1 Peter D. Gatehouse, Ph.D.,1 Guang-Zhong Yang, Ph.D.,2 David N. Firmin, Ph.D.1
Royal Brompton Hospital, London, United Kingdom, Imperial College of Science Technology and Medicine, London, United Kingdom.
Introduction: Coronary artery blood flow measurement is generally performed using a breath-hold segmented FLASH phase velocity mapping sequence, with view-sharing resulting in an increased effective temporal resolution (1). However, the long acquisition window results in considerable motion blurring and studies are confined to the left coronary artery which is less mobile than the right (2). In addition, breath-holding limits the spatial and temporal resolution achievable and the use of view-sharing prohibits the implementation of fat suppression, resulting in decreased vessel contrast and increased problems with partially occupied pixels at the vessel boundary. Fat-suppressed free-breathing acquisitions are possible using navigator-gating, giving improved spatial and temporal resolution (3), but the study duration is considerably increased, posing a particular problem for those performed under pharmacological stress. We have developed an interleaved spiral phase velocity mapping sequence which potentially allows the more rapid acquisition of high temporal and high spatial resolution coronary flow velocity data (4).
Purpose: The aim of this work is to compare coronary flow velocity curves obtained with breath-hold and free-breathing FLASH and breath-hold and free-breathing spiral sequences in the right and left arteries of healthy volunteers.
Methods: Flow velocity curves were obtained in 6 right (rca) and 3 left (lca) coronary arteries using breath-hold segmented FLASH (BH_FL), free-breathing FLASH (FB_FL), breath-hold interleaved spiral (BH_SP) and free-breathing interleaved spiral (FB_SP) sequences on a Siemens Sonata scanner. Free-breathing studies were acquired using a diaphragmatic navigator and a 5 mm acceptance window. Breath-hold acquisitions were performed in end-expiration. The parameters implemented for each sequence are shown in Table . The poorer spatial resolution of the FLASH studies (compared to the spiral) was dictated by the longer acquisition durations. Although it would have been possible to obtain an equivalent resolution for the free-breathing FLASH study, the acquisition duration would have been 960 cardiac cycles (assuming no drifting in the respiratory efficiency) which was thought to be unfeasibly long. For all sequences, the velocity encoding was +/− 25 cm/s. For the BH_SP sequence, the velocity encoded interleafs contributing to the phase maps to be subtracted were acquired consecutively in the same cardiac cycle (resulting in a longer acquisition window-covering 2 spiral interleafs-and a poorer temporal resolution) whereas for the FB_SP sequence, they were acquired on alternate cycles.
Flow velocity curves for each subject were plotted for each sequence and the mean flow velocities over the cardiac cycle determined, together with the peak diastolic and systolic values. Paired t-tests (with Bonferroni correction for multiple testing) were used to determine the significance of any differences from those values obtained using the high spatial and high temporal resolution FB_SP sequence.
Results: Figure shows the mean (+/− SD) flow velocity curves in the right (a) and left (b) coronary arteries respectively, as measured by the high temporal and high spatial resolution FB_SP sequence. The temporal flow profiles were highly consistent, with all rca studies showing a sharp peak in flow velocity 70–100 ms after the R-wave followed by a second smaller and broader peak at approximately 400 ms. The lca studies showed a rapid fall in flow velocity to a minimum at approximately 70 ms after the R-wave followed by rapid rise to a peak at approximately 110 ms, with further peaks at approximately 400 ms and 600 ms. These curves are uncorrected for the through-plane motion of the heart itself.
Table shows the mean velocities measured over the cardiac cycle and the peak systolic and diastolic velocities, as measured by all 4 sequences, for all 9 arteries.
There were no significant differences in any of the parameters between the FB_SP and FB_FL sequences. In general, the BH_SP sequence agreed well with the FB_SP sequence but deviations occurred at times of rapid coronary motion, particularly for small vessels. For this sequence the velocity encoded pair of interleafs was output consecutively on the same cardiac cycle, and at times of rapid motion, the interleaf separation time of 20 ms was sufficient for substantial mis-registration of the vessel in the subtracted phase map, resulting in velocity mapping errors and deviations from the FB_SP results. For the BH_FL sequence, motion during the long acquisition window and the absence of fat suppression frequently resulted in the artery not being seen and when visible, velocities were consistently lower than those obtained with FB_SP sequence. Although this was a particular problem for the more mobile rca, the velocity profiles of the left arteries were also blunted and visibility in systole was frequently difficult. Figure shows individual flow velocity curves for a right (a) and left (b) artery as measured by all 4 techniques.
Conclusions: We have shown that the FB_SP sequence developed correlates closely with with the FB_FL sequence, the latter requiring a study duration nearly 10×longer for the same spatial resolution. Fat suppression, by means of a water-only excitation pulse, enables the vessel to be clearly delineated at all times within the cardiac cycle and reduces problems arising from partially occupied pixels. The high temporal resolution achieved is necessary to resolve the sharp peaks in the temporal flow profiles of both the right and left arteries (Figure ) with the short acquisition window being needed to reduce motion blurring of the arteries, the latter being a particular problem for the right coronary.
Figure 1. Mean (+/− SD) velocity curves in right (a) and left (b) coronary arteries measured with the FB_SP sequence.

Figure 2. Example right (a) and left (b) flow profiles (black circles: FB_SP, open circles: FB_FL, red circles: BH_FL, open green triangles: BH_SP).
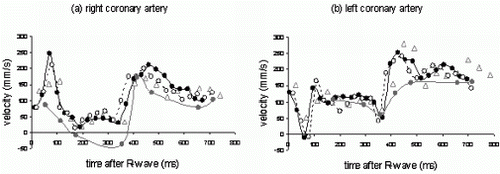
Table 1. Sequence parameters
Table 2. Comparison of FB_SP, FB_FL, BH_SP, and BH_FL (N=9)
References
(1) Shibata, et al. JMRI 1999.
(2) Hofman, et al. JMRI 1998.
(3) Nagel, et al. MRM 1999.
(4) Keegan, et al. Proc. ISMRM, Hawaii 2002.
395. Characterization of Subacute Radiofrequency Ablation Lesions with Contrast-Enhanced Magnetic Resonance Imaging
Timm Dickfeld, Ritsushi Kato, Muz Zviman, Glenn Meininger, Lars Lickfett, Ron Berger, Hugh Calkins, Henry Halperin.
Cardiology, Johns Hopkins University, Baltimore, MD, USA.
Background: Magnetic resonance imaging (MRI) with gadolinium has been successfully used to evaluate the tissue damage after myocardial infarction (delayed enhancement). In electrophysiology, tissue necrosis is caused by radiofrequency ablation (RFA), which is the standard of care in the treatment of a wide variety of arrhythmias.
Purpose: As MRI has the potential to complement or eventually substitute fluoroscopy in RFA procedures we sought to evaluate the characteristics of gadolinium-enhanced imaging of RFA lesions.
Methods: Using a power-controlled, cooled tip 7-French catheter system RFA lesions (10–40 W for 30 s) were created on the epicardial surface of the right ventricle in 8 mongrel dogs. After bolus injection of 0.225 mmol/kg gadolinium T1-weighted (fast gradient echo, FGRE) images were obtained over a follow-up of 10 h using an intrathoracic high-resolution coil. RFA were analyzed on the MR images and compared to gross anatomy and histopathology.
Results: Four different phases of signal enhancement were observed. After gadolinium injection RF lesions were clearly delineated, contrast-free areas of low signal intensity (Contrast-to-noise ration [CNR]=−25). Signal enhancement in the lesion periphery was observed starting 4±1.8 min after injection and progressively extended towards the lesion center at a rate of about 0.03 mm/min. Full delayed enhancement of an average 6 mm RF lesion was observed after 98±21 min (CNR=+20). During the follow-up period CNR subsequently decreased, but lesion was detectable up to 10 h of follow-up. The area of low signal intensity as well as the area of delayed enhancement accurately described the lesion size and correlated well with the pathological findings.
Conclusion: RFA can be accurately evaluated using gadolinium-enhanced MR imaging. However, the dissimilar wash-in and wash-out kinetics when compared to myocardial infarction suggest a different pathophysiological process with complete cellular destruction and total loss of microvasculature.
396. Investigation of an IVIM Based MRI Sequence to Study the Myocardial Perfusion in Dogs
Virginie Callot, Han Wen.
Laboratory of Cardiac Energetics, NHLBI-NIH, Bethesda, MD, USA.
Introduction: Myocardium perfusion studies are of importance in order to understand the pattern and the quantity of arterial blood (and thus oxygen) delivered to the heart. Two methods, contrast-enhanced MRI and fluorescent microsphere counting have been successfully used for this purpose. Published results have demonstrated certain contradictions between the 2 methods: MRI contrast agent such as Gd-DTPA has led to a homogenous myocardium perfusion pattern whereas the use of fluorescent microspheres has shown perfusion heterogeneity [1].
A method that is independent of any particular exogenous contrast agents behavior may help resolve the contradiction.
Purpose: The purpose of our work is to investigate the use of the intra voxel incoherent motion (IVIM) effect [2] as a way to study the myocardium perfusion and diffusion.To our knowledge, the IVIM method has never been applied in the heart, the feasibility of our method, as well as the accuracy of the results, have then to be studied.
Methods: Non invasive experiments were performed on anesthetized beagles (n=4) whose heart rhythm and respiratory motion were synchronized and maintained constant through atrial pacing. A STEAM (stimulated echo acquisition mode) sequence including 14 velocity encoding gradients (G from 0 to 12.6 pi/mm) and a four-segmented EPI read-out (64×256, FOV 400×400 mm2, slice 8 mm) was developed in order to collect IVIM informations with sufficient SNR. A typical STEAM image is shown on Fig. .
The signal amplitude evolution (S) along the 14 encoding gradients is given by the expression [2]: S/S0={(1−f).exp(−b.D)+f.exp(−b.(D+D*))}, where S0 is the signal amplitude for G=0, b the encoding gradient weight (s/mm2), f the perfusion fraction (%), D the molecular diffusion coefficient of water (mm2/s) and D* a pseudo-diffusion coefficient (mm2/s) or perfusion index [3]. D and f are evaluated from a fit applied on the data acquired with high gradient values whereas D* is obtained from a fit applied on the data obtained with the low gradient values (using the previously determined D and f parameters).The influence of the pacing rate as well as the use of a vasodilatator (adenosine, 140 ug/kg.min) were investigated to test the behavior and accuracy of the IVIM parameters.
Images were acquired on a 1.5 Teslas Magnetom scanner (Siemens, Erlangen) using a volume coil.
Results: Figure illustrates the logarithm of the signal ln(S/S0) evolution as a function of b for a region of interest (ROI) in the septum.
Table summarizes the results obtained with and without the use of a vasodilatator. The values of f, D and D* were evaluated from an average on the 3 velocity encoding directions (x, y and z) and the different pacing rates. 2 regions of interest (ROI) were used for the free wall region, one for the septum.
For different pacing rates, D was found to be stable, whereas f and D* tends to increase with the pacing rate. The same plots were performed post mortem and have led to a value of f∼0 and D=D*∼1.2×10⁻³mm2/s.
The range of the vascular value f well agreed with normal myocardial blood perfusion in dogs and the diffusion parameters D clearly indicates a restricted diffusion behavior when compared with free water at the same temperature. Further careful measurements have to be done to observe any directional preference of diffusion.
What is important to note is that the results clearly demonstrate the ability of the method to differentiate micro-circulation from restricted molecular diffusive motion (D*/D∼9, f>0). This was confirmed by the increasing behavior of f and D* with the pacing rate as well as the post mortem acquisitions for which perfusion is absent (D*∼D, f=0). Moreover and as expected, the vasodilatation experiments have been characterized by an increase of f and a decrease of D* in the free wall (this behavior has not been clearly reproduced in the septum where partial volume effects may have occurred between the muscle and the cavities).
For future experiments, the spatial resolution will need to be improved, this may help decrease the errors and the large standard deviations from the double fit. Other physiological states such as inotropic conditions will have to be investigated to better understand the meaning of the IVIM parameters.
Conclusion: Our preliminary results demonstrate the possibility of using the IVIM effect as an endogenous indicator of micro-flow and perfusion in the myocardium. This may help solve the contradictions observed with different contrast-based methods.
Table 1. Mean average of f, D and D* for different regions of interest and with or without adenosine
References
[1] Deussen, A., et al. Basic Res.Cardiol. 1998, 93:430–438.
[2] Le Bihan, D., et al. JMRI 1991, 1:7–28.
[3] Le Bihan, D., et al. MRM 1992, 27:171–178.
397. Fast Patient Adapted Respiratory Navigators
Eltjo H. Haselhoff, Ph.D.
MRI Marketing, Philips Medical Systems, Best, The Netherlands.
Introduction: Prospective respiratory gating in combination with navigator based motion compensation techniques have proven to be an excellent method to reduce respiratory motion artifacts in high-resolution, free-breathing MRA, within acceptable scan times. In order to monitor the subject's breathing, a respiratory navigator may be placed between the right lung and the liver at the dome of the diaphragm. The relationship between the three dimensional respiratory induced motion of the heart and the feet-head motion of the dome of the diaphragm may be approximated by three vector components. Clinical routine studies have used a fixed respiratory vector of [AP=0, LR=0, FH=0.6]. In order to improve respiratory motion tracking accuracy, various other motion compensation implementations have been researched in the past, ranging from 3D translation of the imaging volume to the use of affine transformations.
Purpose: The purpose of this study was to develop a fast implementation of 3D linear ‘patient adapted’ respiratory motion compensation, optimized for the specific breathing characteristics of each subject.
Methods: In order to quickly determine the subject-dependent respiratory vector, a new real-time, multi-dynamic, dual stack, ECG triggered sequence was developed. Based on this sequence, a dynamic scout scan (DSS) visualizes the effect of breathing on the heart's anatomy. One coronal stack crosses both the dome of the diaphragm and the heart at the region in interest (ROI), whereas the sagittal stack crosses only the heart in the region of interest. Both stacks are acquired in an interleaved fashion with a time delay of 200 ms. An analysis tool was developed, which automatically simulates a time-dependent navigator signal from the lung–liver interface in the coronal half of the DSS. The same tool also allows the identification of ROIs at the position of the heart, in both the coronal and sagittal planes. By means of an adapted 2D cross correlation method, a fast tracking algorithm automatically follows the in-plane translations over time of the ROIs in both orthogonal planes. The algorithm finds the best fit of a feature mask f(x,y) in a search domain g(x,y), where f(x,y) corresponds to a user-defined ROI in any image of the the DSS, and g(x,y) to the surroundings of f(x,y) in the successive image. Bulk motion of the feature mask between these two images is determined by finding the minimum of the local similarity functionwhere the sign Ä stands for the 2D cross correlation, and Hδ(x,y) is a unity mask the size of f(x,y). The expression above is basically a cross correlation expression compensating for fold over related problems in the ROI, as a result of the discrete (pixelized) character of the problem.The resulting three-dimensional motion of the ROI in the heart is confronted with the simulated navigator signal, and by linear regression three vector components are automatically derived, which relate the navigator signal to the 3D heart motion. The total evaluation time of the patient adapted respiratory vector takes seconds only. The resulting extrapolated corrective motion (as may now be obtained from the navigator signal) can be shown and, if necessary, adjusted before the actual MRA scan takes place. Left and right coronary arteries of seven volunteers were scanned with a 1.5 T clinical MRI scanner (Intera CV, Philips Medical Systems). All volunteers were scanned twice with a commercial MRA protocol (3D ECG-triggered, free-breathing balanced TFE, 5 minutes total scan time) once with the traditional fixed correction vector of [0,0,0.6] and once with patient adapted vector terms.
Results: The use of linear regression analysis in order to determine the breathing vectors was remarkable accurate, as small tracking errors (if they occur) tend to cancel one another out. Image quality increased in three cases, which indeed corresponded to respiration vectors significantly different from the standard vector [0,0,0.6]. In five cases, the gating acceptance window was increased from 5 to 8 mm, without visible loss in image quality.
Conclusion: Our study confirmed that determination of a patient adapted breathing vector may improve image quality in some cases, and image quality reproducibility in general. Moreover, patient adapted navigators allow the use of larger gating acceptance windows, which will reduce effective scan times. Implementation was straightforward and simple, while no additional time was required for the examinations. We therefore recommend our approach as a simple and efficient way to increase robustness of navigator gated MRA scans.
Free-breathing 3D balanced TFE MRA.
Left: standard respiratory vector of [0,0,0.6], right: adapted vector of [0.25,0.07,1.00].
398. Free-breathing Ungated Cardiac Mri At 1.6 Mm Resolution And 30 Frames Per Second Using K-t Blast And K-t Sense
Jeffrey Tsao, Ph.D., Klaas P. Pruessmann, Ph.D., Peter Boesiger, Ph.D.
Institute for Biomedical Engineering, Swiss Federal Institute of Technology (ETH), Zurich, Zurich, Switzerland.
Introduction: Conventionally, free-breathing ungated dynamic MRI is restricted by a stringent tradeoff between spatial and temporal resolutions. In this work, we present two methods that significantly relax this restriction, enabling high spatial and temporal resolutions to be achieved simultaneously. The central idea is to acquire low-resolution training images in order to learn the temporal dynamics of the object. Then, high-resolution images are acquired with a large degree of undersampling. This allows for high spatial and temporal resolutions, but results in aliasing. The knowledge gained from the training images is used to fill in the unacquired data of the high-resolution images, thus eliminating the aliasing. The methods are called k-t BLAST (Broad-use Linear Acquisition Speed-up Technique) (1) and k-t SENSE (SENSitivity Encoding) (2), when the data are acquired from a single or multiple receiver coils respectively.
Purpose: Develop new methods for free-breathing ungated cardiac MRI with high spatial and temporal resolutions.
Methods: Free-breathing ungated cardiac imaging was performed on a healthy volunteer in two consecutive stages using echo planar imaging on a Philips Gyroscan 1.5T scanner (Philips Medical Systems, Best, the Netherlands). In the first stage, low-resolution training data were acquired from the central k-space at a high frame rate. In the second stage, data were acquired sparsely in k-space over t such that the sampling pattern conforms to a shear grid in k-t space (3). Applying inverse Fourier transform to the acquired data d in k-space and along time t yields the corresponding data in the conjugate x-f space, where x and f represent spatial dimension and temporal frequency, respectively. d suffers from aliasing due to the undersampling in k-t space. This aliasing is resolved by the following equation:where ρ is the reconstructed (unaliased) image in x-f space. θ is the estimated covariance matrix of the signals in x-f space. In this work, θ was used in its simplest form as a diagonal matrix, with the diagonal elements representing the squared magnitude of the expected intensity in x-f space, which was obtained from the low-resolution training images. E is an encoding matrix, representing the linear mapping between the true unaliased signals and the acquired (aliased) data d. If multiple receiver coils are used, E incorporates the effects of sensitivity encoding as well (2). Ψ is the noise (co)variance for the receiver coil(s). ρbaseline and dbaseline are the baseline estimates of ρ and d, respectively. In this work, they were determined as the time invariant portion of the object signals, so they were obtained simply by temporally averaging the acquired data. By solving the above equation, one obtains the reconstructed image ρ in x-f space. Applying a Fourier transform along f yields a series of images over time t.
Results: Representative images (Voxel size 1.56 mm×1.70 mm, 31.9 frames/sec) are shown, depicting the heart in the short-axis view at selective frames from systole to diastole within a single heart beat. The images were acquired using a 5-element phased-array coil.
Conclusions: k-t BLAST and k-t SENSE significant improve the performance of free-breathing ungated cardiac MRI by providing an integral approach to recover the unacquired k-t space data using all of the available information. Using this approach, it is feasible to achieve high spatial and temporal resolutions simultaneously, exceeding current capabilities (Figure ).
References
(1) Tsao, J., et al. Unifying linear prior-information-driven methods for accelerated image acquisition. Magn. Reson. Med. 2001; 46:652–660.
(2) Pruessmann, K. P., et al. SENSE: sensitivity encoding for fast MRI. Magn. Reson. Med. 1999; 42:952–962.
(3) Tsao, J. On the UNFOLD method. Magn. Reson. Med. 2002; 47:202–207.
399. Clinical Validation Of Single Shot Inversion Recovery Truefisp Gadolinium-dtpa Late Enhancement Infarct Imaging
Thomas N. Martin, BSc, MBChB, MRCP,1 Bjoern A. Groenning, MD, FAHA,1 Yiu-Cho Chung, Ph.D.,2 John E. Foster, Ph.D.,1 Alex T. Elliott, Ph.D.,1 Tracey Steedman, BSc,1 Henry J. Dargie, MD, FRCP, FESC.1
Glasgow Cardiac Magnetic Resonance Unit, Western Infirmary, Glasgow, United Kingdom, Cardiovacular MR Research, Siemens Medical Solutions, Chicago, IL, USA.
Introduction: Gadolinium-DTPA (Gd-DTPA) late enhanced (LE) magnetic resonance (MR) imaging using inversion recovery (IR) segmented turboFlash (IR-TFL) accurately measures the volume of infarcted myocardium. Each short axis slice of the left ventricle (LV) is acquired during breath holding over 8–10 heartbeats and is sensitive to heart rhythm irregularities. These are potential limitations to the use of the technique in daily clinical practice.
Purpose: We aimed to validate the LE single shot IR trueFISP sequence (LE-SS) that acquires images in a single heart beat without need for breath holding or a regular heart rhythm.
Methods: 13 male and 6 female (mean (range) age=60 (37–83)) incident hospital admissions with acute coronary syndromes were consecutively recruited. MR was performed at a median (range) of 69 (16–120) hrs from chest pain onset on a Siemens Sonata 1.5 T system using a phased array chest coil. LV dimensions were evaluated by cinematographic (TrueFISP) breath hold sequence. LE MR was performed 15 mins after injection of 0.2 mmol/kg Gd-DTPA using 1) IR-TFL (ECG triggered, 23 segments, field of view (FoV)=340 mm, slice=8 mm, TE/TR=4.3/11 ms, TI=230–330 ms, flip angle (FA)=30°) and 2) LE-SS (ECG triggered, single shot, FoV=340 mm, slice=8 mm, TE/TR=1.2/2.7 ms, TI=260–360 ms, FA=30°). Sampling for troponin I (TnI), creatine kinase (CK) and CKMB took place 12 hours after chest pain onset. Images were evaluated by 2 independent and blinded observers.
Results: LE volume by LE-SS (mean (SD) 13 (14) ml) and by IR-TFL (13 (15) ml) correlated strongly (r=0.83, p<0.0001). Bland-Altman limits of agreement (±2SD) for the difference between LE volume by LE-SS and IR-TFL were −8.55<−0.02<8.51 ml. LE-SS volumes strongly correlated with TnI (r=0.83, p<0.0001) and CK (r=0.82, p<0.0001) and less so with CKMB (r=0.63, p=0.009). LE-SS volumes correlated with LV ejection fraction (mean (SD) 59 (9.7) %) and LV end-systolic (58 (19) ml) volume: r=− 0.48, p=0.004 and r=0.46, p=0.005, respectively, but was unrelated to LV end-diastolic volume (140 (36) ml) and LV mass (134 (42) g).
Conclusions: The volume of myocardium showing LE measured by LE-SS strongly correlates with volumes measured by segmented IR-TFL and with standard serum markers for myocardial necrosis. Given its speed and ease of handling, LE-SS therefore appears to be a promising alternative to IR-TFL .
400. First Pass Perfusion Imaging Using 3D Variable-Density Spiral Trajectories
Jin Hyung Lee,1 Bob S. Hu, MD,2 Dwight G. Nishimura, Ph.D.1
Electrical Engineering, Stanford University, Stanford, CA, USA, Stanford University, Stanford, CA, USA.
Introduction: Perfusion imaging of the lower extremities is challenging because of the need to cover a large volume at high spatial and temporal resolution. Here we propose the use of a 3D variable-density stack-of-spirals trajectory to achieve such imaging goals.
The variable-density sampling [1] concept enables flexible allocation of the scan time resource by allowing the sampling density to be a variable that depends on the k-space location. Since most of the energy of an image is concentrated near the k-space origin, the variable-density k-space sampling method can be used to reduce the sampling density as we go out further in k-space. This significantly reduces scan time while introducing only minor aliasing artifacts from the low-energy, high-spatial-frequency components.
The stack-of-spirals trajectory [2] allows control over the density variation in both the kx, ky plane and the kz direction while fast k-space coverage is afforded through spiral trajectories in the kx, ky plane. The variable-density stack-of-spirals trajectory consists of variable-density spirals in each kx, ky plane that are located in varying density in the kz direction.
Purpose: The purpose of this work is to study the use of a variable-density stack-of-spirals trajectory to perform first-pass perfusion imaging in the lower extremity.
Methods: The 3D stack-of-spirals sequence was implemented on a 1.5 T GE Signa LX scanner with 40 mT/m, 150 mT/m/s gradients and a linear extremity transmit-receive coil. The spiral trajectory was incorporated into a spoiled gradient (SPGR) sequence with a 21 ms TR and a 130 degree flip angle. The FOV was chosen to be 20×20×28 cm and the resolution was chosen to be 2.5×2.5×7 mm. A spectral-spatial excitation pulse [3] was used for slab selection in z and fat supression.
The stack-of-spirals trajectory was designed so that the sampling density decreased quadratically with radial distance in k-space. The effective FOV, which is defined as the inverse of the sampling interval, was decreased down to 11 cm in the x,y direction and 10 cm in the z direction. The resulting 3D scan time is 2.1 sec.
To see the differential perfusion of the ischemic vs. normal leg, we occluded the left leg. Then, 10 cc of Magnevist was injected over 3 sec. The occluded leg was released after 60 sec. Repeated sets of 3D images were acquired over 90 sec.
Results: Figure shows 4 axial images from one of the 3D image data sets. The muscle signal intensity changes over time are plotted on the right hand side of the images. The solid line shows the muscle signal intensity of the unoccluded leg and the dotted line shows the muscle signal intensity of the occluded leg. The plot on the left side of the top axial image shows the arterial signal intensity change.
The unoccluded leg shows a rise in muscle signal intensity as the contrast arrives. The occluded leg shows a delay in the signal intensity rise and the hyperemic response can also be observed.
Conclusions: Using the variable-density stack-of-spiral trajectories, a large volume can be covered at high spatial and temporal resolution. This provides a way to assess the first pass perfusion in the lower extremities. Our initial experiences agree with the known physiology.
References:
1. TsaiC-M., et al. MRM 43:452–458, 2000.
2. IrarrazabalP., et al. MRM 33:656–662, 1995.
3. MeyerC., et al. MRM 15:287–304, 1990.
401. Block Regional Off-Resonance Correction (BRORC): A Fast and Effective Deblurring Method for Spiral Imaging
Hisamoto Moriguchi, M.D., M.S.E., Brian M. Dale, B.S., Jeffrey L. Duerk, Ph.D.
Radiology, University Hospitals of Cleveland, Cleveland, OH, USA.
Introduction: Spiral acquisition techniques have advantages over other k-space trajectories in cardiac imaging because of their short scan time and insensitivity to flow artifacts. One of the main disadvantages of spiral imaging is blurring artifacts due to off-resonance effects. The frequency segmented off-resonance correction (FSORC) method is commonly used to combat off-resonance effects. However, this algorithm is computational intense due to the number of required Fast Fourier Transforms (FFT). A few off-resonance correction algorithms with improved computational efficiency have been proposed (1,2). However, the multifrequency interpolation method requires significant amounts of memory (1) and the image domain deconvolution method use approximations (2) that may lead to image quality degradation beyond those associated with the more conventional FSORC. In this abstract, a new fast off-resonance correction method (a.k.a., ‘Block regional off-resonance correction (BRORC)’) is presented. In this method, FFT's are performed on matrices that are smaller than the full image matrix. Furthermore, even further reduction of computational costs can be expected if only particular regions of the image need to be deblurred since the algorithm corrects for off-resonance blurring block by block on the reconstructed image.
Purpose: The conventional FSORC and the newly proposed off-resonance correction method ‘BRORC’ are compared in terms of computational efficiency and image quality.
Methods: A block diagram of the BRORC is shown in Figure . Suppose that the original image matrix size is N × N (e.g., 256×256). The first step of the BRORC is to extract a small block region M × M. M is typically chosen to be a number which is power of 2 (e.g., 32). A 2D-FFT is performed on the M × M image matrix. The obtained M×M Fourier data is to be frequency demodulated. The demodulation function matrix for the M × M data matrix is an N/M-fold decimation of the original N × N demodulation function matrix (which is a function of time along the spiral trajectories). The demodulation frequency is indicated in the frequency field map at the position where the center of the M × M matrix is located. After frequency demodulation, the M × M data is 2D-inverse Fourier transformed. Since the outer regions of the obtained M × M image matrix sometimes exhibit artifacts, the central rM × rM pixels (0<r<=1, the typical value of r is 0.5.) of the M×M deblurred image matrix are kept for the final image reconstruction. The above procedures are repeated until the entire scanned object is deblurred. However, as is evident from the BRORC block diagram, it is also possible to deblur only particular regions of the image.
Actual spiral acquisitions were acquired to facilitate comparison of the FSORC and BRORC. An asymptomatic volunteer heart was scanned using spiral trajectories. 1–4–6–4–1 binomial pulses were used for spatial-spectral excitation. The total flip angle for on-resonance spins was 64 degree. ECG gating was used during the scan. Other sequence parameters were: 20 interleaved spirals, TE 6.0 ms, FOV 390×390 mm, slice thickness 8 mm. For image reconstruction, k-space re-gridding was performed. For off-resonance correction, both the FSORC and the BRORC were performed for comparison. In BRORC, M and r were set to 32 and 0.5, respectively. Note that the same data set was processed with the two different off-resonance correction algorithms in this experiment.
Results: Figure shows the image before off-resonance correction (a) and the images reconstructed using the FSORC (b) and BRORC (c). As is evident, the definition of the myocardium is improved in images (b) and (c) when compared to the uncorrected “raw” image of (a). There are no observable differences in image quality when the off-resonance corrected images are compared (images b and c).
(N2)* log N (base2) is the total number of complex multiplications needed for the 2D-FFT of an N×N matrix. Therefore, if there are P demodulation frequencies, the total number of complex multiplications, S, necessary for the FSORC is P*(N2)* log N (base2). For example, if P=20 and N=256, S=10.5×10⁶.
On the other hand, (M2)*logM (base2) is the total number of complex multiplications needed for the 2D-FFT of an M × M matrix. If the entire image region is deblurred using BRORC, the total number of complex multiplications B is (N/rM)2*2*(M2)* log M (base2). For example, if M=32 and r=0.5, B=2.6×10⁶. Therefore, the ratio of computational burden of BRORC to FSORC is B/S=25%.
As mentioned, BRORC can be applied to localized sub-regions of interest within the image. It is expected that the computational burden can be further reduced with the BRORC if only small regions of the image need to be dublurred.
Conclusions: A new off-resonance correction method ‘BRORC’ has been presented as a fast deblurring method for spiral imaging. BRORC is a useful off-resonance correction technique for spiral imaging. It has demonstrated that the quality of the image reconstructed using BRORC is comparable to that using the FSORC. BRORC is usually computationally several times more efficient than the FSORC with no perceptual difference between the images. Moreover, BRORC can be applied to particular regions of interest to further facilitate the computation. Because it provides comparable performance to FSORC at less computational burden and with an option for its use within a sub-region of the image, we believe BRORC should be considered for all future spiral imaging experiments.
References:
1) Man, L. C., et al. MRM 1997; 37:785–792.
2) Ahunbay, E., et al. MRM 2000; 44:491–494.
402. Vascular Plaque Morphological Quantitation
Chao Han, Ph.D.,1 Annette Kampschulte, MD,2 Bao-Cheng Chu, Ph.D.,3 Thomas S. Hatsukami, MD,4 Chun Yuan, Ph.D.2
Department of Radiology, University Of Washington, Seattle, WA, USA, Department of Radiology, University of Washington, Seattle, WA, USA, Department of Radiology, University of Washinton, Seattle, WA, USA, Department of Surgery, University of Washinton, Seattle, WA, USA.
Introduction: Atherosclerosis is a common disease affecting and handicapping many individuals. To evaluate different types of treatment for clinical use, it is important to find quantitative methods with which to assess atherosclerosis. Quantitative morphological descriptors, in conjunction with quantitative measurements of plaque tissue type will provide a reliable and sensitive means of understanding, monitoring and predicting the progression of carotid artery atherosclerosis and its effect on the brain [1–3].
Traditionally, the degree of lumen stenosis is used as a morphological marker for high risk (vulnerable) plaques. The determination of lumen stenosis lacks a unified approach, as evidenced by the two methods of stenosis quantification in the North American Symptomatic Carotid Endarterectomy Trial (NASCET) [4] and the European Carotid Surgery Trial [5]. Regardless of which method is used, two clinical trials (the North American Symptomatic Carotid Endarterectomy Trial and the Asymptomatic Carotid Atherosclerosis Study) demonstrate that lumen narrowing is a poor indicator of vulnerability, predicting only 1 out of 4 strokes in symptomatic patients [6] and 1 out of 10 in asymptomatic patients [7].
Purpose: Morphological description refers to the methods that result in numeric morphological descriptors and is a step subsequent to morphological representation. In this paper, twenty five vascular morphological descriptors are defined based on lumen boundary, wall boundary, and wall thickness. The morphological description includes area descriptors, lumen boundary descriptors, wall boundary descriptors, and wall thickness descriptors.
Morphological Descriptors: Area descriptors include lumen area (LumenArea), outer-wall boundary area (OuterArea), wall area (WallArea), and ratio of lumen area to outer-wall boundary area (LORatio). The lumen boundary descriptors, wall boundary descriptors, and wall thickness descriptors respectively includes mean, minimum, maximum, ratio of minimum to maximum, ratio of minimum to mean, ratio of mean to maximum, and ratio of standard deviation to mean of a feature parameter. The mean descriptor, minimum descriptor, and maximum descriptor demonstrate the physical radii size or thickness size, and the ratio descriptors show the level of relative variances among the mean descriptor, minimum descriptor, and maximum descriptor.
For example, the mean of lumen boundary radii (MeanLRadii), minimum lumen boundary radii (MinLRadii), maximum lumen boundary radii (MaxLRadii), the ratio of minimum lumen boundary radii to maximum lumen boundary radii (LMMDev), the ratio of minimum lumen boundary radii to mean of lumen boundary radii (LMinDev), the ratio of mean of lumen boundary radii to maximum lumen boundary radii (LMaxDev), and the ratio of standard deviation of lumen boundary radii to mean of lumen boundary radii (LMeanDev).
Experimental Results: To validate reproducibility of the morphological descriptors, one experiment was designed using the carotid arteries of fifteen patients with two independent MR scans within two weeks at the same site (image size/pixel size/slice thickness/number of slices=512×512/0.25 mm/2.0 mm/10). Fifteen patients, ranging in age from 42 to 69 years old, were recruited from the University of Washington Medical center and the Veteran's Affairs Puget Sound Health Care System. All protocols and consent forms were approved by each hospital institution review boards. At least one side of the carotid stenosis was over 50% and less than 80%, as determined by duplex ultrasound examination. Ideally, thirty carotid arteries should be available. Due to location mismatching and bad image quality caused by patient movement during scanning, twenty-one carotid arteries were available for reproducibility testing. Two radiologists independently traced the patient's lumen and outer-wall boundaries using the semi-automatic Snake algorithm [7], the program then automatically calculated the value of the morphological descriptors based on the contours of lumen and outer-wall. The bifurcation was used as a reference to match the carotid physical location for testing the reproducibility.
The maximum pooled absolute percentage difference (PAPD) among the descriptors was less than 14%. The results suggest that the morphological descriptors can be used to monitor the vascular plaque morphology progression and regression based on patient's MR images.
Conclusion: In this paper, a set of vascular morphological descriptors is presented to analyze vascular morphology. The descriptors are defined based on lumen boundary, outer-wall boundary, and wall thickness. After the lumen boundary and outer-wall boundary are available, the program automatically calculates the value of the descriptors. The descriptors quantify morphological size of the lumen, outer-wall, and wall thickness as well as their relative variant relationship. The reproducibility of the descriptors was tested on human carotid arteries. Almost all descriptors showed high reproducibility testing on patients. Their PAPD was less than 10%, and the maximum PAPD among the descriptors was less than 14%. These results suggest that the proposed descriptors can be used to design an intelligent system for clinical plaque analysis.
References
1. T. Blaser, K. Hofmann, T. Buerger, O. Effenberger, C.W. Wallesch, M. Goertler, “Risk of stroke, transient ischemic attack, and vessel occlusion before endarterectomy in patients with symptomatic severe carotid stenosis,” Stroke 33(4), pp. 1057–1062, 2002.
2. A. F. Frangi, W.J. Niessen, P.J. Nederkoorn, J. Bakker, W.P. Mali, M.A. Viergever. “Quantitative analysis of vascular morphology from 3D MR angiograms: in vitro and in vivo results,” Magnetic Resonance Med., vol. 45:, pp. 311–322 2001.
3. C. Yuan, L.M. Mitsumori, K.W. Beach, K.M. Maravilla. “Carotid atherosclerotic plaque: noninvasive MR characterization and identification of vulnerable lesions,” Radiology, vol. 221, No. 2, pp. 285–300, 2001.
4. North American Symptomatic Carotid Endarterectomy (NASCET). “Beneficial effect of carotid endarterectomy in symptomatic patients with high-grade stenosis,” North American Symptomatic Carotid Endarterectomy Trial Collaborators. N Engl J Med, vol. 325, pp 445–453, 1991.
5. European Carotid Surgery (ECST). Endarterectomy for Moderate Symptomatic Carotid Stenosis: Interim Results from the MRC European Carotid Surgery Trial. Lancet vol. 347, pp. 1591–1593, 1996.
6. Asymptomatic Carotid Atherosclerosis Study (ACAS). “Endarterectomy for Asymptomatic Carotid Artery Stenosis,” JAMA, vol. 273, pp. 1421–1428, 1995
7. C. Han, J.N. Hwang, T.S., Hatsukami, C. Yuan. “A fast minimal path active contour model,” IEEE Transactions Image Processing, vol. 10(6), pp. 865–873, 2001
403. Realtime Quantitative Flow Using EPI and SENSE for Stroke Volume and Shunt Quantification in Congenital Heart Disease
Philipp B. J. Beerbaum, MD,1 Hermann Körperich, Ph.D.,2 Romhild M. Hoogeveen, Ph.D.,3 Jürgen Gieseke, MSc,3 Peter Barth, MSc,2 Hermann Esdorn, MD,2 Hans Meyer, MD.1
Clinic for Congenital Heart Disease, Heartcenter NRW, Bad Oeynhausen, Germany, Dept. of Magnetic Resonance Imaging, Heartcenter NRW, Bad Oeynhausen, Germany, Philips Medical Systems, Best, Netherlands.
Introduction: Noninvasive shunt quantification by conventional velocity-encoded cine magnetic resonance imaging (VEC-MRI) is accurate in children but time-consuming and ECG-dependent.
Purpose: To develop and evaluate the feasibility of a realtime velocity-mapping MRI technique without ECG-triggering in children with left-to-right shunt.
Methods: In 10 children (mean age 5.8 years) with cardiac left-to-right shunt, blood flow rate in the pulmonary artery and aorta and the ratio of pulmonary to aortic flow (Qp/Qs) was determined by realtime VEC-MRI using single-shot echo-planar imaging (SS-EPI) and SENSE, and compared with measurements by a standard cine VEC-MRI pulse sequence that was recently validated in children. The realtime VEC-MRI sequence was designed to yield an in-plane resolution of 2.7*2.7 mm (slice thickness 8 mm) and a temporal resolution of 40 msec. In addition, in-vitro studies on accuracy and precision were conducted.
Results: The mean difference was 2–3% with upper and lower limits of agreement (=mean difference±2 SD) between +15 to +17% and −18 to −19%, respectively, demonstrating good agreement between realtime and standard VEC-MRI. The interobserver variability was low. In-vitro precision was confirmed for both standard and realtime VEC-MRI using a pulsatile flow phantom. Standard VEC was highly accurate in-vitro, whereas realtime VEC-MRI showed flow overestimation of ∼20%, probably due to partial volume artifacts related to tube thickness, present in-vitro but not in-vivo.
Conclusions: Within a few heart-beats, reliable and accurate determination of pulmonary and aortic stroke volumes including shunt estimation (Qp/Qs) can be achieved by realtime VEC-MRI using EPI and SENSE in children with left-to-right shunt.
404. Combining First-Pass and Late-Enhancement Myocardial Perfusion Analysis
Marcel Breeuwer, Ph.D.,1 Raja Muthupillai, Ph.D.,2 Scott D. Flamm, Ph.D.,3 Eike Nagel, Ph.D.,4 Ingo Paetsch, Ph.D.,4 John Ridgway, Ph.D.,5 Sven Plein, Ph.D.5
MIMIT Advanced Development, Philips Medical Systems, Best, The Netherlands, Philips Medical Systems & Texas Heart Institute, Houston, TX, USA, Texas Heart Institute, Houston, TX, USA, Department of Cardiology, German Heart Institute, Berlin, Germany, Cardiac MR Unit, Leeds General Infirmary, Leeds, United Kingdom.
Introduction: First-pass myocardial perfusion imaging is used to identify regions within the myocardium that are insufficiently supplied by blood. A contrast agent is injected and with ECG-triggered MRI the passage of this agent through the myocardium is dynamically monitored. The image intensity in the myocardium as a function of time (the time-intensity profile) is a measure of how well blood flows from the coronary arteries into the myocardium. Various parameters have been proposed to quantify the degree of perfusion based on these time-intensity profiles, such as the maximum upslope and the time-to-peak. First-pass perfusion imaging is often performed both when the heart is at rest and when it is stressed. The myocardial perfusion reserve index, i.e. the ratio of the maximum upslope at stress and at rest, is considered to be a good indicator of the degree of perfusion [1].
First-pass perfusion analysis does not supply information about the viability of myocardial tissue that is insufficiently perfused. To discriminate between viable and non-viable tissue, late-enhancement (also denoted as delayed-enhancement) perfusion imaging is used. Similar to first-pass perfusion imaging, late-enhancement imaging is based on the injection of a contrast agent. MR images are however acquired after a delay of 15–25 minutes. The assumption is that the contrast agent accumulates in the non-viable tissue, which will therefore have an enhanced intensity in the MR images. The ratio of non-viable and viable tissue (the scar burden) can then be quantified from these images.
Purpose: The purpose of the study reported in this paper is to investigate whether the information derived from first-pass and late-enhancement perfusion analysis can be combined in a clinically relevant way. This is especially of interest for myocardial regions containing non-viable tissue. These areas will not show a well-defined time-intensity profile in the first-pass perfusion images and, as a result, the perfusion reserve index will not be a usable indicator. These areas can however be identified from the late-enhancement images and can be mapped onto the first-pass perfusion analysis results. The following section explains how this is performed.
Methods: The method used to analyze first-pass perfusion image series is based on the method of maximum upslope estimation and calculation of the perfusion reserve index as proposed in [1]. It consists of a number of steps. Automatic rigid registration is performed to compensate for myocardial motion due to breathing or movement of the patient. The user can manually specify the myocardial contours on any of the registered images and these contours are automatically propagated to all other images. The time interval during which the contrast agent passes through the myocardium for the first time is automatically detected and the maximum upslope (and other parameters) are derived from the time-intensity profiles in the interval. The user can flexibly divide the myocardium into smaller segments. Finally, the registered rest and stress image series and associated quantitative analysis results are non-rigidly registered to each other and the perfusion reserve index is calculated [2].
Our late-enhancement analysis method consists of the following steps. The myocardial contours have to be manually drawn on each of the slices that have to be analyzed. Then, based on the histogram of pixel values inside the myocardium a threshold is proposed to discriminate between viable and non-viable tissue. If necessary, the user can manually refine this threshold. Similar to the first-pass perfusion analysis, the myocardium can be flexibly divided into smaller segments.
Finally, for slices acquired at corresponding positions through the myocardium and for equal divisions of the myocardium into segments, all segments that are above the threshold in the late-enhancement image, i.e that are classified as containing mainly non-viable tissue, are indicated in the visualization of the results of the first-pass perfusion analysis (for an example, see the section on results).
Results: Figures illustrate the results of our method. Figure shows an example of the myocardial perfusion reserve index (MPRI) after thresholding at a value of 1.2. In this figure, red indicates well-perfused tissue and blue indicates tissue that has a reduced perfusion. Figure shows the corresponding late-enhancement slice after automatic thresholding, where red now indicates non-viable tissue. Figure is similar to Figure , except that segments with non-viable tissue are now represent without color.
Conclusions: We have introduced a method for the combination of first-pass and late-enhancement perfusion analysis results. The method will contribute to a better discrimination between well-perfused, insufficiently-perfused but still viable, and non-viable myocardial tissue.
References
1. Al-Saadi, N., et al. “Non-invasive detection of myocardial ischemia from perfusion reserve based on cardiovascular magnetic resonance”. Circulation 101, 2000, pages 1379–1383.
2. Breeuwer, M., et al. Towards automatic quantitative analysis of cardiac MR perfusion images'. Proc. CARS, 2001, pages 922–927.
405. Feasibility of Myocardial Tagging with AIR-SPAMM in Humans
Anthony H. Aletras, Ph.D., Andrew E. Arai, MD.
National Heart, Lung and Blood Institute, National Institutes of Health, Bethesda, MD, USA.
Introduction: AIR-SPAMM (Alternate Inversion Recovery Spatial Modulation of Magnetization) is a new method for improving tagging contrast. Alternatively, AIR-SPAMM can be used for doubling the number of tags without increasing the tagging position-encoding gradient strength. Both are accomplished by “locking” the T1-recovering signal close to its initial value, thus preventing the non-tagged portion of the image signal to recover. This is done by means of alternate inversion recovery RF pulses (AIR pulses). Preliminary phantom images have been presented to demonstrate the theoretical aspects of this technique.
Purpose: The purpose of this study was to demonstrate the feasibility of applying AIR-SPAMM to humans during systole.
Methods: AIR-SPAMM resembles a typical 1-1 SPAMM imaging multi-phase cardiac acquisition except for the interjection of RF inversion pulses at regular intervals between readout TRs. In practice, one inversion pulse is interjected every 8–12 TRs, coinciding with the temporal resolution of the acquisition. Each tagged image can be considered to be the sum of a sinusoidally modulated (tagged) image and an untagged image, which corresponds to signal that was either not tagged originally or to signal that recovers due to spin-lattice relaxation. It can be shown that during two intervals that are bracketed by AIR inversion pulses (interval duration=τ) the tagged component of the image recovers according to MTAGGED=−MTAGGED(0) e−2τ/T1 Also, it can be shown that the non-tagged component can be approximated via Taylor series expansion to MUNTAGGED=− MUNTAGGED(0) e−2τ/T1 These equations show that, in the presence of AIR pulses, the tagged and the untagged components of the image track each other over time following the same relaxation constant. As such, their relative signal contributions to the observed image do not change over time.
Artifacts observed with the original AIR-SPAMM method were associated to the k-space trajectory, which allowed for non-smooth transitions. With conventional SPAMM imaging the untagged magnetization smoothly recovers due to T1 whereas with AIR-SPAMM this is no longer true. For acquiring human images, an interleaved k-space sampling scheme was applied to smooth transitions caused by the AIR pulses. Therefore, grouping of k-space lines was done according to their acquisition order.
In order to distribute the available tagged magnetization among the acquired systolic cardiac phases, progressively higher flip angle was utilized during the readouts as previously described by Fischer et al.
Other imaging parameters were: Bo 1.5T, prescribed tag wavelength 7 pixels, 90–90 tagging prep, FOV 36×28, slice thickness 8 mm, bandwidth ±62.5 kHz, TE 2 ms, matrix 256×120, views per segment 8, acquisition time 12 heartbeats.
Results: Six consecutive images from a normal volunteer were acquired with AIR-SPAMM as described previously to cover systole (Figure ). Note that the signal to noise ratio appears qualitatively to be similar over all cardiac phases as a result of the progressively increasing flip angle. Also, since the tagging preparation consisted of two 90-degree RF pulse, note that the tag spacing is half (3.5 pixels) of the prescribed value (7 pixels) as a result of the rectification of the tagged pattern by the magnitude reconstruction. This spacing is preserved throughout all cardiac phases as seen in motionless tissue (e.g., liver). Finally, note the absence of artifacts related to abrupt changes in k-space.
Conclusions: Acquiring AIR-SPAMM images from the human heart within a breath-hold of 12 heartbeats is feasible. The tagged images are artifact free and cover the entire systolic interval. This methodology should also allow for cine phase-based motion mapping (DENSE) with high spatial resolution.
406. T2 Weighted BOLD Contrast in Myocardium as a Function of Echo-Space Time
Jinghua Wang, Ph.D., Faith Powold, Mark Nolte, Pamela K. Woodard, MD, Robert J. Gropler, MD, Jie Zheng, Ph.D.
Cardiovascular Imaging Laboratory, Mallinckrodt Institute of Radiology, Washington University, Saint Louis, MO, USA.
Introduction: Spin-echo sequence is most sensitive to the change in deoxyhemoglobin content and blood volume in capillary-sized vessels. Thus T2 weighted BOLD contrast leads to the new interest in human brain, particularly at high fields.[1,2] In myocardium, the BOLD effect on T2 may be more apparent, even at a low field because of the high volume of capillaries.[3] It was reported that T2 is insensitive to the change in echo spacing time (τ) when using a turbo or fast spin echo sequence (TSE or FSE) because lower fields yields smaller T2 changes.[4]
Purpose: The aim of this project is to evaluate T2 sensitivity in myocardial BOLD contrast as a function of τ, both in normal human subjects and in a stenostic dog at 1.5 T.
Methods: All experiments were performed by a segmented multi-contrast TSE on a 1.5 T Siemens Sonata scanner. In order to study the effect of echo spacing time on T2, a free diffusion time was added between the refocusing pulses and read-out gradients. A pair of crusher gradient were applied before/after echo refocusing pulse in order to reduce large flow artifacts. Echo spacing time was changed from 6 to 13 ms. Three contrasts (three different effective TEs) was collected in the same cardiac cycle to measure myocardial T2. Acquisition of data occurred during the middle of diastole. The signal intensity for different echo time was fitted by using a nonlinear regression to determine T2.
A teflon ring with a stnosis of approximately 70% was inserted to the left circumflex coronary artery (LCx) of a closed-chest dog. All MR imaging were performed at rest condition. A first-pass perfusion study was conducted after a bolus injection of Gd-DTPA agent for comparing with T2 BOLD contrast image. Global and regional ROI measurements were performed in the myocardium of human and the dog, respectively.
Results: Figure indicates that T2 of healthy volunteers decreases with the increase of τ. It can be explained by the diffusion of proton spins through microscopic gradient caused by the tissue susceptibility difference secondary to the paramagnetic effect of deoxyhemoglobin. The larger τ causes the lower myocardial T2. The perfusion image of the dog shows existence of LCX stenosis (the arrow in Figure ). Significantly reduced T2 in that area is observed in the image with τ of 13 ms (arrow in Figure ), whereas the image with τ of 7.6 ms shows a much more uniform myocardial T2. Furthermore, it was found that T2 reduction was more significant in the ischemic area than in normal tissue region with the increase in τ from 7.6 to 13 ms.
Conclusions: Paramagnetic susceptibility of deoxyhemoglobin in capillaries produces the microscopic gradient field perturbation between intra- and extra capillary space, thus causing the reduction of myocardial T2 due to the diffusion effect. When using TSE type of sequence to measure tissue T2, the increase in τ will increase the diffusion time and thereby the dephasing effect, leading to a reduction in T2 value. However, such effect from τ is limited by the data acquisition window and the free diffusion distance. With a restricted flow in the myocardium as in our dog with stenosis, the incrase in τ seems to amplify regional T2 difference due to the BOLD effects. Such findings may provide a valuable method on the myocardial BOLD imaging for diagnosing ischemic myocardium.
Figure 2. Perfusion image (a), myocardial T2 images of τ=7.6 ms (b) and τ=13 ms (c), and the T2 as a function of τ (d) for a dog with a 70% LCX stenosis in the ischemic and remote normal tissue regions.
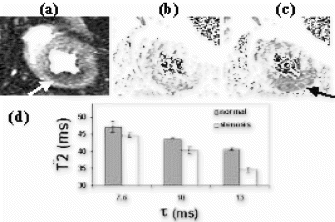
References:
1. Reeder, SB et al. Radiology 1999 Sep; 212(3):739–747.
2. Poncelet, BP et al. Proceedings of Seventh Annual Meeting of the ISMRM p.861.
3. Kaul S et al. Circulation 1997; 96(3):719–724.
4. P. Boxerman, J L et al. Magn. Reson. Med. 1995; 34:555–566.
407. Retrospective Image Correction Combined with Slice Tracking for Respiratory Motion Compensation
David Atkinson, Ph.D., Sebastian Kozerke, Ph.D., Reza Razavi, MD.
Radiological Sciences, Kings College London, London, United Kingdom.
Introduction: Respiration causes significant motion of the heart and this can degrade the quality of MR images acquired during free breathing. For high resolution scans, such as coronary imaging, the scan length precludes breath-holding. To reduce artifacts, the diaphragm position may be monitored using a navigator and the acquisition both gated and the image volume shifted or ‘tracked’. A slice tracking factor of 0.6 of the diaphragm displacement is commonly used to move the image volume, at the level of the coronary arteries, in the foot–head direction [1].
It is known that this tracking factor is patient specific [2], and there are also left–right and anterior–posterior components. Furthermore, the tracking factors may vary during a scan. Autofocus [3] or autocorrection [4,5] techniques apply trial corrections for a range of possible (unknown) motion components and accept the motion that provides the image with the best quality measure.
This work uses autofocus to determine the correct diaphragm–heart tracking factor for a subject. The use of an incorrect tracking factor may not cause a serious problem if the gating window is small, however, if scan times are to be reduced, the gating window must be increased and the use of the correct tracking factor becomes important.
Purpose: To use autofocus techniques to compensate for respiratory motion that is not corrected by slice tracking.
Methods: Cardiac gated scans with imaging during diastole were acquired on a Philips Medical Systems Intera 1.5T. A standard 3D coronary sequence [6] was used with transverse slices centered on the root of the left coronary artery. At each heart beat, a pencil-beam navigator placed through the right hemi-diaphragm was acquired, the diaphragm position was calculated from this navigator and the imaging volume shifted by a tracking-factor in the head–foot direction. The computed diaphragm positions were saved to a file in addition to the complex imaging data.
We applied retrospective corrections to the acquired data for trial tracking factors ranging from 0.2 to 1.0 in steps of 0.1. The tracking factor that gave the best image quality measure (entropy of the gradient image) within a user-defined region of interest was accepted as the optimum. The post processing motion correction was achieved by applying phase corrections to the k-space. The region of interest was chosen to exclude tissue outside the heart from the quality measure.
Results: A healthy male volunteer was asked to breath normally throughout three scans. The slice tracking factors, gating windows and resulting scan efficiencies were; scan 1, (0.6 5 mm 50%); scan 2, (0.6 50 mm 100%); scan 3, (1.0 50 mm 100%). The narrow gating window provided good image quality but the scan time was doubled. The algorithm was used to process data from scans 2 and 3. In each case, the optimum tracking factor for this subject was determined to be 0.4.
Figure shows coronary arteries projected onto a curved surface from, (left) data set 1, (middle) scan 3 before processing and (right) scan 3 after processing. The image quality can be seen to be improved following the algorithm and the clarity of the coronaries is almost as good as the narrow gating window sequence that took twice as long to acquire. Small improvements were also observed after processing scan 2 (not shown). We have also observed small improvements in image quality when the algorithm is asked to search for a tracking factor for anterior–posterior motion in a region of interest close to the chest wall. The algorithm was written in non-optimised MATLAB [The MathWorks] code and takes approximately 30 minutes on a 300MHz Sun Sparc Ultra.
Conclusions: This preliminary study indicates that by using autofocus techniques, it is possible to retrospectively compensate for components of respiratory motion that are not corrected by simple slice tracking. The technique is applicable to any navigated 3D sequence and may permit the use of wider gating windows, thus improving scan efficiencies and reducing acquisition times. Future work may include compensation for changes in breathing pattern during a scan or correction for motion more complex than 3D translations (e.g. rotations and scale changes). Alternatively, instead of reducing acquisition times, a higher resolution image might be obtained.
References
[1] Wang, Y., et al. Magn. Reson. Med. 1995: 33:713–719.
[2] Taylor, AM., et al. J. Cardiovasc. Magn. Reson. 1999:1:131–138.
[3] Atkinson, D., et al. IEEE Trans. Med. Imag. 1997:16:903–910.
[4] Manduca, A,. et al., Radiology 2000:215: 904–909.
[5] Manduca, A., et al. Radiology 1998:209(P):1511.
[6] Botnar, R. M., et al. Circulation 1999:99: 3139–3148.
408. A New Approach to Cardiac Output Measurement: Ungated Spiral Phase-Contrast
Jong B. Park,1 Krishna S. Nayak, Ph.D.,1 Bob S. Hu, MD,2 Dwight G. Nishimura, Ph.D.1
Electrical Engineering, Stanford University, Stanford, CA, USA, Palo Alto Medical Foundation, Palo Alto, CA, USA.
Introduction: Cardiac output (CO) measurement is clincally important in the assessment of patients. However, noninvasive in-vivo cardiac output measurements have proved elusive with any technique. We propose a new fast method for measuring total CO using ungated spiral phase-contrast (USPC) MR. Initial phantom and in-vivo results suggest that this technique quickly measures accurate volume flow rates without requiring gating (and potentially without breath-holding). Previously, this techique has been successfully applied to volume flow measurement in the renal artery and peripheral vessels.
Purpose: To verify the clinical potential of USPC in measuring CO.
Methods: The USPC pulse sequence is a basic spiral readout sequence with flow-encoding in the through-plane direction. 40-interleave spiral readouts with a imaging TR of 15 ms were used to achieve 1.0×1.0 mm resolution over a 30 cm FOV. To further minimze swirling artifacts from pulsatile flow, we used pseudo-randomized interleaf ordering and a minimum-first-moment flow-encoding scheme.
Initial results were acquired on a GE Signa 1.5T CV/i scanner. Phantom studies were performed using pulsatile flow pump. Volunteers were first scanned using a real-time interactive MR system to quickly localize scan planes perpendicular to the ascending aorta. The USPC sequence was then used (ungated to the cardiac cycle) to measure volume flow at the prescribed slices. Acquisitions were repeated with and without (a brief six second) breath-holding. For comparison, multislice real-time data was also acquired in order to estimate stroke volume (SV) and provide a volume reference (CO=SV*heartrate).
Results: Phantom studies, which involved pulsatile flow on the order of 3–15 ml/sec, yielded USPC accuracy within 9% error, and the measurement was repeatable within ±2% error.
Two in-vivo studies were performed, in which cardiac output was measured using the reference method, SV calculation with a real-time volumetric LV sequence, and the USPC method. The results were as follows:
volunteer #1 - SVmethod: 4.30±0.31 L/min, USPC: 4.03±0.42 L/min, andvolunteer #2 - SVmethod: 4.7±0.34 L/min, USPC: 5.93±0.35 L/min.
The two techniques were within 20%, and USPC was repeatable within ±10%.
Conclusions: We have demonstrated a new approach to in-vivo cardiac output measurement based on ungated spiral phase-contrast. Initial studies indicate that this technique has the potential to quickly and robustly measure cardiac output without gating and possibly without breath-holding. This, in combination with stroke volume measurement, may also be used to quantify regurgitant volume. Further validation in patients is currently underway.
409. Observed Flow Suppression in Missing Pulse Steady State Free Precession (MP-SSFP)
Ken-Pin Hwang,1 ShaoXiong Zhang, M.D., Ph.D.,2 Claudia Hillenbrand, Ph.D.,2 Jonathan S. Lewin, M.D.,3 Jeffrey L. Duerk, Ph.D.1
Biomedical Engineering and Radiology, Case Western Reserve University/University Hospitals of Cleveland, Cleveland, OH, USA, Radiology, University Hospitals of Cleveland, Cleveland, OH, USA, Radiology and Oncology, University Hospitals of Cleveland, Cleveland, OH, USA.
Introduction: MPSSFP [1] distinguishes itself from conventional steady state sequences by dropping every third RF pulse and acquiring when the missing pulse would have occurred. Because its echo is primarily formed through a spin echo pathway, intervolume and chemical shift selective techniques that have been applied to conventional spin echo sequences can be applied to this steady state sequence as well [2,3]. Even though chemical shift selective excitation was not slice selective, only spins within the slice selected by the other RF pulse refocused at the echo time to contribute signal in the resulting image. Comparable flow suppression abilities are necessary to avoid flow-related artifacts (e.g., time of flight enhancement, turbulent flow artifacts, ghost artifacts) and improve vessel wall contrast in high resolution vessel wall imaging.
Purpose: The purpose of this study is to evaluate the flow suppression capability of MPSSFP for use in rapid vessel wall imaging in the near future.
Methods: An MPSSFP sequence was modified by replacing the first slice selective excitation with a hard, nonselective excitation. No gradients were applied during this 400 μsec RF pulse. The second RF pulse was a conventional slice selective Hanning windowed sinc pulse. The sequence was applied to acquire transverse slices through the abdomen of a rabbit and asymptomatic human volunteers. Sequence parameters were: TE/TR/α1/α2=8 ms/32 ms/158°/164°, FOV=160×160 (rabbit) or 256×256 (human volunteer), matrix=256×256, slice thickness=5 mm, BW=345 Hz/pixel, NEX=2–4, total acquisition time=17–33 sec. Images were evaluated for signal in through-plane vessels and contrast. Tip angles used for the nonselective and slice selective pulses were determined by simulation of the Bloch equations for stationary spins and spins moving through the imaging plane.
Results: No signal was observed in vessels running through the imaging plane. Artifacts associated with temporal variations in blood amplitude due to time of flight enhancement or variable signal amplitudes with phase encoding (e.g., ghosts) were not observed. Lipid-rich tissues provided the greatest signal, while other tissues exhibited very little signal. Greater vessels such as the aorta, inferior vena cava, renal artery, and renal vein were clearly visible.
Discussion: Steady state flow suppression was successfully achieved with MPSSFP. The lack of signal from through-plane flowing spins is common property of spin echo and MPSSFP sequences. Since only spins that experience both excitations refocus at the echo time, spins excited solely by the nonselective pulse will be dephased during the acquisition window. In addition, these spins form their own steady state condition that also contribute very little signal when refocused by the slice selective pulse. Signal from through-plane flowing spins are therefore suppressed. Conventional MPSSFP, with two slice selective pulses, demonstrates some time-of-flight inflow enhancement of slower moving spins, and has been utilized in the study of renal microcirculation [4].
MPSSFP contrast is heavily T1/T2 weighted. Hence, fluid and lipid produce the highest signal in MPSSFP sequences. While this provides excellent contrast with the vessel lumen in abdominal images, greater signal and contrast may be required to image the vessel wall. Future analysis of SSFP multi-echo readout techniques will provide the contrast necessary to achieve both fluid flow suppression and delineation of vessel wall structures.
Conclusion: MPSSFP is a rapid imaging technique that demonstrates excellent flow suppression when one of the slice selective pulses is replaced with a nonselective excitation. When combined with the multiple contrast mechanisms available (e.g., T1, T2, T1/T2) as a function of TE, TR, α1, and α2, these sequences offer tremendous opportunity in development of rapid, near real time vessel wall imaging sequences with no sensitivity to inflowing blood. This work represents one of the necessary first steps toward near-real-time in-vivo vessel wall imaging.
Figure 1. Flow suppressed MPSSFP applied to a 5 mm slice through the abdomen of a healthy volunteer (a) and a rabbit (b). Arrows point to the aorta in both images and the renal vessels the volunteer image.
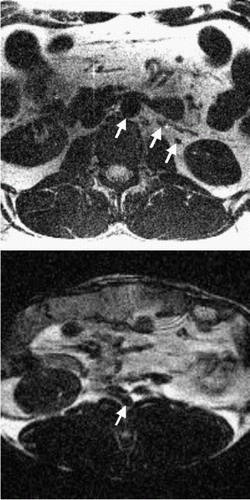
References
[1] Patz, S, et al. Magn. Reson. Med. 10(2):194–209.
[2] Hwang, K. P, et al. ISMRM 2002:2352.
[3] Hwang, K. P., et al. ISMRM 2002:476.
[4] Patz, S, et al. Magn. Reson. Med. 20(1):66–77.
410. TrueFISP CMR of Endothelium Dependent Arterial Reactivity in Men with Coronary Artery Disease
Morten B. Sorensen, MB, BS, Ph.D., Lindsey Crowe, Ph.D., David Firmin, Ph.D., Dudley J. Pennell, MD, FRCP.
CMR Unit, Royal Brompton Hospital, London, United Kingdom.
Introduction: We have recently published validation of endothelium-dependent brachial artery reactivity by cardiovascular magnetic resonance (CMR) using FLASH imaging (Circulation 2002; 106: 1646-51). Compared to FLASH imaging and when applying TrueFISP sequences, it is possible to improve spatial resolution while maintaining short imaging time due to the inherently higher S/N ratio of TrueFISP sequences.
Purpose: To evaluate TrueFISP imaging of the brachial artery cross-section for assessment of endothelium dependent arterial reactivity in subjects with atheroma-induced endothelial dysfunction.
Methods: High resolution imaging of the brachial artery cross-section was performed for measurement of flow mediated (FMD) area changes using a 5 minute forearm occlusion with a blood pressure cuff and a 2 cm surface coil. Imaging was performed by FLASH and TrueFISP imaging in 13 men shortly after positive diagnostic coronary angiography.
Results: Reduced signal flow dependence and higher contrast between the blood and vessel wall enabled a more precise measure of the artery area using TrueFISP (Figure —FLASH, TrueFISP). Spatial resolution was improved by TrueFisp compared to FLASH (pixel size 0.07 mm2 and 0.27 mm,2 respectively). FMD responses were similar by the two imaging techniques but the SD of the mean FMD was lower by TrueFISP than by FLASH (−1.1±2.2% and −3.4±3.3 respectively).
Conclusion: Spatial resolution and tissue differentiation is improved with TrueFISP and this is linked to less variation in FMD responses between subjects. The measurement of FMD by CMR using FISP is fast, accurate and highly reproducible suggesting its superiority over ultrasound for this application for clinical and research applications.
411. High-Resolution Myocardial Tissue Tracking with Breathhold Cine DENSE
Daniel Kim, Wesley D. Gilson, Christopher M. Kramer, Frederick H. Epstein.
Department of Radiology, University of Virginia, Charlottesville, VA, USA.
Introduction: Displacement-encoding with stimulated echoes (DENSE) is a promising new technique for imaging myocardial motion [1]. DENSE compares favorably to conventional myocardial tagging in terms of spatial resolution and ease of strain analysis [2]. However, a limitation of current DENSE techniques is that data are acquired at only a single cardiac phase.
Purpose: The purpose of this study was to develop a high-resolution breath-hold cine DENSE sequence based on complementary spatial modulation of magnetization (CSPAMM) for time-independent artifact suppression [3] and fast gradient echo/echo-planar imaging (FGRE-EPI) for rapid data acquisition.
Methods: Time Indepenent Artifact Suppression. Inspection of DENSE raw data (Figure ) reveals that both the displacement-encoded signal and an artifact-generating signal due to T1-relaxation are sampled during high-resolution imaging. In current DENSE sequences, the “T1-relaxation” signal is suppressed using inversion recovery (IR) [4]. While IR is effective over a small range of times, it is not effective for multi-phase imaging. We developed a cine DENSE sequence that (a) uses CSPAMM for time-independent artifact suppression, and (b) uses a multi-phase FGRE-EPI sequence with DENSE unencoding to rapidly sample the displacement-encoded signal.
Pulse Sequence. The ECG-gated cine DENSE sequence was implemented on a 1.5T whole-body scanner (MAGNETOM Sonata, Siemens Medical Systems, Erlangen, Germany). For displacement-encoding in each of 2 orthogonal in-plane directions, 2 complementary (CSPAMM) cine data sets and a third phase reference cine data set were acquired, for a total of six separate cine data sets. By acquiring each individual cine data set in 3 heart beats, the data for all 6 cine data sets were acquired in 18 heart beats. 1-1 SPAMM pulses encoded the magnetization immediately following ECG triggers, and multi-phase FGRE-EPI with DENSE unencoding sampled the displacement-encoded magnetization through the cardiac cycle. A displacement encoding strength of 0.13 cycles/mm was used to achieve a good balance between signal-to-noise ratio, displacement sensitivity, and separation of k-space peaks.
Image Reconstruction. Image reconstruction was performed off-line as follows: For each encoding direction and cardiac phase, the two complementary raw data sets were subtracted, followed by application of a circular filter with a 9-pixel diameter to remove any residual signal in the “T1-relaxation” peak (Figure ). 2DIFT was then performed to reconstruct complex subtraction images. Each subtraction image was then background phase corrected using the corresponding phase reference image. Phase-contrast images were phase-unwrapped and corrected for bulk motion to reconstruct 1D displacement maps, and 2D displacement maps were computed by vector addition of orthogonal 1D displacement data. From the 2D displacement data, the 2D strain tensor, E, was computed by isoparametric formulation using a quadrilateral element.
In-vivo Imaging. Short-axis imaging was performed in four normal human subjects. Imaging parameters included field of view=350 mm, 128×60 matrix, slice thickness=8 mm, echo train length=6, TR=12 ms, receiver bandwidth=888 Hz/pixel, flip angle=15°, phase-encode lines per cardiac phase per heartbeat=30, temporal resolution=60 ms, and partial Fourier factor=0.75. The readout direction always coincided with the direction of displacement encoding. Also, a 4-channel phased array RF coil was used.
Data Analysis. The effectiveness of CSPAMM for artifact suppression was evaluated by measuring the ratio of energy in the “T1 relaxation” peak to the energy in the displacement-encoded peak. Mean values of radial strain (Err) and circumferential shortening strain (Ecc) were evaluated at multiple cardiac phases in the septum, anterior, lateral, and inferior walls. To demonstrate the high spatial resolution of cine DENSE, subendocardial and subepicardial values of Ecc were computed at end systole.
Results: The energy ratio varied from 1% at the first cardiac phase, to 7% at end systole, and to 20% at the last cardiac phase, reflecting the time-dependence of the different signals in DENSE imaging and the success of CSPAMM-based signal suppression, at least through end systole. Example end-systolic magnitude and displacement images are shown in Figure , where the tail of each displacement vector indicates the position of that element at end diastole. The results of multi-phase strain analysis are shown in Figure . Err and Ecc measures are consistent with previous values obtained using myocardial tagging [5]. Table provides Ecc values for subepicardial and subendocardial layers at end systole, demonstrating the high spatial resolution of the cine DENSE sequence.
Conclusions: The use of CSPAMM in conjunction with a narrow k-space filter enabled time-independent suppression of the artifact-generating signal arising from T1 relaxation. By combining CSPAMM suppression with a rapid cine method such as FGRE-EPI, high-resolution multi-phase displacement-encoded images can be acquired in a breathhold duration of 18 heartbeats. Since this technique measures high-resolution multi-phase strain without the need for tag detection, it may be particularly useful for stress testing.
Table 1. Average values of subepicardial and subendocardial Ecc from all four volunteers
Figure 1. End-systolic raw data showing the displacement-encoded signal at kx=0 and the “T1-relaxation” signal at kx=0.13 cycles/mm (a). The “T1-relaxation” signal was nearly suppressed using CSPAMM (b). Residual energy of this signal was zeroed using a circular filter.

Figure 3. Time evolution plots of regional (a) Err and (b) Ecc. The left ventricle was divided into four sectors: septal, anterior, lateral, and inferior.
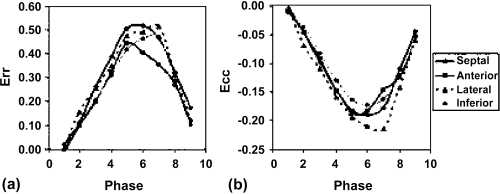
References
1. Aletras, A. H., et al. J. Magn. Reson. 137:247–252, 1999.
2. Aletras, A. H., et al. Proc. SCMR 110, 2002.
3. Kuijer, J. P. A., et al. Magn. Reson. Med. 46:993–999, 2001.
4. Aletras, A. H., et al. Magn. Reson. Med. 46:523–534, 2001.
5. Moore, C. C., et al. Radiology 214:453–466, 2000.
412. A Cardiovascular Magnetic Resonance Multiecho Technique in the Early Diagnosis of Myocardial Iron Overload
Mark A. Westwood,1 Lisa J. Anderson,1 David N. Firmin,1 Peter D. Gatehouse,1 Beatrix Wonke,2 Dudley J. Pennell1
CMR Unit, Royal Brompton Hospital, London, United Kingdom, Department of Haematology, Whittington Hospital, London, United Kingdom.
Introduction: Heart failure caused by myocardial iron overload is the commonest cause of death in thalassemia major, and once symptoms develop, the outlook is poor. A magnetic resonance, gradient echo technique for quantifying tissue iron by using T2* measurements, has been previously validated. However, this technique is time consuming and for the best reproducibility a high degree of expertise is required. We designed a multiecho technique to address these problems.
Purpose: To assess tissue iron concentrations by the use of a gradient echo T2* multiecho technique.
Methods: We compared the results of measurements of heart T2* from 32 patients using the established multiple breath-hold multiple TE constant TR sequence with a new multiecho sequence which acquires all images within a single breath-hold. Using the conventional sequence, 9 individual short axis mid ventricular slices were acquired using gradient echoes. The only parameter altering between each acquisition was the echo time, increasing from 5.6 ms to 18.0 ms. The signal intensity of a full thickness region in the left ventricular septum was measured in each of the nine images and then plotted against the echo time used. This was then used to derive the T2* value of the myocardium. With the multiecho sequence a single short axis mid-ventricular slice was acquired at eight echo times between 2.6 and 16.74 ms in a single breath hold. Subsequent analysis was the same as for the conventional sequence.
Results: There was good agreement between myocardial T2* values between both methods in the abnormal range of T2*<20 ms (mean difference 0.2 ms, 95% CI −1.3 to 0.9 ms, r=0.97, p<0.0001). The coefficient of variability between the methods was 3.5%. The interstudy reproducibility using the multiecho sequence had a coefficient of variability of 2.3%, compared with 4.7% for the conventional sequence.
Conclusions: The use of the single breath-hold, multiecho acquisition allowed reliable quantification of myocardial T2*. The improved reproducibility and speed of this technique allows faster patient throughput, and therefore reduced cost, which is important in developing countries where thalassemia is most prevalent. This may prove useful as a method of screening for myocardial iron loading.
413. Rapid (<10 Secs), Complete, 4D Assessment of LV/RV Volumes Using SSFP in Heart Failure Patients
Girish Narayan, MD,1 Patricia Nguyen, MD,1 Jan Engvall, MD,2 Krishna Nayak, Ph.D.,3 Phillip Yang, MD,1 Bob Hu, MD.3
Cardiology, Stanford University, Stanford, CA, USA, Cardiology, University of Linkoping, Linkoping, Sweden, Electrical Engineering, Stanford University, Stanford, CA, USA.
Introduction: Steady State Free Precession (SSFP) techniques have been shown to provide highly accurate assessment of LV/RV volumes. However, complete volumetric assessment of LV/RV volumes still requires multiple breath-holds. We have developed a technique to achieve this in a single breath-hold using SSFP. We validated this technique against accepted methodologies in patients with CHF.
Purpose: To compare the accuracy and reproducibility of a triggered SSFP technique with a real-time GRE technique for the assessment of LV and RV volumes.
Methods: 15 patients with a clinical history of CHF underwent MR scans in the standard short axis orientation in a 1.5T scanner with the existing, validated real-time GRE technique as well as the new SSFP technique on the same day. The real-time GRE technique employed the following parameters: TE 4.6 ms, TR 30 ms, flip angle 30 degrees, slice thickness 5 mm with 5 mm inter-slice gap, FOV 20 cm. The inplane spatial resolution was 1.9 mm with a temporal resolution of 116 ms reconstructed at a frame rate of 16 fps. The heart was scanned from the base to the apex, with manual transition from slice to slice. Patients were asked to take shallow breaths to prevent misregistration of slices. The SSFP technique employed the following parameters: TR 5.9 ms, flip angle 90 degrees, slice thickness 7 mm with 3 mm inter-slice gap, FOV 20 cm. The inplane spatial resolution was 1.9 mm at a temporal resolution of 120 ms reconstructed at frame rate of 16 fps. Slices were automatically advanced after each cardiac cycle based on a pulse oximetry waveform trigger. Patients were asked to hold their breath during the acquisition. Volumes were calculated off-line using NIH image. To compare the two methods, a correlation coefficient and a Bland–Altman analysis were employed. Inter- and intra-observer variability were also assessed.
Results: Triggered SSFP assessment of LV/RV volumes could be accomplished in less than 10 secs in all patients. GRE real-time scanning was completed in less than 1 minute. Sample frames are shown in Figure . Triggered SSFP showed excellent correlation with the GRE real time technique: LVEDV: r=0.94, p<0.0001, LVESV: r=0.91, p<0.0001, RVEDV: r=0.96, p<0.0001, and RVESV: r=0.92, p<0.0001 (Figure ). Both techniques showed excellent and similar inter- and intraobserver reproducibility (Figure ). SSFP resulted in more reproducible values for RV end-diastolic volumes.
Conclusion: A 4D dataset can be rapidly acquired in a single breath-hold using triggered SSFP, allowing accurate and reproducible quantification of LV and RV volumes.
Figure 1. Real-time, GRE (left) and Triggered SSFP (right) single frames of approximately the same mid-ventricular location.
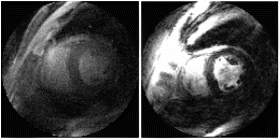
Table 1. Interobserver variability
Table 2. Intraobserver variability
414. Triggered Real-Time Cardiac MRI
Krishna S. Nayak,1 John M. Pauly, Ph.D.,1 Bob S. Hu, M.D.2
Electrical Engineering, Stanford University, Stanford, CA, USA, Cardiovascular Medicine, Palo Alto Medical Foundation, Palo Alto, CA, USA.
Introduction: Real-time interactive MRI is becoming the method of choice for many cardiac applications. One current limitation of real-time techniques is inaccurate slice registration during free-breathing. A triggered real-time imaging approach is proposed, which enables the acquisition of synchronized and accurately registered real-time movie loops during short breath holds. We demonstrate application to 4D ventricular function, fully resolved color flow imaging, and volumetric imaging of intracavitary flow within a breath hold.
Purpose: To implement and test real-time imaging sequences that react to trigger signals during continuous scanning, thereby achieving accurate registration of real-time movie loops during a breath hold.
Methods: Spiral SSFP [1] and color flow [2] real-time sequences were modified such that on operator command, the scan would enter a ``triggered’’ mode in which the scan-plane or direction of flow encoding would increment in response to cardiac triggers. Plethysmograph triggering was used with a trigger delay of 330 ms. To prevent premature switching in case of arrhythmia, a minimum trigger spacing of 400 ms was enforced. Using this method, N synchronized and registered real-time loops could be acquired in a breath hold of N R-R intervals. For example, in multi-slice studies, N parallel slices were planned. During a breath hold, the scan plane is shifted to a new location automatically on each cardiac trigger. This is repeated until all N real-time loops are acquired. Sequence timing is illustrated in Figure .
All experiments were conducted on a GE Signa 1.5T CV/i scanner. Spiral SSFP imaging was conducted with a 2.4 ms readouts and a TR of 5.9 ms. Twenty spiral interleaves were used to achieve 1.88 mm resolution over a 20 cm FOV. The temporal resolution was 118 ms, with images reconstructed and displayed at 24 frames/s using a sliding window. Spiral color flow imaging was conducted with spectral-spatial excitation, 12 ms readouts, and a TR of 30 ms. Two spiral interleaves were used to achieve 2.8 mm resolution over a 20 cm FOV every 120 ms. Images were reconstructed and displayed at 12 frames/s.
Results: Seven healthy volunteers were scanned using triggered real-time spiral SSFP. In each, real-time movie loops of 8 short-axis slices (spanning the LV) were acquired in a single 8 heartbeat breath hold. Heart rates were 50–81 beats per minute, resulting in breath hold durations of 7–10 seconds. Figure contains typical end-systolic and end-diastolic frames from one such study. In all studies, satisfactory end-diastolic and end-systolic frames were captured at each slice location for semi-automated segmentation and volume calculation. Measurements of EF and LV mass were within the expected range, and 8-slice coverage enabled regional wall motion assessment for all 16–17 myocardial segments.
Three volunteers were scanned using triggered real-time color flow. Figure contains sample images illustrating how X, Y, and Z flow encoding could be achieved in a 4-second breath hold, and how multiple slices coverage could be used to capture volumetric flow information in a short breath hold.
Conclusions: Triggered real-time imaging is a useful method for acquiring synchronized real-time movie loops at the same respiratory position. This technique could be applied to any exam where real-time image quality is sufficient and multiple movie loops are required. Initial studies demonstrate volumetric LV function and wall-motion assessment, and fully resolved flow imaging with multi-slice coverage, within short breath holds.
One natural extension of this work would be to also monitor respiratory position during continuous scanning [3], potentially eliminating the need for even a breath hold. This work could potentially reduce operator dependence of a standard cardiac examination.
Figure 1. Acquisition timing during normal rhythm. Pulse sequence parameters are modified between successive loop acquisitions, and transitions are initiated by cardiac triggers.
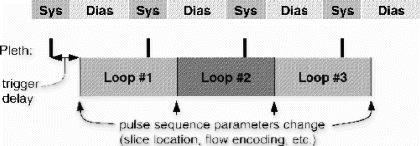
Figure 2. Synchronized real-time movie loops of 8 slices were acquired in an 8-second breath hold. (left) end-diastolic and (right) end-systolic frames are shown. In addition to wall motion assessment, the following data were quantified: EDV=108.5 ml, ESV=42.0 ml, EF=61.3%, Mass=129.7 g.
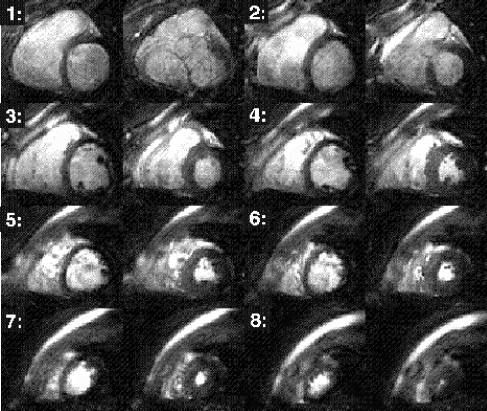
Figure 3. Synchronized color flow movie loops of (top) X, Y, and Z flow encoding in a four second breath hold, and (bottom) six slices spanning the aortic valve in a seven second breath hold.
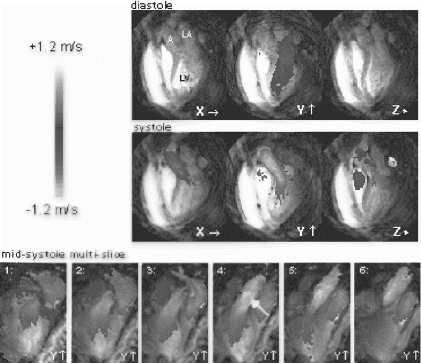
References
[1] Meyer, C H., et al. ISMRM 2001, #442.
[2] Nayak, K. S., et al. MRM 2000, 43:251–258.
[3] Stainsby J., et al. ISMRM 2001, #176.
415. Comparison of Right Ventricular Volume Measurements Between Axial and Short Axis Orientation Using a Steady-State Free Precession Magnetic Resonance Imaging
Khaled Alfakih, MBBS,1 Sven Plein, MD,1 Tim Bloomer, MBBS, BSc,1 Tim Jones, MSc,1 John Ridgway, Ph.D.,2 Mohan Sivananthan, MD.1
Cardiac MRI, Leeds General Infirmary, Leeds, United Kingdom, Department of Medical Physics, Leeds General Infirmary, Leeds, United Kingdom.
Introduction: In previous Magnetic resonance imaging (MRI) studies data, for right ventricular (RV) volume measurements, were acquired either in the axial or short axis orientation. In the short axis orientation, the position of the pulmonary and tricuspid valves cannot be clearly identified and therefore it is not usually possible to be certain of the basal boundary of the RV. The axial orientation is well suited for imaging of the RV as the tricuspid valve is imaged in profile and the margins are easily distinguishable between the RV and the right atrium. However, the partial volume effect of blood and myocardium on the inferior wall of the RV can cause difficulty in identifying the blood/myocardial boundary. This effect is particularly seen with segmented-k-space turbo gradient echo (TGE) pulse sequences which have low contrast between blood and myocardium at the endocardial border. Steady-state free precession (SSFP) imaging has been shown to have improved blood-myocardium contrast and hence better endocardial border definition. It should reduce the error associated with the partial volume effect at the inferior wall of the RV.
Purpose: To compare the RV volume measurements, their agreement and reproducibility, between conventional short axis and axial orientations using the SSFP pulse sequence.
Methods: We studied 20 normal volunteers (12 male and 8 female) on a 1.5-Tesla Philips Intera CV MRI system with a five-element cardiac phased-array coil with breath holding and vectorcardiographic gating. After localising scans to allow planning of the left ventricular short axis orientation, multiple-slice data sets, parallel to the mitral valve, in 10–14 short axis slices were acquired using an SSFP pulse sequence (TR=3.34 ms, TE=1.67 ms, flip angle=55°, 18 phases/cardiac cycle, two slices per 10–12 second breath-hold). Axial orientation was planned from the coronal localizing images. A stack of orthogonal slices was planned to cover the heart from a level just below the diaphragm to the pulmonary bifurcation. Typically 12 slices were acquired, 18 phases/cardiac cycle, with two slices per 10–12 second breath-hold using the same pulse sequence.
Image analysis was performed off-line using MASS analysis software. For both the short axis and axial data sets the endocardial contours of the RV were traced manually at end-diastolic and end-systolic frames. For the short axis, in the basal slice, both in end-diastole and in end-systole, if the pulmonary valve was visible, only the portion of the right ventricular outflow tract below the level of the pulmonary valve was included. For the inflow part of the RV, the blood volume was excluded from the RV volume if the surrounding wall was thin and not trabeculated as it was considered to be in the right atrium.
For the axial data sets, at the tricuspid valve ring the contours were traced up to the tricuspid valve and joined by a straight line through the blood pool. The uppermost slice was defined as the first slice where a pulmonary cusp can be identified and, both in end-diastole and in end-systole the area of the pulmonary cusp was excluded from the volumes. Slices above that level were considered to include the main pulmonary artery and were excluded from the RV volume. In addition, the LV endocardial contours were drawn in the short axis data sets. LV and RV end-diastolic volume (EDV) and end-systolic volumes (ESV) were computed and LV and RV Stroke volume (SV) and ejection fraction (EF) were calculated.
The mean and standard deviation were calculated for all parameters. The agreement between the short axis and the axial methods as well as interobserver variability on all datasets and intraobserver variability on 10 randomly selected data sets were calculated using Bland and Altman's method.
Results: There were statistically significant differences in right ventricular EDV, ESV and EF measurements between the axial and the short axis orientations, while the SV were similar (Table ). The mean absolute difference between LV and RV stroke volumes for the axial method was 7.6±9.1(r=0.93) and for the short axis method was 7.4±10.8(r=0.9).
The intra and inter observer variability were lower for the axial method than the short axis method. For example intraobserver variability for EDV in the axial method was −2.6 ± 5.5 and −2.7 ± 8.2 for the short axis. Interobserver variability for the EDV in the axial method was −5.9 ± 8.0, and −8.4 ± 9.2 for the short axis.
Conclusion: The axial measurements were more reproducible than the short axis measurements. Reproducible measurements of the RV are of clinical importance. They allow accurate assessment of RV volume and function. The SSFP pulse sequence described adds no more than five minutes to the examination.
Table 1. Axial vs. short axis measurements. (Abstract 415)
416. Time Course of 23Na Signal Intensity After Myocardial Infarction in Humans
Joern J. W. Sandstede, MD,1 Hanns Hillenbrand, MD,2 Meinrad Beer, MD,1 Thomas Pabst, Ph.D.,1 Felix Butter, MD,1 Wolfram Machann,1 Wolfgang Bauer, MD,2 Dietbert Hahn, MD,1 Stefan Neubauer, MD.3
Department of Radiology, University of Wuerzburg, Wuerzburg, Germany, Department of Internal Medicine, University of Wuerzburg, Wuerzburg, Germany, Department of Cardiovascular Medicine, Oxford University, Oxford, United Kingdom.
Introduction: Experimental studies have demonstrated persistently increased 23Na content in non-viable myocardium post-myocardial infarction.
Purpose: Our hypothesis was that non-viable myocardium in humans shows elevated 23Na content at all stages of infarct development, and that, therefore, non-viable human myocardium can be imaged with 23Na MRI.
Methods: 10 patients were examined on day 4, 14, and 90 after infarction, 5 patients had a 12-month-follow-up. Double angulated short axis 23Na images of the heart were obtained in prone position using a 23Na surface coil and an ECG-triggered 3d-gradientecho-sequence. T2w imaging (n=9) was performed on day 4, 14, and 90. Wall motion abnormalities were detected by cine MRI, and the transmural extent of infarction was determined by late enhancement on day 90. 23Na SI of the infarcted myocardium was expressed as percentual increase over 23Na SI of the entire non-infarcted myocardium.
Results: All patients showed an area of elevated SI on 23Na and T2w images correlating with wall motion abnormalities. 23Na SI was highest on day 4 and decreased till day 90 but remained elevated (39±18%, 31±17%, 28±13% on day 4, 14, and 90, respectively, p=0.001). No further decrease was found one year after infarction (25±7%, p=0.89 vs day 90). T2w imaging showed a decreasing edema between day 4 and 14. On day 90 only 6/9 patients had a residual edema. Late enhancement was 50–75% and >75% in 4, and 6 patients, respectively.
Conclusions: 23Na SI is elevated in non-viable infarction at all time points following myocardial infarction. Thus, 23Na MRI may be a suitable technique to image non-viable myocardium in humans.
417. Localized Measurement, Display, and Adaptation of Functional Information Through a Real-Time Interface
Andres Carrillo,1 Ajit Shankaranarayanan,1 Juan Santos,2 Krishna S. Nayak,2 Phillip C. Yang,3 Bob S. Hu,4 Graham A. Wright,5 Jean H. Brittain.1
ASL West, GE Medical Systems, Menlo Park, CA, USA, Electrical Engineering, Stanford University, Palo Alto, CA, USA, Department of Medicine, Stanford University, Palo Alto, CA, USA, Palo Alto Medical Foundation, Palo Alto, CA, USA, University of Toronto, Toronto, ON, Canada.
Introduction: The assessment of cardiac function frequently requires the evaluation of localized physiologic and anatomic information. For instance, regional blood flow characteristics, oxygenation levels of specific cardiac chambers, or focused examination of a coronary lesion are all important determinants of cardiac physiology. With the development of real-time interactive MR imaging [1,2], the opportunity now exists to survey the entire heart and then interactively select regions of interest for a focused measurement and display of functional information within the identified region of interest. In this scenario, the larger image provides reference information about surrounding anatomy while the sub-image provides targeted updating associated with specific volumes or tissues.
We have adapted the GE iDrive real-time interface (GE Medical Systems, Milwaukee, WI) so that the user can interactively identify local regions of interest and then select specific functional information for local measurement, updating, and/or display. Two specific examples we have implemented are (a) local field measurement and shimming suitable for examination of specific coronary segments and (b) local measurement and display of flow information through color overlay.
Methods: Localized B0 and shim correction: Traditionally, B0 correction is performed at iso-center during the calibration procedure preceding a real-time MR study. During the course of an exam, the operator utilizes the real-time navigation tools to interactively change the imaging plane to localize the desired anatomy. Due to the lung-induced susceptibility shifts around the heart, center frequency and shim parameters can change significantly with imaging plane. This is especially important in the imaging of small structures such as the coronaries in regions of large susceptibility shifts. Our system allows the operator to interactively define a region-of-interest on the real-time images for optimization of image quality. Without leaving the real-time application, a field-map acquisition is initiated. The system communicates the region-of-interest to the reconstruction process, which utilizes only the defined area to calculate the new center frequency and first order shim parameters. These parameters are then communicated back to the pulse sequence, which immediately adjusts the shim values. Note that the correction is accomplished by changing the physical shim values. Compared to a method that corrects for center frequency and shim errors in reconstruction, this pre-acquisition approach improves the effectiveness of spectrally-selective RF pulses and results in the acquisition of more ideal data. To ensure robust improvements in image quality, the shim terms are updated only if the selected area is larger than 1/4 of the area of the image. If this condition is not met, only center frequency is updated.
Localized color overlay: Color overlays are utilized for flow visualization in ultrasound and have been previously utilized in MR [3]. While the color-enhanced region in an ultrasound image is naturally limited to the region of insonification, previous MR implementations have overlaid color over the entire grayscale image. This approach obscures the anatomy and can be distracting. In addition, the color overlay process is computationally intensive. Display frame-rates and diagnostic value can be increased by limiting the region of color overlay to the clinically relevant regions. Using our system, the operator can define a region of interest encompassing the desired anatomy. The location of this region is communicated to the display process, which limits the color overlay to within this region. We compared the display performance for the color overlay over different percentages of the area of the whole image. All images were reconstructed at 128×128 and displayed at 512×512 pixels. The visualization was performed on an Octane (Silicon Graphics, Mountain View, CA) 270 MHz IP30 processor with 512 Mbytes of memory.
Results: Figure compares an image acquired using the initial B0 and shim correction with an image acquired using the real-time localized B0 and shim correction. The sub-image inside the white box in image (a) was used to calculate the B0 correction parameters. Note the left and right ventricles can be clearly appreciated in image (b) while they are not distinguishable in image (a).
The times necessary to render an image with full color overlay and a color overlay of 1/2, 1/4 and 1/8 of the field of view are shown in Table . The achievable frame rate was extrapolated from the time necessary to display one image. Typically, the area over which there is clinical interest for flow visualization is small. As illustrated in the table, a 21% increase in frame rate is achieved by reducing the color display to an area of 1/8 of the full FOV.
Discussion and Conclusion: Focused examination of the coronary artery lesions requires accurate frequency correction over the region of interest. This is best achieved by a direct local estimation of the field and real-time correction of center frequency and shim values.
Utilizing a localized color overlay to display flow information has several advantages. Limiting the overlay to a specific area brings the MR presentation of the data closer to that of ultrasound. In addition, color rendering is a computationally expensive operation. Reducing the amount of color displayed translates into an increase in the visualization frame rate.
The ability to provide real-time focused examination of regions of interest such as shimming and localized color overlay in a real-time color flow exam significantly increases the image quality, performance and usability of the system.
Table 1. Rendering times and display frames per second for 128×128 reconstructed images displayed at 512×512 with different percentages of the full image overlaid in color. Note that the frame rate in all cases is sufficient for clinical diagnosis of valvular disease
Figure 1. Transaxial slice through the left ventricle before and after localized B0 correction and shim. The images were acquired on a 1.5T GE Signa scanner. The sequence was run with a 28 ms TR, 60° flip angle, 4 spiral arms with 2048 points each and a 24 cm field of view for an effective resolution of 3 mm. Image (a) was acquired at a location where the original shim was no longer optimal. Image (b) was acquired at the same location after applying the shim corrections calculated over the area shown in white.
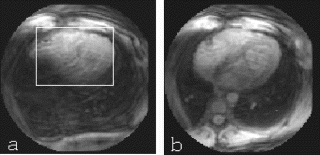
References
[1] Riederer, et al. Radiology 1991 181:33–39.
[2] Kerr, et al. Mag. Res. Med. 1997 38:355–367.
[3] Nayak, et al. Mag. Res. Med. 2000 43:251–258.
418. Artifact Reduction in True-FISP Imaging of the Coronary Arteries by Adjusting Imaging Frequency
Vibhas S. Deshpande, MS, Steven M. Shea, MS, Debiao Li, Ph.D.
Radiology, Northwestern University, Chicago, IL, USA.
Introduction: Volume targeted breath-hold imaging using a true-FISP (fast imaging with steady precession) sequence has been described for MR coronary angiography (1). Substantial improvements in SNR and CNR were shown as compared to FLASH (fast low angle shot). However, a well-known limitation of true-FISP is its sensitivity to resonance offset. One of the main sources of off-resonance is B0 field inhomogeneity. Another source is the incorrect setting of the imaging frequency. Careful shimming can minimize these effects.
Achieving uniform fields by shim adjustments is challenging in cardiac applications due to heart and respiratory motions, blood flow, chemical shift, and susceptibility variations at air–tissue interfaces. Sub-optimal shimming gives rise to field inhomogeneity and variations in resonant frequency. Fat saturation using a chemical shift pre-pulse is also sensitive to field inhomogeneities and the water frequency selected for imaging. Since field distortions can alter the fat frequency, the suppression may be compromised if a fixed frequency offset is used when the shimming or the selected water frequency is sub-optimal. If the optimal frequency offset for fat is determined for the volume of interest (VOI), the fat suppression can be improved.
Purpose: The goal of this work is to demonstrate that if apparent off-resonance artifacts are present in true-FISP coronary artery images, changing the automatically adjusted imaging frequency can improve image quality in some cases. Quick and easy pre-scan methods to determine the optimal imaging frequency and fat saturation pulse frequency are proposed.
Methods: Frequency Scout Sequence Design.
A two-dimensional (2D) true-FISP sequence was used to scout for the optimal imaging frequency. The data acquisition was designed to emulate the acquisition scheme of the 3D coronary artery imaging sequence: Electrocardiographic (ECG)-triggering was used, and a fat saturation pulse followed by an α/2 pre-pulse and 20 constant flip angle preparation cycles were applied before data acquisition in each cardiac cycle. The data were acquired centrically in the phase-encoding direction. Phase alternation was implemented in successive rf cycles. A constant phase shift between successive rf pulses and ADC's represents a frequency offset (2). Therefore, to simulate frequency offsets, an additional phase offset φ was added to the successive rf pulses and ADC. The total phase increment for successive rf pulses and ADC then was the sum of the phase alternation and the desired frequency offset. Multiple measurements were performed in a single breath-hold, each measurement with a different additional phase offset φ, and therefore at a different frequency offset. Since true-FISP is sensitive to off-resonance, the image with the least artifacts represents the optimal imaging frequency. The sequence parameters were as follows: TR/TE/flip angle=3.6 ms/1.8 ms/70°.
To find the optimal fat saturation frequency, the above sequence was used with φ set to zero and a variable fat saturation pulse frequency offset. The measurement that shows the best fat suppression indicates the optimal fat saturation pulse frequency offset.
Coronary Artery Imaging: Coronary artery imaging was performed in healthy volunteers (n=13) (Magnetom Sonata, Siemens Medical Solutions) using an ECG-triggered, breath-hold, segmented, 3D true-FISP sequence (TR/TE/flip angle=3.55 ms/1.44 ms/70°). If apparent off-resonance artifacts were observed in the images, the frequency scout sequence was run along the same orientation as the 3D true-FISP scan. If the scout sequence indicated that a shift in frequency was necessary, the synthesizer frequency was changed and the 3D true-FISP scan was repeated. Next, if the fat suppression was found to be sub-optimal, the sequence for scouting the fat frequencies was performed. Again, if the optimal offset was found to be other than −210 Hz, the 3D true-FISP scan was repeated with the fat saturation pulse applied at a frequency offset that was determined from the scout.
The imaging parameters for the scout scan were as follows: FOV=(160−175)×300 mm2, matrix size=(75−105)×256, slice thickness=10 mm, number of measurements=6, lines per cardiac cycle=25 to 35. The parameters for the 3D scans were as follows: FOV=(160−175)×380 mm2, matrix size=(100−140)×512, partitions=12, slab thickness=18 mm.
Results: Of the 13 volunteers, the automatically adjusted imaging frequency was found to be sub-optimal in 6 cases. In the example shown (Figure ), image artifacts were observed when the automatically adjusted frequency was used. The scout images showed that a frequency shift of −160 Hz was optimal. After altering the synthesizer frequency, the image artifacts were substantially reduced.
In 6 of the 7 volunteers scanned for fat frequency shifts, the routinely used −210 Hz fat saturation frequency offset was found to be sub-optimal. In the example shown (Figure ), the scout images indicated that a frequency offset of −260 Hz was optimal for fat suppression. The images acquired after correction show an improved fat suppression, and reduced phase cancellation artifacts at the blood–fat boundaries.
Conclusion: Results show that changing the automatically adjusted frequency to the optimal frequency for the VOI can significantly reduce artifacts in coronary artery imaging. A 2D true-FISP sequence as described above provides a reliable method to detect the optimal imaging frequency and optimal fat saturation pulse frequency offset.
Figure 1. Images acquired at various frequency offsets using the frequency scouting sequence (top row), and images acquired using the 3D true-FISP sequence before and after correction of the frequency (bottom row). The 3D true-FISP image at the auto-adjusted frequency (before correction) shows substantial artifacts (dashed arrows). The frequency scout images acquired in a range of −200 Hz to 0 Hz indicate that the optimal frequency offset is −160 Hz because the blood pool is relatively uniform in the corresponding image. With a shift of −160 Hz in the imaging frequency, considerable reduction in the artifacts was observed in the 3D true-FISP image (after correction).
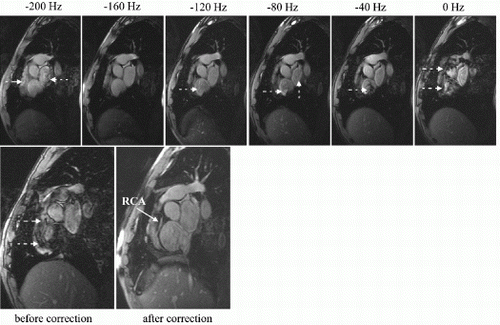
Figure 2. Fat frequency scout images (top row), and images acquired using the 3D true-FISP sequence before and after correction of the fat saturation pulse frequency offset (bottom row). The 3D true-FISP image with the fat saturation pulse at −210 Hz offset (before correction) shows that the fat signal surrounding the coronary artery is not suppressed (dashed arrows). The scout images acquired with the variation in the fat saturation pulse frequency offset indicate that the best suppression is obtained with a frequency offset of −260 Hz for the chemical shift pulse. When the fat saturation pulse frequency offset is set to −260 Hz, the 3D true-FISP image (after correction) shows much better suppression of the fat signal. Notice that the phase cancellation of the signal at the boundaries of the RCA in the pre-correction image is reduced in the image acquired after correction.
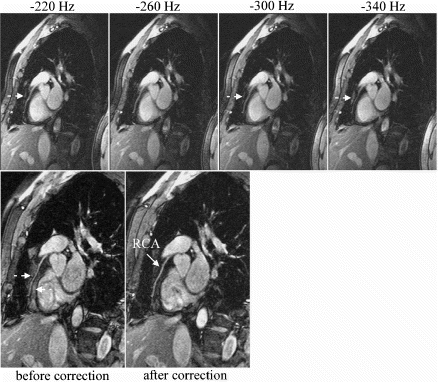
References
1. Deshpande, V S, et al. MRM 2001; 46:494–502.
2. Zur, Y., et al. MRM, 1990; 16:444–459.
3. Nishimura, D. G., et al. Proc. ISMRM 2000; p. 301.
419. 3-Dimensional Steady State Free Precession Imaging of Cardiac Function
David S. Barmby, Sven Plein, J P. Ridgway, U M. Sivananthan.
Leeds Cardiac MRI Unit, Leeds General Infirmary, Leeds, United Kingdom.
Introduction: Steady State Free Precession (SSFP) imaging provides excellent border and blood/myocardial contrast delineation, and has become increasingly of clinical value in the evaluation of Left Ventricular (LV) volume, function and mass by MRI. The conventionally used 2D SSFP acquisition techniques require repeated breath-holds to provide short axis coverage of the entire LV, and this is time consuming, and open to misregistration error. We have developed a 3D SSFP acquisition sequence that images the whole LV in a single breath-hold, and which has the potential to avoid these problems.
Purpose: The purpose of the study is three-fold. Firstly to describe the development of a 3D SSFP technique for measuring cardiac function, secondly compare 12 and 24 slice 3D images acquired with this technique, and finally to compare both with a 2D multiple breath-hold SSFP sequence, in a cohort of healthy volunteers.
Methods: The 3D SSFP sequence employed acquires 12 and 24 slice images covering the entire LV in a single breath-hold. Parameters for the sequence were TR=3.2, TE=1.6, Flip angle 45 degrees, FOV=380, acquired matrix size 256×256, slice thickness 10 mm, slice gap 0mm(12 slice)/-5mm(24 slice).
8 healthy volunteers (mean age 22.6 yrs) were recruited for MRI study. MRI scans were performed on a Phillips 1.5T INTERA CV System (Phillips Medical Systems, Best, The Netherlands). All recruits underwent sequential 2D, 3D 12 slice and 24 slice imaging. The 2D technique parameters were TR=3.6, TE=1.8, Flip angle=55 degrees, FOV=360, acquired matrix 256×256, slice thickness 6 mm, slice gap 4 mm. Multi-phase data sets of the LV were acquired in identical short-axis orientations using each of the techniques.
End-Diastolic Volume (EDV), Ejection Fraction (EF), and LV end-diastolic mass were measured using MASS software (Medis, Leiden, The Netherlands) by drawing endocardial and epicardial contours in the end-diastolic nad end-systolic phases. Comparison was made between 2D, 3D 12 slice and 3D 24 slice MRI results. Mean and standard deviations were calculated and compared using correlation coefficients. Multiple paired t-tests were calculated with a p-value of <0.05 considered to indicate significant differences.
Results: (See Table ). 3D 12 slice and 3D 24 slice estimates of EDV, EF, and LV end-diastolic mass correlated, with no statistical difference between these measurements.
3D estimates of EDV (mean 176.9±33.9) correlated with 3D 12 slice (r=0.95, mean=172.9±31.2) and 3D 24 slice (r=0.98, mean 170.2±28.3) measurements. Similarly, there was a correlation for 2D estimates of EF (mean=56.2±6.4) with 3D 12 slice (r=0.95, mean=53.7±3.00) and 3D 24 slice (r=0.98, mean 55.4±5.3). 2D LV end-diastolic mass measurements (mean 88.2±23.0) were significantly higher than either 3D method (p=0.0003).
Conclusions: Our results show that a single breath-hold 3D SSFP technique for measuring cardiac function is clinically feasible. EDV and EF measurements made with the 3D SSFP technique are comparable to those by conventional 2D SSFP technique. However, LV end-diastolic mass measurements were significantly different between 3D and 2D techniques. This may partly be due to differences in the delineation of the epicardial border between the two techniques. Alternatively, misregistration errors particularly in basal and apical slices could account for the discrepancy.
Table 1. SNR
420. MRI Assessment of Diastolic Dysfunction
Ronald M. Razmi, MD,1 Szilard Voros, MD,2 Agostino Meduri, MD,3 Mark Doyle, Ph.D.,4 Vikas Rathi, MD,5 Gerald M. Pohost, MD.6
Medicine/Cardiology, Univ of Alabama at Birmingham, Birmingham, AL, USA, Medicine/Cardiology, University of Virginia, Birmingham, VA, USA, Radiology, Universita’ Cattolica del S. Cuore, Rome, Italy, Medicine/Cardiology, Alleghany General Hospital, Pittsburgh, PA, USA, Medicine/Cardiology, Allegheny General Hospital, Pittsburgh, PA, USA, Medicine/Cardiology, Southern Methodist University, Los Angeles, CA, USA.
Introduction: Cardiovascular MR imaging (CMR) is rapidly becoming an important tool in clinical practice for numerous indications. Currently, CMR is an accepted method for accurate assessment of left ventricular systolic function. However, methods to evaluate diastolic function are not well developed or involve complex methodologies such as phase contrast imaging or myocardial tagging. The purpose of our study was to define diastolic dysfunction (DD) using readily applicable and routinely used CMR approach.
Methods: CMR assessment of left ventricular volume and mass was performed on gradient echo cine short axis sequences on patients with risk factors for DD (e.g., LVH, hypertension, coronary disease, etc) and a control group of patients with no risk factors and otherwise normal CMR studies. Patients were studied with a 1.5 T system (GE Signa; General Electric Medical Systems, Milwaukee, WI.) Post-examination analysis was performed using the MASS analysis package (MEDIS, Leiden, Netherlands.) Pts (n=19) were categorized as 1) without risk factors for DD (n=11) and 2) with risk factors (n=8). Studied variables were ventricular relaxation rate, LV mass index, EF, and end diastolic volume index.
Results: Diastolic relaxation rate was calculated from a linear regression line fitted to the rate of change of LV volume and was normalized using the body mass index. Also calculated were EF and LV mass index. Using binary linear regression analysis, the diastolic relaxation rate predicted pts with risk factors for DD with a chi-square of 9.8 (P<0.005), whereas LV mass index predicted DD with a chi-square of 5.6 (P<0.05). EF and end diastolic volumes were not significantly different between groups. Normalized diastolic relaxation rate distinguished the two groups with 79% accuracy, cardiac mass index with 74% accuracy, and the combination of the two with 95% accuracy, with chi-square of 18 (P<0.0001).
Conclusions: Diastolic relaxation rate and left ventricular mass index can be used to evaluate left ventricular diastolic function as a component of every CMR study. This information can be derived from the left ventricular analysis routinely performed with each study. This will not add additional time or require complex techniques that may not be widely available.
421. Free-Breathing Diagnostic Quality Pediatric Cardiac MR Imaging: Analysis of Imaging Sequences and Technical Tips
Khan M. Siddiqui, MD,1 Rodney G. Shaffer, MD,1 Bernard D. M. Go, MD,1 Cathleen A. Woomert, MD,1 Fredrick K. Emge, MD.2
Radiology, Geisinger Medical Center, Danville, PA, USA, Pediatric Cardiology, Geisinger Medical Center, Danville, PA, USA.
Introduction: Diagnostic quality pediatric cardiac magnetic resonance (MR) imaging has proven in the past to be a challenge to achieve, usually requiring intubation and general anesthesia to overcome respiratory motion artifacts. These problems have revolved around concerns for the time involved to acquire the cardiac imaging sequence as well as the presence of respiratory motion artifact.
Purpose: Our hypothesis is that free-breathing during image acquisition does not adversely impact the diagnostic quality of pediatric cardiac MR imaging.
Methods: All MR imaging was performed using a 1.5-T clinical MR imaging system (Signa CV/i 1.5T; General Electric Medical Systems, Milwaukee, WI, USA), with cardiac gating. All patients were imaged in adherence with the pediatric procedural sedation protocol at our facility. Ninety-six patients (age range: 1 day–17 years; mean 8 years) who received procedural sedation were included in the analysis. Imaging sequences were analyzed in terms of quality, adequate diagnostic information and artifacts. All studies were interpreted in joint collaboration with the cardiologist and radiologist to determine the diagnosis. A radiology nurse and pediatric intensive care or pediatric cardiology physician supervised the patients‘ sedation and complications were documented.
Results: Ninety-five (98.9%) patients had successful sedation without complications and one had unsuccessful sedation for which the scan was aborted. The study durations ranged from 30 to 90 minutes. There were no complications or unexpected in-hospital admissions reported. All 95 patients had diagnostic quality images. Respiration artifacts did not adversely affect the diagnostic information of the images. Most sequences provided superior identification of gross mediastinal anatomy, higher detail resolution of the mediastinal structures and good signal to noise ratio (SNR).
Conclusion: As young children mostly have an abdominal breathing pattern, decreased chest wall movement with adequate patient sedation provides uniform shallow breathing cycle. This with relatively immobile nature of the mediastinal structures such as aorta, airway, and central pulmonary arteries stabilizes cranio-caudal motion of the heart due to respiration. Hence with the use of appropriate procedural sedation and selection of fast cardiac imaging sequences complete pediatric cardiac MR imaging can be obtained in a timely and safe fashion. New techniques of rearranging k-space to shift the susceptibility artifacts to the periphery of the images and increasing SNR provide even better images. In pediatric population image acquisition time can be significantly reduced by using these techniques to improve image quality while imaging in a free-breathing fashion.
422. Modified Diminishing Variance Algorithm Using Navigators Over the Heart for Coronary Artery Imaging
Robert W. Schaffer,1 Craig H. Meyer,2 John M. Pauly,1 Bob S. Hu,1 Dwight G. Nishimura.1
Electrical Engineering, Stanford University, Stanford, CA, USA, University of Virginia, Charlottesville, VA, USA.
Introduction: The Diminishing Variance Algorithm (DVA) [1] reduces motion artifacts in coronary artery images while maintaining SNR and allowing free-breathing. It monitors position using navigators [2] and iteratively improves a base image by re-acquiring motion-afflicted data. To be an effective and reliable technique, the calculated heart position must be accurate and precise. Navigators are placed over the heart (instead of the diaphragm) with the goal of calculating heart position more accurately. Combining data from multiple navigators [3] increases precision in calculated heart position, but makes it increasingly important to interpret the navigators correctly. We combined methods for handling navigators placed over the heart [4] with the drift-resistent DVA [5] to produce more dependable position data. We also averaged discarded image data from similar positions with used image data to increase the SNR without adding additional scan time. In blinded analysis, seven pairs of images were compared. In each case, images with our new methods were graded as equal or better in vessel definition than those without.
Purpose: To reliably produce high-resolution free-breathing coronary artery images.
Methods: Navigator echos are acquired with a 2 cm-diameter cylindrical excitation and a 1D readout along the excitation axis. Three navigators are placed directly over the heart in the S/I, A/P and R/L directions. They are collected immediately after each image data acquisition (to avoid image saturation) and are cross-correlated with corresponding reference navigators to determine relative position to a resolution of 0.4 mm. While more accurate than diaphragmatic navigators, heart navigators have a variety of shapes throughout the respiratory cycle and, if different than the reference, can result in erroneous position calculations causing motion-afflicted data to be accepted by the DVA. As recommended in previous work, a “mode” reference is calculated from the first 36 navigators to eliminate the probability of using a poor reference. The squared difference between each new navigator (appropriately aligned) and the calculated reference is also measured. If this squared difference is high, the shapes are dissimilar and the corresponding image data is discarded. Finally, when discarded frames are very close in position and shape to the replacement frames, they are averaged to increase SNR. Note, this only happens when the mode changes or when the DVA is close to converging. All scans were obtained on a GE Signa 1.5T CV/i scanner.
Results: Calculating the “mode” reference eliminated the possibility of choosing a poor reference. By replacing subsequent frames that had differently shaped navigators (than the reference), we also saw an improvement in the images. Figure shows the improved vessel definition resulting from our techniques. In a blinded analysis, a cardiologist experienced in MRI compared seven such pairs of images (with and without our new methods). In every case, the image produced with our enhancements had equal or better vessel definition. Figure shows two high-resolution DVA images.
Conclusions: We have demonstrated that by carefully calculating a reference, testing navigator integrity and averaging duplicate image data we improve the reliability and effectiveness of DVA. Combining these methods with the previously developed update-target techniques make the DVA a robust method for high-resolution MR angiography in free-breathing patients.
Figure 1. Cardiac-gated spiral images (cropped) w/90 interleaves, 0.7 mm resolution and 24 cm FOV (a) before and (b) after our methods have been applied, but before the DVA has fully converged. The right coronary artery (RCA) is much sharper in the 2nd image.
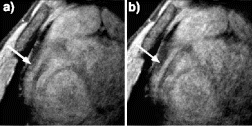
Figure 2. Cardiac-gated spiral images (cropped) w/90 interleaves, 0.7 mm resolution and 24 cm FOV. (a) Left Anterior Descending Artery (LAD), (b) RCA after the DVA has converged.
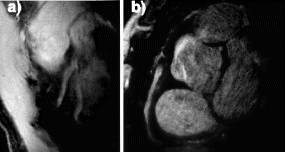
References
[1] Sachs, T. S., et al. MRM 34(3):412, 1995.
[2] Ehman, R. L., et al. Radiology 173(1):1, 1989.
[3] Sachs, T. S., et al. IEEE TMI 19(2):73, 2000.
[4] Schaffer, R. W., et al. 10th ISMRM 2308, 2002.
[5] Schaffer, R. W., et al. 9th ISMRM 1850, 2001.
423. MR Coronary Angiography Using a Novel 2-Element Phased-Array Coil: Improved Image Quality and Anatomic Coverage
Jan E. Engvall,1 Greig C. Scott, Ph.D.,2 Juan M. Santos, MSEE,2 Patricia Nguyen, MD,1 MinSu Hyon, MD, Ph.D.,1 Miriam Amitai, MD,1 Michael M. McConnell, MD, Ph.D.,1 John Pauly, Ph.D.,2 Dwight Nishimura, Ph.D.,2 Bob S. Hu, MD,2 Phillip C. Yang, MD.1
Cardiology, Stanford University, Stanford, CA, USA, Electrical Engineering, Stanford University, Stanford, CA, USA.
Introduction: The clinical application of MR coronary angiography (MRCA) remains limited by inconsistent anatomical coverage and image quality. In order to address these issues, various receiver coils have been developed. We developed a novel, inexpensive 2-element phase array coronary coil (CC).
Purpose: We conducted a systematic comparison of 3 different receiver coils. Image quality and anatomic coverage of the coronary arteries were compared among CC, 5-inch surface coil (SC), and General Electric cardiac coil (GC).
Methods: The CC was constructed to enhance SNR and anatomic coverage. A 4-inch circular coil was overlapped in linear array to eliminated mutual inductance. Each coil was split into 4 quadrants with distributed capacitors to minimize dielectric loss. The CC was placed in cranial–caudal position along the subject's left chest. The proximal coil covers the right coronary artery (RCA), left circumflex artery (LCx), left main, and proximal-left anterior descending (LAD). The distal coil covers the mid- and distal-LAD. A total of 15 healthy volunteers were recruited to evaluate anatomic coverage and image quality achieved by CC, SC, and GC. The subjects were scanned in a GE Signa 1.5T CV/i scanner with high performance gradient (40 mT/m peak amplitude and 150 mT/m/msec slew rate) using adaptive real-time architecture. This architecture allows reconfiguration between real-time localization (RT) and gated spiral high-resolution (HR) imaging sequences within 1 scan TR. The anatomic coverage was based on the number of coronary segments visualized using a 9 coronary segment model accepted by ACC/AHA. Three investigators blinded to the coil type assessed the image quality of each coronary segment based on both the percentage of vessel border contiguity and artifact visualized (grade 1–4: 1=excellent, 2=good, 3=diagnostic, 4=non-diagnostic).
Results: Image quality and anatomic coverage were assessed for proximal-mid (PM)and distal (D) coronary segments. Image quality of the coronary segments was significantly improved using CC (p<05). Image quality of at least diagnostic quality (grade<3) was achieved in 94% of PM and in 56% of D segments using CC. In comparison, SC achieved similar image quality in 80% of PM and 44% of D segments and GC achieved 89% and 24%, respectively. In addition, anatomic coverage was also significantly improved with CC (p<0.05). Using CC, 78% of the D segments were visualized compared to 68% by SC and 58% by GC. Higher SNR was also achieved using CC coil in comparison to other coils in d-LAD and p-RCA (p<0.05). No difference, however, was seen in CNR (p=NS). Specific SNR and CNR data are illustrated in Tables . Sample comparative images of the d-LAD (arrow) acquired using CC, SC, and GC are shown in Figure .
Conclusions: A systematic comparison of the image quality and anatomic coverage demonstrated that a novel, inexpensive 2-element phase array coronary coil enhances MRCA.
Table 1. SNR
Table 2. CNR
424. Importance of Navigator Window Size and Tracking Factor for Coronary Angiography Investigated by Retrospective Adaptive Motion Correction
Steffen Ringgaard, Ph.D., Michael S. Hansen, M.Sc., Erik M. Pedersen, Ph.D., D.M.Sc.
MR-center, Skejby Sygehus, Aarhus University Hospital, Aarhus, Denmark.
Introduction: In 3D MR coronary angiography, respiratory motion artifacts are usually reduced with the use of navigator echoes. The navigator is normally placed at the right diaphragmatic dome and often both navigator gating and tracking are used. Because the diaphragm and heart do not move with the same amplitude, a certain scaling factor is used with tracking.
Purpose: To investigate the correlation between gating window range, tracking factor and image motion artifacts.
Methods: All measurements were acquired with a Philips NT/Intera scanner with a 5-element cardiac coil. The coronary angiography scan was a 3D sequence with ECG triggering and navigator gating and tracking. A small gating window of 3 mm and a prospective tracking factor of 0.6 was used. The matrix was 512×358×10 and FOV was 360×270×30 mm3 and other parameters were as in [1]. The transversal 3D slab was positioned so the proximal parts of both the RCA and the LCA were included.
The navigator signal was stored during scanning and used for retrospective motion correction. To investigate the influence of gating window size, the images were reconstructed with windows from 3 to 25 mm in steps of 2 mm. The first acquired shot inside the acceptance range was used. To investigate the influence of tracking factor, the images were reconstructed with tracking factors from 0.0 to 1.0 in steps of 0.1. A gating window of 10 mm was used for the reconstructions with varying tracking factors. This adaptive motion correction was done by shifting the spatial position of each data profile by a first-order phase correction in K-space according to the Fourier Shift theorem. The shift distance was given by the stored navigator position multiplied by the tracking factor [2].
Eight healthy young volunteers were included in the study. In three volunteers, a high-resolution scan with 80 slices and voxel size of 0.70×0.88×1.0 mm3 was also acquired. In three other cases, a spiral scan with 10 slices and voxel size of 70×0.70×3.0 mm3 was also included.
The method was validated by in vitro experiments using a computer controlled motion phantom.
The image quality was analyzed by quantifying the gradient of the coronary vessel wall. This was done at one position in the right main and one in the left main coronary arteries. Furthermore, the amount of signal in the background outside the body in the phase direction was calculated. This signal is assumed to be related to the amount of motion induced phase noise.
Results: The vessel gradient of both the right and left coronaries decreased with increasing gating window and the signal amount in the background increased with increasing gating window (Figure ).
The vessel edge gradients and the background noise varied, as expected, with the tracking factor (Figure ). The optimal tracking factor was 0.6 (between 0.3 and 0.7 for all volunteers).
The signal-to-noise ratio of the high-resolution scans were lower than for the other scans, but the image quality variation with gating window and tracking factor was similar.
Conclusions: The retrospective adaptive correction method, suggested by Wang [2] and used here, allows for the use of individual tracking factors without the need for a pre-scan. The motion blurring in navigator gated coronary angiographies increases with the width of the gating window. The optimal tracking factor is different from subject to subject, but a value of 0.6 is best on the average as also shown previously [3]. For this method to be complete, an automatic image quality detection method would be valuable. Different automatic procedures have been suggested and compared by e.g. McGee [4].
References
1. Kim WY, PG Danias, M Stuber, et al. N Engl J Med 345:1863–1869, 2001.
2. Wang Y, Ehman. RL JMRI 11:208–214, 2000.
3. Wang, Y., Grist, TM. Korosec, et al. MRM 33, 541–548, 1995
4. McGee, KP, Manduca A, Felmlee JP, Riederer, SJ, Ehman, RL. JMRI 11, 174–181, 2000
425. Parallel Acquisition Techniques in Cardiac Cine MRI Using SSFP Sequences—Assessment of Image Quality and Artifacts
Peter Hunold, M.D.,1 Stefan Maderwald,2 Mark E. Ladd, Ph.D.,1 Florian M. Vogt, M.D.,1 Jörg F. Debatin, M.D.,1 Jörg Barkhausen, M.D.1
Dept. for Diagnostic and Interventional Radiology, University Hospital, Essen, Germany, RF & Microwave Engineering Institute, Ruhr University, Bochum, Germany.
Introduction: Steady-state free precession sequences (SSFP) have been established for functional studies in Cardiac cine MRI. Recently developed Parallel Acquisition Techniques (PAT) accelerate imaging by skipping phase encoding steps. These time savings can be used to either shorten the acquisition time or improve the spatial or temporal resolution.
Purpose: To evaluate image quality, noise and artifacts of two different PAT reconstruction algorithms for a cine SSFP sequence and to compare it to the SSFP sequence without PAT as the standard of reference.
Methods: Cardiac MRI was performed in 8 CAD patients and 8 healthy young volunteers on a 1.5T scanner (Magnetom Sonata, Siemens, Erlangen, Germany). A segmented SSFP (TrueFISP) cine sequence (TR, 3.0 ms; TE, 1.5 ms; FA, 60°; matrix, 208×256; slice thickness, 8 mm) was acquired in horizontal and vertical long axis as well as short axis orientations without PAT (noPAT) as well as with two different PAT reconstruction algorithms (GRAPPA and mSENSE). Two elements of the conventional CP Spine array coil and two elements of a Body Flex array were used for signal reception. Both PAT methods used an auto-calibration mode with 30 reference lines. A PAT factor of two was used to reduce acquisition time while maintaining the same matrix, temporal and spatial resolution. To compare the different cine studies, overall image quality, image noise, and image artifacts were classified on a 4-point scale (1=very good quality; 4=poor quality) by an experienced radiologist, who was blinded to the scan parameters and the employed technique. Additionally, noise expressed as the standard deviation (SD) of signal intensity (SI) within the myocardium as well as signal-to-noise ratio were measured.
Results: PAT provided diagnostic image quality in all patients, foldover was avoided. With PAT acceleration factor 2, overall acquisition time was reduced by about 40% compared to noPAT. Subjectively comparing GRAPPA and mSENSE with the conventional technique, PAT provided poorer overall image quality than noPAT (mean quality score 2.4, 2.6, and 1.9, respectively). PAT images contained more noise (mean score 2.8, 2.8, and 2.0, respectively). The SNR was reduced by 27% and 40% when applying GRAPPA and mSENSE, respectively. mSENSE showed more artifacts than GRAPPA, whereas conventional TrueFISP did not show any reconstruction artifacts (mean quality score 1.8, 1.3, and 1.0).
Conclusions: By applying PAT for cardiac cine TrueFISP MRI, acquisition time can significantly be reduced while maintaining temporal and spatial resolution at the cost of artifacts and a decrease in SNR. However, both PAT reconstructions obtained diagnostic image quality using a conventional coil. The GRAPPA algorithm was more robust than mSENSE. Dedicated PAT coils will improve image quality (Figure ).
426. Two-Dimensional Bent Projection Reconstruction for Cardiac Imaging
Dana C. Peters,1 Elliot R. McVeigh.2
NHLBI, National Institutes of Health, Bethesda, MD, USA, National Institutes of Health, Bethesda, MD, USA.
Introduction: Bent projection reconstruction (PR) trajectories were recently introduced (1) for the true 3D PR (“cush ball”) trajectory (2). Bent PR employs full echoes, and increments the angle of the radial trajectory immediately after passing through the center of k-space, by a small angle, and uses the homodyne technique (1) to synthesize the missing data, thereby reducing artifacts.
Purpose: The bent PR method is employed in 2D steady state free precession (SSFP) and fast gradient echo cardiac imaging.
Methods: PR with SSFP contrast was employed on a General Electric CV/i 1.5 T system. Full echoes were collected at evenly spaced angles over 180 degrees. Typical scan parameters were: 160 Nr×64 Np, 32 cm FOV, 8 mm slice thickness, flip angle 60,+/− 62.5 kHz (8us/sample), TR=3.7 ms, an angular bend of 1.4 degrees, with bend positioned at kr=0.
Results: Figure shows a phantom using a) 64 Np with standard trajectory, b) 64 Np with bent trajectory and homodyne. The artifact is clearly reduced in (b). Figure shows axial diastolic images of the heart of a volunteer, with a) 64 Np, standard trajectory, and b) 64 Np, bent trajectory and homodyne. In the volunteer images, bent PR provides fewer artifacts in the left ventricular cavity, but some increased blur is observed, which requires further investigation.
Conclusions: 2D Bent PR is possible and reduces undersampling artifacts in phantoms and in vivo. This method will be investigated further for cardiac imaging and interventional MRI.
Reference
(1) Toropov, Y. V., Block, W. F. (2001). ISMRM p. 1809.
(2) Barger, A. V., et al. (2002). Magn. Reson. Med. 48:297–305.
427. Temporal Resolution Requirements for MRI Studies of Left Ventricular Function
Arkadios Roussakis, MD,1 Panagiotis Baras, Ph.D.,2 Ioannis Seimenis, Ph.D.,2 John Andreou, MD,1 Peter G. Danias, MD, Ph.D.1
Cardiac MRI Center, Hygeia Hospital, Maroussi, Greece, Philips Hellas, Holargos, Greece.
Introduction: For cine cardiac MRI studies of left ventricular (LV) systolic function, short breath-hold acquisitions are preferable and have broader patient acceptance. However, to decrease breath-hold duration, the number of cardiac phases per cardiac cycle has to be reduced, if the spatial resolution is to remain constant.
Purpose: We investigated the minimal requirements of temporal resolution (i.e. number of phases per cardiac cycle), to maintain accuracy for measurement of LV volumes, mass and EF with cine cardiac MRI.
Methods: Ten adult volunteers (7 men, age 26–67, mean 40 years) were included in this study. All underwent imaging with a 1.5T Philips Intera scanner and a 5-element synergy cardiac coil. All subjects were imaged supine. Five cine LV function scans with 20, 17, 14, 11 and 8 cardiac phases per cardiac cycle were obtained in random order. For all scans, we used a balanced fast-field echo (bFFE) multi-slice breath-hold sequence with two-fold parallel imaging (SENSE) acceleration (spatial resolution: 1.5×1.9 mm2, TE=1.96 ms, TR=3.9 ms). Contiguous short axis images (slice thickness 8 mm) were obtained to cover the LV and Simpson's rule was used to calculate LV volumes, mass and EF. The 20-phase acquisition was considered as the reference standard. For acquisitions with 17, 14, 11 and 8 phases, we calculated differences from the 20-phase acquisition for all parameters. One-way analysis of variance was used to assess inter-group differences and Fisher's LSD test was used for post-hoc comparisons.
Results: All subjects were imaged successfully. One subject was excluded from the analysis because she failed to sustain reproducible depth breath-holds, resulting in obvious misregistration of images. The scan duration per breath-hold, adjusted for a heart rate of 60 beats/min, ranged from 3.9 s (for the 8-phase acquisition) to 9.6 s (for the 20 phase acquisition). Differences (Delta) in end-diastolic (EDV) and end-systolic (ESV) volumes, mass and EF, with respect to the reference standard, are shown in the Figure . There were significant differences (p<0.05) in mean Delta EDV for the 8- and 11-phase acquisitions. There was also significant difference (p<0.05) in the mean Delta EF for the 8-phase acquisition. For 14- and 17-phase acquisitions the mean Delta values were not significant for any of the parameters studied.
Conclusions: Fourteen phases per cardiac cycle are adequate to maintain accuracy of measurement of LV volumes, mass and EF. Decreasing the temporal resolution beyond this cutoff may introduce significant error of measurement and should be avoided.
428. A Fast Multi-coil Multi-processor Reconstruction for Real-Time Diagnostic Cardiac Imaging
Ajit Shankaranarayanan, Ph.D.,1 Andres Carrillo, M.S.,1 Juan Santos,2 Bob Hu, M.D.,3 Graham Wright, Ph.D.,4 John Pauly, Ph.D.,5 Jean Brittain, Ph.D.6
Applied Science Laboratory, GE Medical Systems, Menlo Park, CA, USA, Electrical Engineering, Stanford University, Palo Alto, CA, USA, Palo Alto Medical Foundation, Palo Alto, CA, USA, University of Toronto, Sunnybrook, ON, Canada, Stanford University, Palo Alto, CA, USA, Applied Science Laboratory, GE Medical Systems, Meno Park, CA, USA.
Introduction: Recent work has explored the use of real-time imaging methods to acquire diagnostic cardiac images [1–3]. Real-time imaging of the heart obviates the need for cardiac or respiratory gating or other methods to deal with respiratory motion such as navigators and provides many important benefits including reduced imaging time, evaluation of dynamic physiologic changes, rapid imaging under conditions of true ischemic stress, and immunity to cardiac arrhythmia. However, real-time diagnostic imaging requires improved temporal and spatial resolution compared to methods developed for localization alone. For example, a real-time study to assess myocardial wall motion during dobutamine stress would require an effective frame-rate and spatial resolution on the order of 24 fps and 2 mm.
Current real-time implementations utilizing standard scanner hardware fall short of these requirements. Here we present a new multi-coil reconstruction system that combines an efficient and general gridding reconstruction [4] with the new, multi-processor EXCITE hardware (GE Medical Systems, Milwaukee, WI). This system achieves reconstruction rates that meet the needs of these demanding applications and provides a platform for the development of advanced real-time clinical applications.
Materials and Methods: Our new reconstruction system was implemented on a GE1.5T scanner with EXCITE hardware (GE Medical Systems, Milwaukee, WI). The configuration included EXCITE vector array processors with 2GB memory. A real-time spiral sequence was used to acquire the data (6 interleaves, 2048 points/interleaf, TR=30 ms, effective spatial resolution ∽2.5 mm, FOV=24 cm, slice thickness=5 mm). A phased-array cardiac coil was used to receive the MR signal.
The k-space trajectory was calculated during the scan preparation and sent to the new reconstruction. To reduce reconstruction time, the reconstruction calculated the k-space weights from the trajectory in advance and stored them for all the future reconstructions.
The raw data from each coil was allocated to a different array processor (Coil 1 data to AP1, Coil 2 to AP2, etc). The data were gridded onto a 128×128 matrix. A magnitude-squared combination of the resultant reconstructed images was then performed on one array processor and the reconstructed image was sent back for display. Timing of the individual components of the reconstruction was noted. For comparison, data from a single coil (5 inch surface coil) was reconstructed on one array processor and the timing noted.
Results: Figure shows an axial image of heart reconstructed with multi coil data. For a 128×128 image, the total reconstruction was approximately 30 ms per frame for the single coil case. The frame rate extrapolated from these reconstruction times was approximately 30fps. For the multi-coil data, the reconstruction time was approximately 38 ms per frame which when extrapolated was approximately 25fps.
Discussion and Conclusion: The efficiency of cardiac exams can be greatly increased by diagnostic real-time imaging tools. Preparation time associated with cardiac gating is eliminated as is any time coaching for and recovering from breath-holds. In addition, real-time imaging tools allow the operator to interactively adjust imaging parameters and locations to maximize the diagnostic image quality.
As can be seen from the results, this reconstruction system allows us to provide multi-coil reconstruction at a frame rate and resolution that enables diagnostic quality imaging in real-time. Therefore, in conclusion, this reconstruction system provides the framework for the development of an integrated suite of real-time, diagnostic cardiac applications.
Figure 1. An axial image of heart reconstructed from a multi coil data. The imaging parameters were 6 interleaves, 2048 points/interleaf, TR=30 ms, effective spatial resolution ∽2.5 mm, FOV=24 cm, slice thickness=5 mm.
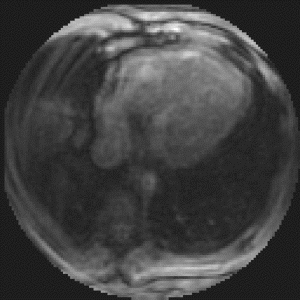
References
[1] Nayak, et al. (2000). Mag. Res. Med. 43:251–258.
[2] Nayak, et al. (2001). Mag. Res. Med. 46:430–435.
[3] Kaji, et al. (2001). J. Am. Coll. Cardiol. 38:527–533.
[4] Santos, et al. (2002). ISMRM 738.
429. Effective Procedural Sedation for Prolonged Complex Pediatric Cardiac MRI
Rodney G. Shaffer, M.D.,1 Khan M. Siddiqui, M.D.,1 Cathleen A. Woomert, M.D.,1 Frederick K. Emge, M.D.2
Radiology, Geisinger Medical Center, Danville, PA, USA, Pediatric Cardiology, Geisinger Medical Center, Danville, PA, USA.
Introduction: Cardiac magnetic resonance imaging (C-MRI) is increasingly being utilized to evaluate pediatric congenital and acquired cardiovascular diseases. The problem that arises is the scan time required to acquire diagnostic quality images in a patient who must be able to tolerate complete immobility and follow breathing instructions. This is difficult for a child who either may not be able to understand because of developmental age or is not able to tolerate immobility for a prolonged period. Some facilities are currently utilizing general anesthesia to overcome these limitations.
Purpose: Our hypothesis is that the sedation protocol we are currently using at our facility is providing successful sedation for prolonged pediatric C-MRI without the need for general anesthesia.
Methods: This is a retrospective study reviewing 117 records of patients that underwent prolonged C-MRI, from August 2001 through July 2002, to determine the success rate of the pediatric procedural sedation protocol at our facility. Prolonged scan was defined as a scan over 45 minutes in duration. Sedation was defined as successful, if the study was completed and adequate quality images were obtained. All studies were interpreted in joint collaboration with the cardiologist and radiologist to determine the diagnosis. A radiology nurse and pediatric intensive care or pediatric cardiology physician supervised the patients' sedation and complications were documented.
Results: Seventy-three (62.4%) patients (age range: 1 day–17 years; mean 9 years) of the 117 patients received procedural sedation. The protocol included Chloral Hydrate (primarily), Midazolam and Ketamine in conjunction or alone. Seventy-two (98.6%) patients had successful sedation without complications and one had unsuccessful sedation for which the scan was aborted. There were no complications or unexpected in-hospital admissions reported. Scan time ranged from approximately 45 minutes to 90 minutes.
Conclusion: The procedural sedation protocol at our facility has proven to be very successful in prolonged pediatric C-MRI. Diagnostic quality cardiovascular imaging can be performed successfully without the need of general anesthesia. Procedural sedation is safe for children undergoing prolonged MRI and should be considered in place of generalized anesthesia.
430. Myocardial Perfusion Reserve Using a Novel Dual Acquisition Cardiovascular Magnetic Resonance Sequence
Andrew G. Elkington,1 Peter D. Gatehoouse,2 Nick Ablitt,3 David Firmin,2 Guang Zhong Yang,4 Dudley J. Pennell5
CMR Unit, Royal Brompton Hospital, London, United Kingdom, CMR Unit, Royal Brompton Hospital and Imperial College, London, United Kingdom, Visual Imaging Processing Group, Department of Computing, Imperial College, London, United Kingdom, Visual Image Processing Group, Department of Computing, Imperial College, London, United Kingdom, CMR Unit, Royal Brompton Hospital, London, United Kingdom.
Introduction: Quantitative perfusion CMR requires an accurate input function from the 1st pass of the gadolinium bolus. For clinical visualization of perfusion defects, a high dose (typically 0.1 mmol/kg) of gadolinium is used. The potential problem associated with the use of high dose gadolinium is that the input function can be significantly attenuated. Previous work has validated quantitative perfusion CMR using a ‘double bolus’ technique, with a low 1st bolus for the input function (0.01 mmol/kg), and a high 2nd bolus for the myocardial response (0.1 mmol/kg).
Purpose: In this study we compared the myocardial perfusion reserve (MPR) calculated from this dual bolus technique with the standard clinical dose, and also a novel technique recently described by Gatehouse et al which uses the standard high dose bolus (0.1 mmol/kg) but derives the input function from a novel dual acquisition sequence with a fast low resolution-low sensitivity scan of the LV blood pool signal which is acquired on the R-wave for each cardiac cycle during the perfusion scan.
Methods: 16 perfusion CMR studies were performed on patients with significant coronary artery disease. Quantitative perfusion analysis was performed on the subendocardium and subepicardium in two regions—myocardium subtended by a significant stenosis and a region of remote myocardium.
Results: The mean MPR measured by the dual bolus technique was 2.3±1.0. The difference in MPR between the dual bolus technique and the high dose technique was significantly greater than by the dual acquisition technique (difference +1.3 vs −0.4, P<10-4).
Conclusions: Quantification of MPR using a standard clinical visualisation dose of 0.1 mmol/kg gadolinium leads to significant overestimation of MPR. The novel dual acquisition perfusion sequence gives significantly more accurate results.
431. An Efficient and Unsupervised Deformable Model for Segmentation and Approximation of Contours in Cardiac Imagery
Tarek A. El Doker, David R. Scott
Department of Electrical Engineering, Northern Arizona University, Flagstaff, AZ, USA.
Introduction: The fast proliferation of medical imaging technologies is revolutionizing medicine. Applications in medical imaging often require the extraction of salient properties from images of anatomic structures like the heart. Due to the complexity and variability of such shapes, automatic segmentation and representation of anatomic structures is a major challenge. While this problem has been thoroughly researched before, namely, in the field of active contours (snakes), most snake models suffer from a number of drawbacks including the need for a priori knowledge and user supervision, range, myopia etc. This paper presents a deformable model algorithm that is an alternative to snakes in a more computationally efficient and completely unsupervised manner. Furthermore, unlike snake models that are used to characterize contours of the heart and other anatomic structures, the algorithm suggested here can even estimate and approximate contours of interest internal to the structure's primary contour. No order of parameterization is needed for this algorithm.
Purpose: The goal is to develop a deformable model algorithm that would allow for proper segmentation of heart images and proper approximation of the extracted contours with second-order B-Splines. The approximation process has to be efficient in both the computation of the contour and in the subsequent representation using a set of control points. It also has to ensure global smoothness (first-derivative continuity everywhere).
Method: The algorithm first extracts the target contour from the image. The target contour is defined as a closed comprehensive representation of the contour of the heart. It then computes the local maxima of the target contour. The set of maxima is next minimized for efficient representation. Finally, the control point set is computed and the second-order B-Spline approximation is generated.
1. Image Segmentation and Target Contour Extraction: The image is segmented using a Canny edge detector. The target contour is extracted from the image. Thresholding for edge detection pauses a challenge. This is overcome by an adaptive procedure that works within known predetermined upper and lower thresholds for Canny edge detection. The thresholds are optimal for best segmentation of the contour. In this step, other candidate contours may be attained. These contours are discarded by a process of error minimization in which the candidate contour(s) are subtracted from an original heart contour stored in memory, after being scaled to dimension. The contour with the minimal error is then chosen to be the target contour.
2. Geometrical Properties Extraction: The local maxima of the contour are extracted by first computing the inflection points and then subdividing the contour into any number of segments by the points of inflection. For every segment created by two inflection points, the local maxima is the pixel along that part of the contour with the greatest normal distance from the line adjoining the two inflection points.
3. Reduction of Maxima: For best results, the set of maxima can be reduced. The reduction distance is the Euclidean between the maxima pixels, defined a priori. If two neighboring maxima pixels are within the reduction distance, the maxima that is in the positive direction of the slope of the contour is chosen and the other maxima is discarded. If more than two adjacent maxima pixels are within the reduction distance, the middle pixel is chosen.
4. B-Spline Approximation: After attaining the reduced maxima set, the control point set to be used in the generation of the approximation curve is computed. From [1], the maxima of a second-order B-Spline segment can be given by:Where M is the maxima set,
and C the control point set,
and R is full-rank Toeplitz constructed from the maxima coefficients of the Second-Order B-Spline equations:
5. Contour Generation and Iteration for Error Correction: After attaining the control point set, the second-order B-Spline curve is generated. If the approximation does not satisfy the error criterion specified (pixel by pixel subtraction, tolerance band etc.), a new smaller reduction distance criterion is chosen and the steps are repeated. This is iterated until satisfactory results are obtained.
Analysis: The order of complexity of this algorithm is O (nlog n) where n is the length of the reduced maxima set. This is significantly more efficient than other active contour models, which range in complexity from O (n2) to many orders of magnitude in complexity. Furthermore, the approximation is rotationally invariant. Various mathematical operations can be done on the control point set instead of the original contour, saving even further computational complexity. By specifying other contours contained within the original target contour, additional segmentation and representation of heart imagery can be achieved such as the extraction of left ventricle (LV) contour for diagnosis purposes. The accuracy of this algorithm is very similar to that of snake models.
Results: Figure is an axial MRI image of the lungs with the heart contained in a rectangular region of interest. Figure represents the adaptive segmentation process and the target contour is the largest boundary of pixels contained within the target area. The target contour is found to be 160 pixels. Segmentation is iterated twice to obtain the target contour. This is implemented in Matlab using a Canny edge detector with a lower threshold of .15 and an upper threshold of .2. The inflection points are calculated and the set of maxima pixels is attained. Next, the maxima pixel set is reduced and Eq. (1) is used to calculate the control point set. The control point set is found to be 16 pixels. Figure shows the second-order B-Spline approximation contour generated by the control point set. No further iteration is required since the approximation process satisfies the predetermined error criterion (in this case, the pixel by pixel difference between the approximation contour and the target contour).
Experimentation has been done on an extensive number of images and the results reflect the robustness and efficiency of the algorithm. Typically, one or two iterations were enough to identify a target contour.
Less than 5% of the cases had an approximation violation, where further iteration is needed. On average, a heart contour of 200 to 1000 pixels requires less than 20 control points for the successful generation of an approximation contour.
Conclusion: A novel deformable model algorithm is developed for segmentation and approximation of contours in cardiac images. The algorithm is efficient and robust. Furthermore, it does not require a priori knowledge of the contour properties. Unlike other active contour methods, the algorithm itself determines the order of parameterization, eliminating user interaction in determining the number of control points sufficient to represent the contour. This algorithm can be used for the efficient storage and retrieval of heart images. It also has applications in tracking motion in cardiac imagery, along with further segmentation of such images, like the segmentation of the left ventricle.
Figure 3. The final approximation of the target contour. Control point set=16 pixels. Control points are shown as white dots. Final approximation is in solid white, and the extracted edges are in dotted white.
References
[1] T. A. El Doker, P. A. Mlsna, “Efficient Unsupervised Estimation of Second-Order B-Spline Contour Descriptors,” Invited paper, Proc. of IEEE Midwest Symposium on Circuits and Systems (MWSCAS-02), Tulsa, OK, Aug. 4–7, 2002.
[2] M.A.T. Figueiredo, J.M.N. Leitao and A.K. Jain, “Unsupervised Contour Representation and Estimation Using B-splines and a Minimum Description Length Criterion.' Proc. IEEE Trans on Image Processing, Vol. 9, No. 6.June 2000.
[3] T. McInerney and D. Terzopoulos, “Deformable Models in Medical Image Analysis: A Survey”, Medical Image Analysis, Volume 1, Number 2, 1996, pages 91-108.
[4] A. Gupta, L. von Kurowski, A. Singh, D. Geiger, C.C. Liang, M.Y. Chiu, L.P. Adler, M. Haacke, and D.L. Wilson “Cardiac MR Image Segmentation Using Deformable Models“ Proc. of the IEEE Computers in Cardiology Conference,, 1993, pages 747–750.
[5] A. Gupta, T. O'Donnell, A. Singh, “Segmentation and Tracking of Cine Cardiac MR and CT Images Using a 3-D Deformable Model,” Proc. IEEE Conference on Computers and Cardiology, 1994, pages 661–664.
432. Magnetic Resonance Safety Tecting of a Newly-Developed Fiber-Optic Cardiac Pacing Lead
Jeffrey L. Helfer
Biophan Technologies, Inc., W. Henrietta, NY, USA.
Introduction: Results of Magnetic Resonance safety Testing of a Newly-Developed Fiber-Optic Cardiac Pacing Lead
Purpose: To assess magnetic resonance (MR) safety for a newly developed, fiber-optic cardiac pacing lead.
Methods: MR safety was assessed for the fiber-optic cardiac pacing lead by evaluating magnetic field interactions and heating. Translation attraction and torque were evaluated using a 1.5-Tesla MR system and previously described, standardized techniques. MR image-related heating was assessed using a 1.5-Tesla MR system and a transmit/receive, body radiofrequency (RF) coil with the fiber-optic lead positioned to simulate an in vivo condition in a saline-filled phantom. The phantom had dimensions simular to humans subject's torso and head. A fluoroptic thermometry system was used to record temperatures on and near the electrodes of the fiber-optic pacing lead at five-second intervals immediately before and during 20 minutes of MR imaging performed at a whole-body-averaged specific absorption rate (SAR) of 1.5 W/kg. Temperatures were also recorded fro a reference site during this experiment.
Results: Magnetic field interactions for the fiber-optic lead were minimal (deflection angle, 23 degrees; torque, +2). The highest temperature change recorded for the fiber-optic cardiac pacing lead and reference site was +0.8°C.
Conclusions: The minor magnetic field interactions and relative lack of heating for the fiber-optic pacing lead indicate that it should be safe for patients with this device to undergo MR imaging procedures using MR systems operating at 1.5-T or less and at a whole-body-averaged SARs up to 1.5 W/kg.
433. Use Of Ssfp In Realtime Mri Improves Snr, Cnr, And Wall Motion Assessment
Jan E. Engvall,1 Girish Narayan, MD,2 Patricia Nguyen, MD,2 Krishna Nayak, Ph.D.,3 Phillip Yang, MD,2 Bob Hu, MD.2
Clinical Physiology, Linkoping University, Linkoping, Sweden, Cardiology, Stanford University, Stanford, CA, USA, Electrical Engineering, Stanford University, Stanford, CA, USA.
Introduction: Steady State Free Precession (SSFP) techniques improve MRI image quality. The application of SSFP compared to gradient echo (GRE) in real-time MRI is expected to improve on SNR, CNR and wall motion assessment.
Purpose: To compare a triggered SSFP technique with a real-time GRE technique for the assessment of SNR, CNR and wall motion in patients with CHF and in healthy volunteers (only SNR/CNR calculations).
Methods: 10 patients with a clinical history of CHF and 5 healthy volunteers underwent MR scans of the heart in the short axis, vertical long-axis and 4 chamber views. The 1.5T scanner utilizes a validated real-time GRE technique as well as the new SSFP technique. The real-time GRE technique employed TE 4.6 ms, TR 30 ms, flip angle 30 degrees, slice thickness 5 mm with 5 mm inter-slice gap and FOV 20 cm. The inplane spatial resolution was 1.9 mm with a temporal resolution of 116 ms reconstructed at a frame rate of 16 fps. In the short-axis orientation, the heart was scanned from the base to the apex, with manual transition from slice to slice. Patients were asked to take shallow breaths to prevent misregistration of slices. In the apical views, only one slice was recorded. The SSFP technique was characterized by TR 5.9 ms, flip angle 90 degrees, slice thickness 7 mm with 3 mm inter-slice gap, FOV 20 cm. The inplane spatial resolution was 1.9 mm at a temporal resolution of 120 ms reconstructed at frame rate of 16 fps. Slices were automatically advanced after each cardiac cycle based on a pulse oximetry trigger. Patients were asked to hold their breath during the acquisition. SNR and CNR were calculated off-line using NIH Image. Wall motion was assessed using the proposed AHA 17 segment model. For statistical comparison, Student's t-test was employed.
Results: SSFP showed higher SNR (20.3 vs 15.8) and CNR (10.8 vs 6.3) than GRE, p<0.05 for both comparisons. The true apex of the left ventricle was better displayed with SSFP compared to GRE (Table ).
Conclusion: Compared to realtime GRE, SSFP incorporated in realtime MRI improves image quality allowing a better display of the true apex of the left ventricle. SNR and CNR are significantly improved.
