101. Improved Regional Function After Stem Cell Treatment in the Canine Chronic Infarct Model
Robert P. Gallegos, MD,1 Xiaoen Wang, MD,2 Avinash Jayaswal, MS,3 Eric Rahrmann, BS,3 Richard Jones,3 Zachary Kastenberg,3 Jennifer Gravelle,3 Xunhai “James” Xu, BS,1 Christina Clarkson, DVM, PhD,3 Cory Swingen, MS2, Ravi Teja Seethamraju, PhD,2 Nael F. Osman, PhD,4 Richard W. Bianco, BS,5 Timothy D. O'Brien, DVM, PhD,3 Catherine M. Verfaillie, MD,3 R. Morton Bolman, III, MD,1 Michael Jerosch‐Herold, PhD.2 1Surgery, University of Minnesota, Minneapolis, MN, USA, 2Radiology, University of Minnesota, Minneapolis, MN, USA, 3Stem Cell Institute, University of Minnesota, Minneapolis, MN, USA, 4School of Medicine, Johns Hopkins University, Baltimore, MD, USA, 5Experimental Surgical Services, University of Minnesota, Minneapolis, MN, USA.
Introduction: Bone marrow (BM) derived stem cells have been investigated as a potential source for cell mediated ischemic myocardial therapy. Most investigators have evaluated the effect of stem cells on acute ischemic myocardium.
Purpose: We report improved regional myocardial following treatment of chronic myocardial ischemia with bone marrow stem cells (BSCs), adherent cell cells isolated from canine BM and grown in MAPC culture conditions, using a newly developed canine model.
Methods: Canines (n = 10) underwent surgical intervention for LAD ligation and bone marrow aspiration. BSC isolation and expansion was completed using protocols developed previously for isolation of human Multipotent Adult Progenitor Cells (MAPCs). In vitro characterization studies illustrated that BSCs were CD45, CD44 + and DLA‐I +, and that the BSCs were capable of differentiating into a variety of cell types (cartilage, adipocyte, endothelial, skeletal and smooth muscle). BSCs were labeled by transduction with a GFP retroviral vector, and cytogentic assessment completed just prior to myocardial injection revealed no chromosomal abnormalities. Myocardial injection of autologous GFP labeled BSCs (n = 5) or stem cell free culture media in controls (n = 5) was performed 4 weeks after the induction of a myocardial infarct to model the treatment of chronic ischemia. A 1.5‐Tesla MRI scanner was used for tagged and contrast enhanced imaging at baseline infarct state, with follow‐up at 2 and 4 months following myocardial injection. The LV infarction size, measured by delayed contrast enhancement, was not significantly different between groups at baseline (8.56% ± 4.59% Exp.; 6.74% ± 2.66% Con.). 2D myocardial strain assessment was completed for all time points using HARmonic Phase (HARP) image analysis. All animals reached the end time points of the protocol; all hearts were explanted for pathologic evaluation at termination of the study.
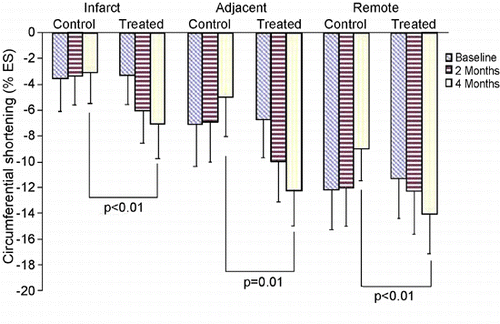
Results: No early death or tumor formation was noted in any animal undergoing stem cell injection. Whole heart frozen sectioning, completed on a large sliding cryotome, provided thin sections for DNA isolation. A primer‐probe set designed against GFP was used with Q‐PCR and revealed 6–18% stem cell engraftment. Studies are ongoing to characterize the phenotype of the GFP positive cells present in the tissue specimens. MRI strain analysis demonstrates a significant (p < 0.05) improvement in local myocardial force production in the BSC treated group. Mean circumferential shortening in remote (no infarct), infarct, or peri‐infarct regions are reported by group (see Figure ). Regional myocardial strain comparison reveals significant sustained long‐term improvement in regional function following BSC therapy in the chronic canine myocardial ischemia model.
Figure 1. (View this art in color at www.dekker.com.)
Conclusions: BSCs can be isolated from the bone marrow of the dog using techniques developed for human MAPC isolation. Engraftment following direct myocardial injection of MAPC like stem cells results in improvement in myocardial function following cellular therapy in a this large animal chronic myocardial infarct model. Finally, we conclude that MRI is particularly suited for evaluation of cellular based myocardial therapies.
102. Myocardial MRI in Sarcoidosis: 3‐Years Follow‐Up and Evaluation of the Effects of Steroid Therapy
Olivier Vignaux, MD, PhD,1 Robin Dhote, MD,2 Phillipe Blanche,2 Daniel Dusser, MD,3 Denis Duboc, MD,4 Paul Legmann, MD.1 1Radiology, Cochin Hospital, Paris, France, 2Internal medicine, Cochin Hospital, Paris, France, 3Pneumology, Cochin Hospital, Paris, France, 4Cardiology, Cochin Hospital, Paris, France.
Introduction: Cardiac involvement is symptomatic in only 5% of patients with sarcoidosis, although it is present in the myocardium at autopsy in 20 to 50% of patients, while sudden death due to ventricular tachyarrhythmias or conduction block accounts for 30–65% of deaths due to sarcoidosis.
Purpose: To follow‐up myocardial magnetic resonance imaging (MRI) abnormalities in patients with sarcoidosis.
Methods: One hundred and six patients with histologically‐proven sarcoidosis underwent prospectively cardiac assessment including cardiac MRI (T2‐weighted, functional gradient echo and Gadolinium‐DTPA‐enhanced early and delayed sequences). MRI follow‐up at 6, 12, 24 and 36 months was available respectively in 61, 45, 22 and 11 patients with initial reversible perfusion defects on thallium‐201 scintigraphy and MRI abnormalities consistent with cardiac involvement. Clinical and MRI follow‐up were scored by two observers.
Results: Thirty‐two patients receiving corticosteroids were scored as having regressed or improved at the MRI follow‐up. Regression of myocardial gadolinium‐DTPA enhancement is noticed early (32/32 at 6‐months) while regression of increased signal intensity on T2‐weighted images is delayed (14/32 at 6‐months, 28/32 at 12‐months, 32/32 at 24‐ and 36‐months). Initial myocardial delayed enhancement in 18 of these patients was often predictive of scar tissue with myocardial thinning (3/18 at 6‐months, 9/18 at 12‐months, 16/18 at 24‐ and 36‐months), associated with segmental contraction abnormality in 61%. Twenty‐two patients not receiving corticosteroids were scored as remained stable (9/22) or having worsened (13/22) and MRI findings were predictive of symptomatic cardiac involvement in 9 of these patients (41%).
Conclusions: Cardiac MRI should be used widely in patients with sarcoidosis since MRI findings provide clinically relevant data which might modify the management and prognosis of such patients.
103. Non‐invasive Detection of Myocardial Fibrosis in Arrhythmogenic Right Ventricular Dysplasia by Delayed‐Enhancement Magnetic Resonance Imaging—Correlation with Histopathology
Harikrishna Tandri, Claudia Martinez, MD, Manoj Saranathan, MS, Chandra Bomma, MD, Ernesto Castillo, MD, Khurram Nasir, MD, Hugh Calkins, MD, Rene Rodriguez, MD, Joao A. C. Lima, MD, David A. Bluemke, MD, Ph.D. Medicine, The Johns Hopkins University School of Medicine, Baltimore, MD, USA.
Introduction: Arrhythmogenic right ventricular cardiomyopathy/dysplasia (ARVC/D) is characterized by structural and functional abnormalities of the right ventricle (RV) leading to ventricular arrhythmias and progressive RV failure. The most striking morphological feature of ARVC/D is segmental lack of myocardium in the RV free wall, which is replaced by fibrofatty tissue. Endomyocardial biopsy has the potential for in vivo demonstration of fibrofatty replacement of the RV myocardium. However, sensitivity of this test is low because, for reasons of safety, samples are usually taken from septum, a region uncommonly involved by the disease. Moreover the test is invasive and carries a risk of perforation and tamponade. Gadolinium‐DTPA myocardial delayed‐enhancement (MDE) magnetic resonance imaging has been shown to accurately identify regions of myocardial fibrosis.
Purpose: The purpose of our study was to evaluate the role of MDE‐MRI in non‐invasive detection of fibrosis in patients being evaluated for ARVC/D and to correlate it with histopathology.
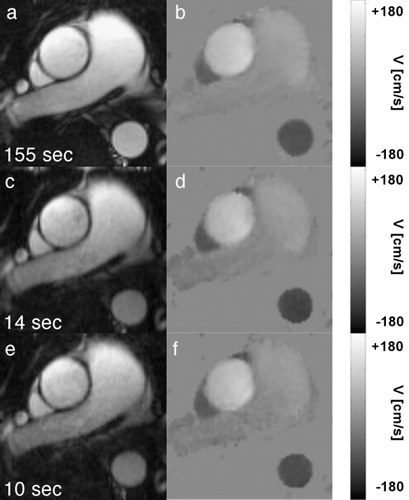
Methods: The study population included 25 consecutive patients who were prospectively evaluated for possible ARVC/D. Each of these patients was evaluated non‐invasively with an ECG, signal‐averaged ECG, and 2‐D echocardiography. Invasive testing including electrophysiologic testing, right ventriculography and endomyocardial biopsy was performed when clinically indicated. All patients underwent MR examination with a 1.5‐T MR imager (CV/i; General Electric Medical Systems, Waukesha, WI) using a dedicated cardiac coil. The protocol included steady‐state free‐precession gradient‐echo short‐axis and axial images (TR/TE, 3.5/1.4; slice thickness, 8 mm; number of excitations, 1; matrix, 220 × 160; and field of view, 380 × 285 mm) and double inversion recovery fast spin‐echo axial and short‐axis images (1–2 RR intervals/31.4; slice thickness, 5 mm; number of excitations, 1; field of view, 360 × 270 mm; and matrix, 256 × 224). After IV administration of contrast material (0.2 mmol/kg of gadopentate dimeglumine), inversion recovery prepared breath‐hold cine gradient‐echo images (7.2/3.2; inversion time (median), 200 msec; flip angle, 25°; slice thickness, 10 mm; number of excitations, 2; matrix, 256 × 192; and field of view, 360 × 270 mm) were obtained in the axial, short‐axis and the four‐chamber view 10 min after gadolinium injection. Diagnosis of ARVC/D was made blinded to the MR data, and based upon the Task Force criteria.
Results: The mean age of the study population was 35 ± 14 and 70% (17) were female. Based on the weight of clinical evidence 9 (36%) of the 25 patients met the Task Force criteria and were diagnosed with ARVC/D. Five of the 9 ARVC/D patients (55%) demonstrated delayed enhancement with MDE‐MRI compared to none (0%) of the 16 patients without the diagnosis (P < 0.001).
The same area also showed dyskinesis in all the five patients. The area of delayed enhancement was in the anterior wall below the tricuspid inflow, and extended into the RV outflow tract in three of the five patients. Endomyocardial biopsy was performed in 13 (52%) of the 25 patients. Four of the nine (44%) ARVC/D had fibro‐fatty changes and all of them had delayed hyperenhancement on MDE‐MRI. Three ARVC/D patients had normal endomyocardial biopsies and none of them showed delayed hyperenhancement. The remaining two refused biopsy. There was 100% correlation between presence of fibrosis on histopathology and delayed enhancement on MR imaging in patients with ARVC/D. None of the patients without the diagnosis of ARVC/D showed delayed enhancement (Fig. ).
Figure 1.
Conclusions: Non‐invasive detection of RV myocardial fibrosis in ARVC/D is possible by MDE‐MRI. More importantly, MDE showed an excellent correlation with histopathology and may have a role in evaluation and diagnosis of patients with suspected ARVC/D.
104. High Resolution Magnetic Resonance Imaging Demonstrates Impaired Brachial Artery Reactivity as Well as Reduced Aortic and Carotid Distensibility in Young Smokers
Frank Wiesmann, Steffen E. Petersen, Jane M. Francis, Matthew D. Robson, Paul M. Leeson, Robin Choudhury, Keith Channon, Stefan Neubauer. Department of Cardiovascular Medicine, University of Oxford, Oxford, United Kingdom.
Background: Cigarette smoking is a known cause for endothelial dysfunction, reflected by impaired brachial artery reactivity to hyperemia. However, previous methods of non‐invasively investigating endothelial function such as venous occlusion plethysmography and brachial artery ultrasound have been hampered by limited accuracy and reproducibility. High‐resolution magnetic resonance imaging bears the potential to quantify vascular function highly accurately and reproducibly. Furthermore, MRI allows to assess vascular function at different sites within the vascular tree and to simultaneously acquire information on vessel structure, distensibility and flow within one examination.
Purpose: To test the hypothesis that smoking not only induces peripheral endothelial dysfunction but also alters function and flow dynamics of the great arteries.
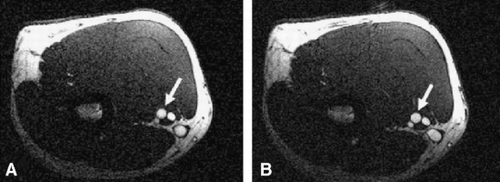
Methods: 20 healthy young volunteers (mean age 30 ± 2 y; 12 non‐smokers (NS), 8 smokers (S): average daily cigarette consumption 9.4 ± 2.6/day, cumulative nicotine consumption 8.4 ± 3.1 pack‐years) were studied. Both groups were matched for age, height and body weight. Non‐invasive high‐resolution cine MRI at 1.5 T (Siemens Sonata, Erlangen, Germany) was performed for assessment of vascular compliance of the aorta and common carotid arteries using a TruFISP sequence. Imaging parameters for aortic and carotid imaging were TR/TE 42 ms/1.4 ms, FOVread 380 mm, in‐plane resolution 1.97 × 1.97 mm2, SLT 7 mm, and TR/TE 45.3 ms/2.4 ms, FOVread 200 mm, in‐plane resolution 520 × 520 µm2, SLT 3 mm, respectively. Flow‐mediated dilatation (FMD) was evaluated by MRI‐measured BRA relative cross‐sectional area increase after forearm cuff occlusion (FOVread 117 mm, in‐plane resolution 300 × 300 µm2, SLT 3 mm) (Figure ).
Figure 1. Cross‐sectional MR image through right ellbow perpendicular to brachial artery (arrows) acquired at A) baseline and B) at maximal reactive hyperemia post cuff release.
Results: Smokers and non‐smokers showed no difference in heart rate and systolic or diastolic blood pressure. As expected, smokers showed a significant reduction in FMD (cross‐sectional area change 7.5 ± 2.7% vs. non‐smokers 14.9 ± 1.8%, p = 0.03), indicating impairment of endothelium‐dependant relaxation. Brachial arterial response to sublingual GTN (400 µg) was identical in both groups. The reduced FMD in smokers was accompanied by a marked decrease in vascular compliance in the common carotid arteries (3.69 ± 0.60 10− 3 mmHg− 1 vs. NS 6.80 ± 1.00 10− 3 mmHg− 1, p = 0.02) and at various sites of the descending aorta (DA) (thoracic DA 5.79 ± 0.55 10− 3 mmHg− 1 vs. non‐smokers 7.56 ± 0.38 10− 3 mmHg− 1, p = 0.01; abdominal DA 7.81 ± 0.91 10− 3 mmHg− 1 vs. non‐smokers 10.52 ± 0.54 10− 3 mmHg− 1, p = 0.02), suggesting a significant role of the endothelium for central vascular distensibility. Aortic mean and peak flow velocities as well as blood volume flow in the ascending aorta were similar between smokers and non‐smokers. Pulse wave velocity in smokers was unchanged both in the aortic arch (p = 0.26 vs. non‐smokers) and in the descending aorta (p = 0.71 vs. non‐smokers).
Conclusion: Cigarette smoking in young and otherwise healthy volunteers not only results in reduction of hyperemia‐induced brachial artery reactivity but also in significant impairment of carotid and aortic compliance. Non‐invasive MRI allows for detailed characterization of vascular function and can give new insights into the role of the endothelium in regulating peripheral and central vascular function.
105. A Novel Method of Estimating Pulmonary Vascular Resistance Utilizing Invasive Pressure Monitoring and MR Flow Data with XMR
Vivek Muthurangu, MBChB (hons), Andrew Taylor, MD, Marc Eric Miquel, PhD, Rado Andriantsimiavona, MSc, Robert Tulloh, DM, Derek Hill, PhD, Reza Razavi, MBBS. Division of Imaging, King's College London, London, United Kingdom.
Introduction: Pulmonary hypertension is assessed by invasive measurement of pulmonary vascular resistance (PVR). The Fick principle, used to measure pulmonary blood flow, has limitations, particularly in patients with congenital heart disease. Phase contrast magnetic resonance (MR) has been shown to provide accurate quantification of blood flow. We have set up a programme of MR guided diagnostic cardiac catheterisation, which allows simultaneous acquisition of invasive pressures and MR flow data and thus calculation of PVR.
Purpose: To demonstrate the feasibility of this new technique, and compare PVR calculated using MR and using the traditional Fick technique.
Methods: 20 patients underwent cardiac catheterization, in an MR interventional suite (1 · 5 T Intera I/T MRI scanner, Philips, The Netherlands) with x‐ray back‐up (BV Pulsera cardiac x‐ray unit, Philips, Best, The Netherlands). This allowed simultaneous acquisition of MR flow data and invasive pressure measurements and thus calculation of PVR. In 15 patients data was acquired at baseline (condition 1) at 20 ppm nitric oxide (condition 2) and at 20 ppm nitric oxide + 100% oxygen (condition 3). In 10 of these patients Fick and MR quantification of pulmonary blood flow was carried out allowing comparison of these methods. A distensible flow phantom was used to validate phase contrast MR. X‐ray dose was recorded in all study subjects and compared to x‐ray dose in age and procedure matched controls who underwent treatment in our traditional catheterization laboratory.
Results: Simultaneous pressure and flow data were obtained in all 20 patients. In 7 patients catheterization of the pulmonary artery was achieved under MR guidance alone. The median baseline PVR for all 20 patients calculated using phase contrast MR flow data was 3.2 WU.m2. In the 15 patients in whom the response to vasodilators was assessed the baseline PVR was 3.3 WU.m2. At condition 2, the median PVR fell to 3.1 WU.m2 and at condition 3 the median PVR fell to 3.0 WU.m2.
The correlation coefficient between flow quantified using phase contrast MR and using a graduated cylinder and stopwatch method was 0.99. The bias was negligible (− 0.02 l/min), an upper level of agreement was 0.26 l/min and a lower level of agreement was − 0.30 l/min.
In the 10 patients in whom Fick and MR were compared the correlation coefficient was 0.98 and Bland Altman analysis revealed a bias of 2.3%, and limits of agreement of 45.1% to − 46.7% at condition 1. At condition 2 there was poorer agreement (bias was 2.7%, and the limits of agreement were 77.3 to − 71.9%) and correlation (r = 0.92). At condition 3 there was very poor agreement (bias was 34% and the limits of agreement were 129.9% to − 60.6%) and only moderate correlation (r = 0.83).
There was a significant difference (p > 0.05) between the mean x‐ray dose received by patients undergoing XMR guided cardiac catheterization (median 0.67 Gycm2,) and control subjects (median 27.3 Gycm2).
Conclusion: We have demonstrated the feasibility of using simultaneous invasive pressure measurements and MR flow data to measure PVR in humans. The results suggest that this technique is more accurate than invasive oximetry and has the benefit of reduced x‐ray exposure. In 7 patients, catheterisation was done wholly under MR guidance. Before cardiac catheterization can be performed entirely under MR guidance in all cases, improved catheter visualization and the provision of MR compatible guide wires is required. Once these are addressed, these procedures could be carried out in a standard MR suite. Furthermore new velocity encoded imaging techniques will increase the speed and accuracy of this method. We plan to show the benefits of this technique in a larger group of patients. This should make MR guidance the method of choice for invasive PVR quantification.
106. Oxidative and Non‐oxidative Myocardial Energy Metabolism During Low Flow Ischemia Measured by Carbon‐13 and Proton NMR Spectroscopy
Steven G. Lloyd, MD, PhD,1 PeiPei Wang, MD, PhD,1 Huadong Zeng, PhD,2 John C. Chatham, D.Phil,3 1Medicine‐Cardiovascular Disease, University of Alabama at Birmingham, Birmingham, AL, USA, 2Comprehensive Cancer Center, University of Alabama at Birmingham, Birmingham, AL, USA, 3Medicine‐Cardiovascular Disease, Physiology and Biophyics, University of Alabama at Birmingham, Birmingham, AL, USA.
There is emerging evidence that pharmacologic modulation of cardiac energy metabolism is beneficial during myocardial ischemia or infarction. Free fatty acids (FFA), glucose, lactate, and pyruvate are all oxidized through the citric acid cycle by heart during normal perfusion, but only limited data exists on substrate oxidation during ischemia. A combination of 1H and 13C NMR spectroscopic methods allows determination of multiple fluxes through glycolytic and oxidative pathways in a single experiment; here we applied this technique for the first time to study substrate use during very low flow ischemia. Isolated Sprague–Dawley rat hearts were Langendorff‐perfused for 30 min under conditions of normal flow (NOR, N = 11) and low flow ischemia (LFI, 0.3 ml/min, N = 8) and LFI with the pyruvate dehydrogenase activator dichloroacetate (DCA, 5 mM; N = 2). Hearts were perfused with 13C‐labeled lactate, pyruvate, palmitate, and glucose at physiologic concentrations. We found that despite a 97% reduction in flow and oxygen consumption, oxidation of all exogenous as well as endogenous substrates occurs and is responsible for a substantial fraction of the total ATP produced during very low flow ischemia (Table gives oxidative and non‐oxidative ATP production rates and %ATP formed from metabolism of each substrate). Significant lactate oxidation occurs during NOR with a decrease during LFI; oxidation of glycogen increases during LFI. DCA did not increase overall ATP production during ischemia but did result in a substantial decrease in palmitate oxidation. Thus, these NMR spectroscopic techniques are useful to determine substrate utilization during LFI and are a means of studying the potential beneficial effects of metabolic modulators and adaptive physiologic processes during ischemia.
107. Accelerating PC‐SSFP Velocity Mapping Using k‐t BLAST
Christof Baltes, Jeffrey Tsao, Sebastian Kozerke, Peter Boesiger. Institute for Biomedical Engineering, University and ETH, Zurich, Switzerland.
Introduction: A new flow quantification approach combining phase contrast velocity mapping and steady‐state free precession imaging (PC‐SSFP) was recently proposed (Markl et al., Citation). This method provides high signal‐to‐noise ratios (SNR) resulting in low phase noise and clear depictions of the vessel throughout the cardiac cycle.
In this work, we aimed at accelerating PC‐SSFP velocity mapping. Up to 8‐fold acceleration is achieved using k‐t BLAST (Tsao, Citation; Tsao et al., Citation). The accuracy of the method is validated by comparing k‐t BLAST velocity data with data from standard PC‐SSFP and conventional gradient echo (TFE) velocity mapping in the ascending aorta of healthy volunteers.
Purpose: The objective of the current work was to accelerate PC‐SSFP using k‐t BLAST to allow single‐breathhold, high‐resolution SSFP phase contrast velocity mapping.
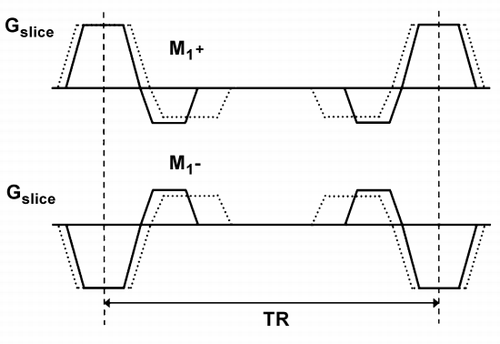
Methods: PC‐SSFP was incorporated into the acquisition software of a Philips 1.5 T MR system. Through‐plane velocity sensitivity in SSFP imaging was adapted by changing the first order moments (M1+, M1−) of the slice‐selection gradient (Figure ). The slice‐select gradient was inverted in one of the two measurements required for phase contrast (PC) velocity mapping (Markl et al., Citation).
Figure 1. Slice selection gradients applied in the PC‐SSPC sequence. The first order moments (M1+, M1−) are changed to create different velocity sensitivities. The slice‐select gradient is inverted in the second scan segment (M1−).
To shorten scan times, PC‐SSFP was combined with the k‐t BLAST method (Tsao, Citation; Tsao et al., Citation). This method applies sparse sampling to k‐t space, thus leading to dense packaging of signal replicas in the reciprocal x‐f space. During reconstruction, the aliasing is resolved using knowledge from low‐resolution training data. The high‐resolution, sparsely sampled and the low‐resolution training data were acquired in one single breath‐hold. Training data consisted of 11 profiles sampled at the full field‐of‐view.
Cine velocity mapping was performed in the ascending aorta of three volunteers. The following scan parameters were used for PC‐SSFP: spatial resolution: 1.2 × 1.2 mm2‐1.3 × 1.3 mm2, venc: 150–180 cm/sec, TE/TR:1.8–2.0 ms/3.5–4.0 ms, temporal resolution:22–28 ms. Parameters for PC‐TFE were: TE/TR:2.5–2.8 ms/5.7–6.0 ms, temporal resolution:23–24 ms. For validation purposes, free‐breathing PC‐TFE and PC‐SSFP sequences were performed with 3 signal averages to suppress respiratory motion artifacts. Scan time for the non‐accelerated PC‐TFE and PC‐SSFP acquisitions were 4:30 min and 2:35 min, respectively. Using k‐t BLAST, PC‐SSFP was accelerated 5‐ and 8‐fold. Taking into account the acquisition of the training data, the net acceleration factors amounted to 4.1 and 5.7, respectively. Accordingly, scan durations with k‐t BLAST were reduced to 0:14 and 0:10 min facilitating single breath‐hold acquisitions.
Results: Figure shows anatomical images and phase maps of the ascending aorta during peak systole. Data were acquired using PC‐SSFP with no acceleration (3 signal averages) (2a,2b) and acceleration factors 5 (2c,2d) and 8 (2e,2f). Excellent image quality was obtained in all PC‐SSFP scans.
Figure 2. Anatomical images and velocity maps acquired during peak systole using PC‐SSFP ((a,b) reference scan, (c,d) 5 × k‐t BLAST and (e,f) 8 × k‐t BLAST). The numbers indicate the actual scan time.
Good agreement of the flow profiles calculated from non‐accelerated PC‐SSFP and standard PC‐TFE data was found (Figure ). Flow profiles obtained with accelerated PC‐SSFP sequences compared well with reference data (non‐accelerated PC‐SSFP) (Figure ). The error in stroke volume for all PC‐SSFP measurements compared to PC‐TFE was less than 8% on average.
Figure 3. (a) Flow profiles acquired with the reference PC‐SSFP and PC‐TFE sequence. (b) Flow profiles calculated from the reference and the accelerated PC‐SSFP measurements.
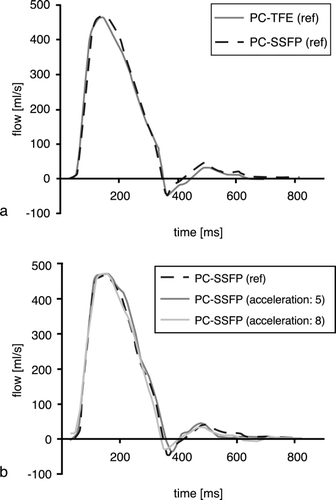
Conclusion: We showed that PC‐SSFP in combination with k‐t BLAST allows for accurate flow quantification at high spatial and temporal resolutions in a single breath‐hold. Moreover, the high intrinsic contrast‐to‐noise in PC‐SSFP imaging facilitated automatic vessel segmentation.
108. Direct Quantification of Mitral Regurgitation with Phase Velocity Mapping
Saul Myerson, MD, MRCP, Stefan Neubauer, MD. Cardiovascular Medicine, Oxford University, Oxford, United Kingdom.
Background: Quantification of mitral regurgitation aids the clinical management of this condition and may prove to be useful in determining the optimum timing for valve replacement surgery. Current cardiovascular magnetic resonance (CMR) techniques quantify mitral regurgitation by indirect methods, which may be more susceptible to errors. We assessed the direct measurement of mitral regurgitation using phase velocity mapping and compared it to the two existing CMR methods of indirect quantification.
Methods: 16 patients with isolated mitral regurgitation had CMR quantification of the regurgitation by both direct and indirect methods. Indirect measurement was performed by calculating the left ventricular stroke volume using the standard technique of multiple short axis cine slices and subtracting either the aortic forward flow, measured with through‐plane phase velocity mapping above the aortic valve [“Indirect (flow)”] or the right ventricular stroke volume [“Indirect (volumes)”]. These methods assume the absence of either a ventricular septal defect for Indirect (flow) or other valve leaks for Indirect (volumes).
Direct measurement [“Direct”] was performed by visualising the mitral regurgitant jet on cine imaging in the horizontal and vertical long axis planes and placing an image slice perpendicular to the jet, just on the atrial side of the mitral valve. Through‐plane phase velocity mapping was performed in this image plane to quantify the mitral regurgitation.
Bland–Altman plots were used to determine the agreement between techniques, both for regurgitant volume and regurgitant fraction (regurgitant volume/stroke volume expressed as a percentage). All means are expressed ± standard deviation.
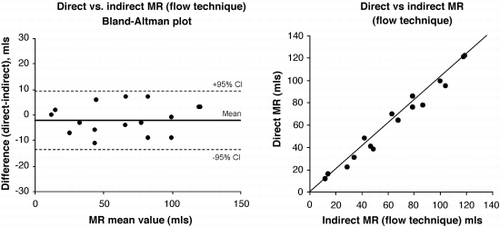
Results: Direct and indirect quantification was possible in all cases. Mean mitral regurgitant volume was 63.7 ± 35.6 mls (range 12–122) by direct measurement compared to 65.3 ± 34.8 and 63.8 ± 33.5 mls by Indirect (flow) and Indirect (volumes) respectively. Mean regurgitant fraction was 44.5 ± 17.5% (range 11–73) by direct measurement. As expected, there was close correlation between direct and indirect regurgitant volumes, with a correlation coefficient (r) of 0.986 for Direct vs. Indirect (flow) and r = 0.935 for Direct vs. Indirect (volumes). Similar high correlations were observed for regurgitant fractions.
There was no systematic bias between Direct and Indirect methods, with mean differences for regurgitant volume of − 1.6 ± 5.9 mls and − 0.1 ± 12.7 mls by Indirect (flow) and Indirect (volumes) respectively. Regurgitant fraction showed similar results with mean differences compared to Direct of − 0.9 ± 4.9% and − 0.1 ± 8.6% for Indirect (flow) and Indirect (volumes) respectively. Bland–Altman plots showed 95% limits of agreement for regurgitant volumes of ± 11.5 mls for Direct vs. Indirect (flow) and ± 24.8 mls for Direct vs. Indirect (volumes). Bland–Altman plots for regurgitant fraction showed limits of agreement of ± 9.5% and ± 16.9% for Direct vs. Indirect (flow) and Indirect (volumes) respectively ().
Figure 1.
Conclusion: Direct quantification of mitral regurgitation by CMR is feasible and compares well to existing indirect methods. The agreement of the Direct method with Indirect (flow) is better than with Indirect (volumes), and it is well recognised that the latter method is more susceptible to errors from other unrecognised valve leaks. The direct method should be less prone to error than either of the indirect techniques, relying only on a single measurement rather than a calculation from two measurements, and is also independent of any other cardiac pathology.
109. Limited Flow Reserve Measured by MRI in Bypass Grafts Supplying Infarcted Myocardium
Christian Spies, M.D.,1 James R. Madison, D.O.,1 Oliver K. Mohrs, M.D.,2 Bernd Nowak, M.D.,2 Thomas Voigtlaender, M.D.2 1Internal Medicine, University of Hawaii, Honolulu, HI, USA, 2Department of MRI, Cardiovascular Center Bethanien (CCB), Frankfurt/Main, Germany.
Introduction: It has been shown that cardiovascular magnetic resonance (CMR) based flow reserve measurements of coronary‐artery‐bypass‐grafts can identify significantly stenosed grafts by reduced flow. However, flow reserve might be falsely low if the distal microcirculation is altered in cases such as infarcted myocardium.
Purpose: The purpose of this study was to investigate the flow reserve in bypass grafts supplying infarcted and non‐infarcted myocardium.
Methods: Thirty bypass grafts were examined by MR flow‐contrast measurements (TE 4.2 ms, temporal resolution 70 ms, flip angle 30°, venc. 75 cm/s, voxel‐size 1.4 × 0.8 × 6.0 mm3). Flow reserve was derived as the ratio between mean flow velocity at rest and during hyperemic state, using Adenosine (140 µg/min/kgBW). Late enhancement technique was used to separate the grafts into two groups either supplying infarcted or non‐infarcted myocardium, respectively. Concurrent presence of significant graft stenosis was excluded by X‐ray angiography, scintigraphy or exercise stress‐testing.
Results: CMR angiography demonstrated occlusion of four grafts. One internal mammary artery (IMA) bypass was not visualized. Of the remaining 25 bypasses, 12 supplied infarcted areas (group A) and 13 supplied normal myocardium (group B), as classified by late enhancement results. Group A consisted of eight savenous‐vein‐grafts (SVG) and four IMA‐bypasses. In group B eight grafts were SVGs and five IMAs, respectively. The flow reserve differed significantly between group A and group B (1.8 ± 0.76 vs. 2.9 ± 1.2 [mean ± SD], p = 0.01).
Conclusions: Flow reserve is reduced in non‐stenosed grafts supplying infarcted myocardium, most likely due to an altered microcirculation. Thus in order to achieve a reliable interpretation and comprehensive evaluation of bypass function, MRI‐based assessment must include viability testing utilizing late enhancement concept.
110. Application of MRI Phase Velocity Mapping for Detection of Aortic Valve Gradients in Patients with Severe Aortic Stenosis as Compared to Echocardiography; Who Is Right?
Maulik Patel, MD, Vikas K. Rathi, MD, June Yamrozik, Ronald B. Williams, Diane A. Vido, Maria Jaksec, James A. Magovern, MD, Sunil Mankad, MD, Mark Doyle, PhD, Robert W. W. Biederman, MD. Allegheny General Hospital, Pittsburgh, PA, USA.
Introduction: Theoretical and pragmatic limitations of transvalvar gradient assessment by echocardiography (Echo) includes user dependence, cosineè errors, inability to interrogate in X,Y and Z direction, pressure recovery considerations, non‐linear accelerations, and limited sub‐pixel resolution. Yet, echocardiography remains practical and has considerable clinical utility. Given MRI's ability with phase velocity mapping (PVM) to overcome most, if not all Echo limitations, we wondered if MRI could add practical clinical value in aortic stenosis (AS) patients and, if there was discord, which modality approached the truth.
Hypothesis: MRI, via PVM, can provide similar, if not better assessment of the degree of valvar stenosis in symptomatic patients with AS than echocardiography.
Methods: Twenty three subjects (10 female) including 16 with symptomatic aortic valvar stenosis underwent same‐day (within 5 ± 2 hrs) blinded assessment of their aortic valve first by MRI (GE 1.5 T CV/i) followed by echocardiography (blinded to MRI results), (Phillips Sonos 5500, Andover, MA). PVM was performed with optimized TR (19 ± 4 ms), X,Y and Z encoding, and offline flow analysis by Medis (Leiden, The Netherlands) to yield peak and mean transvalvar velocities and their corresponding gradients. Seven normal controls also underwent similar testing.
Results: All 16 patients underwent successful aortic valve replacement. There was a high degree of correlation between MRI and Echo derived parameters of transvalvar measurements. Overall, 14/16 (87%) and 11/16 (69%) of the patients by MRI and Echo, respectively, had peak transvalvar aortic velocities > 4.0 m/s2. [13/16 (81%) by Echo > 3.9 m/s2]. Concordance for velocities > 4 m/s2 was achieved in 88%. The peak transvalvar gradients were 5.1 ± 0.5 and 4.2 ± 0.3 m/s2, respectively). Importantly, the discordance was partially explained by 2 of 16 Echo images having cosineè errors approaching 35 degrees. Nevertheless, the correlation coeffiencients were 0.96, 0.91 and 0.92 for maximum velocity, mean velocity and maximum gradient, respectively, (p < 0.0005 for all) with the absolute peak and mean velocities for MRI vs Echo of 399 ± 211 vs. 323 ± 145, 265 ± 136 vs. 230 ± 109 cm/s2, respectively. Similarly, there were no significant differences between the controls gradients (5.3 vs. 4.2 mmHg, respectively). Bland–Altman confidence intervals were reasonable for bias and precision. Despite this, the Echo velocities were consistently and proportionately lower then MRI (19% and 15% peak and mean, respectively). Importantly, since either technique can under but not overestimate velocities and MRI has undergone phantom correlations, the higher peak and mean velocities described by MRI strongly suggests that MRI represents velocities closer to the truth. The difference in aortic valve acquisition time was 1 ± 2 fewer minutes for MRI.
Conclusion: MRI, via PVM, has theoretic, practical, and now precision and time advantages to the calculation of trans‐aortic valve gradients. Measured transvalvar gradients are similar and both techniques correctly identify those patients legitimate for aortic valve replacement. While MRI demonstrates high correlations when compared to Echo, it may have greater inherent accuracy when compared to flow phantoms. Thus, when added to its serving as the “gold standard” for detection of LV structure and function, LV mass quantification, and thoracic aortic imaging in AS patients, MRI should be strongly considered in their aortic transvalvar assessments.
111. Noninvasive Diagnosis of Cardiac Shunts in Humans Using Rapid O2‐Enhanced 1H MR T1 Mapping
Christian M. Wacker, Tungte Wang, Alexandra Rauch, Peter Schanzenbaecher, Peter M. Jakob, Wolfgang R. Bauer. Medical Clinics, Cardiology and Biophysics, University, Wuerzburg, Germany.
Introduction: Quantification of human cardiac shunts is performed usually using noninvasive echocardiography or invasive catheterization by measuring O2 saturations in different heart chambers. Moreover, phase‐contrast MRI techniques have been recently established for clinical use.
Purpose: As an alternative, we report a noninvasive approach using a rapid O2‐enhanced 1H MR T1‐mapping technique.
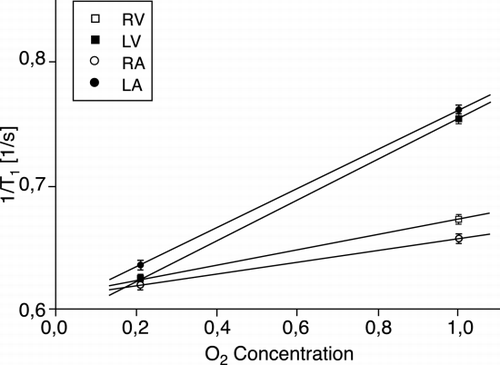
Methods: Two healthy volunteers and two patients with cardiac shunts, one with left‐to‐right atrial septal defect (ASD) and another with right‐to‐left ventricular septal defect (VSD), were examined on 1.5‐T VISION, Siemens. Informed consent was obtained before each study. T1 maps in a 4‐chamber‐view based on an IR Snapshot FLASH technique were acquired in combination with breathhold on end‐expiration, while the subjects were breathing 21% O2 and 100% O2, respectively. No ECG triggering was used in all T1‐mapping experiments. Molecular O2 physically dissolved in blood is weakly paramagnetic and acts as a T1‐shortening contrast agent. Thus, it is possible to obtain information about blood O2 content using molecular O2 as a tracer substance.
Results: As an example, ROIs including 30 pixels were drawn in all heart chambers and the corresponding R1 (mean ± SD) was plotted as a function of inhaled O2 concentrations (). In this patient (55‐year‐old female ASD‐patient while breathing 21% O2), arterial blood in both left atrium and ventricle show a significant ΔR1 slope of O2 enhancement of 0.16 1/s/%O2 as also observed in healthy volunteers. However, the venous blood in both right atrium and ventricle show a ΔR1 slope of O2 enhancement of approximately 0.06 1/s/%O2 in contrast to near 0 1/s/%O2 in healthy volunteers indicating that the venous blood was not “completely venous” and therefore is mixed with the arterial blood from left chambers via the left‐to‐right shunt.
Figure 1.
Conclusions: Noninvasive diagnosis of cardiac shunts was successfully demonstrated using a rapid O2‐enhanced 1H MR T1‐mapping technique. This method directly depicts shunt effects via physically dissolved O2 as a contrast agent. It has the potential to provide qualitative information before and after occlusion of the defect without the need of catheter. Future work will concentrate on quantitative determination of shunt volume.
112. Pulmonary Vein Ostial Area and Eccentricity Are Better Predictors for Atrial Fibrillation Than Pulmonary Vein Maximum Diameter
Margit A. Nemeth, M.D.,1 John Ho, M.D.,1 Veronica Lenge, M.D.,2 Raja Muthupillai, Ph.D.,3 M. Azam Hadi, M.D.,4 Ali Massumi, M.D.,1 Abdi Rasekh, M.D.,1 John J. Seger, M.D.,1 Jie Cheng, M.D.,1 Scott D. Flamm, M.D.5 1Cardiology, St. Luke's Episcopal Hospital/Texas Heart Institute, Houston, TX, USA, 2Radiology, St. Luke's Episcopal Hospital/Texas Heart Institute, Houston, TX, USA, 3Phillips Medical Systems, Cleveland, OH, USA, 4Cardiology, Tulane University, New Orleans, LA, USA, 5Cardiology and Diagnostic Radiology, St. Luke's Episcopal Hospital/Texas Heart Institute, Houston, TX, USA.
Background: The sleeves of atrial myocardium within pulmonary veins play a key role in the initiation of atrial fibrillation (AF)1,2. Recent studies suggest that the origin of focal AF frequently localizes to the largest pulmonary vein3. With increasing acceptance of radio frequency (RF) ablation for treating patients with AF, pre‐procedural evaluation of PV morphology aids optimal sizing of ablation lassos, and directs more focused ablations to minimize complications. Recent studies have attempted to describe PV morphology using metrics such as the maximum diameter of pulmonary veins4–6, the distance between the right and left pulmonary veins5, etc., either by using MRI or multi‐detector CT 4–6. The predictive value of these metrics to identify AF is yet to be determined.
Purpose: To assess the predictive value of PV ostial area indexed to body‐surface area (OAI), maximum diameter indexed to BSA (Dmax_I), and PV eccentricity (Ecc), using 3D contrast‐enhanced MRA.
Methods: Patient Population—62 patients underwent 3D contrast enhanced‐MRA (CE‐MRA) of the pulmonary veins: 40 patients with paroxysmal AF (age: 54 ± 10; 31 male) and 22 patients without (age: 60 ± 18; 13 male). MR Imaging—All imaging was performed on a 1.5 T commercial imager (Philips NT‐Intera, software Release 8) using a 5‐element phased‐array cardiac coil or 4‐element body surface coil for signal reception. A fast T1 weighted turbo‐field echo sequence was used for data acquisition following a bolus injection of 0.2 mmol/kg of Gd‐DTPA administration at 2 cc/sec. Specific acquisition parameters were: repetition time/echo time/flip angle: 4.5 msec/1.9 sec/40 deg; number of slices/slice thickness: 65/2.3 mm; acquisition time: 25 s; acquired voxel size: 1.2 × 1.5 × 2.3 mm3; reconstructed voxel size: 0.8 × 0.8 × 1.13 mm3 (after zero padding). The 3D data acquisition with centric k‐space sampling was initiated after visualizing the contrast arrival in the PVs using a real‐time bolus monitoring acquisition. Image Analysis—The contrast enhanced MRA data set was transferred to a post‐processing workstation (EasyVision Rel. 5, Philips Medical Systems). The 3D volume was reformatted to orient each PV along its long axis. The cross sectional area and maximum diameter (Dmax) of the PV ostia were directly measured in a plane orthogonal to the long axis of the PV. Ostial area index (OAI) was defined as the ratio of ostial area to BSA (cm2 per m2). the maximum diameter was also indexed to the BSA (Dmax_I). The Eccentricity of each PV was calculated as sqrt(Dmax − Dmin/Dmax).
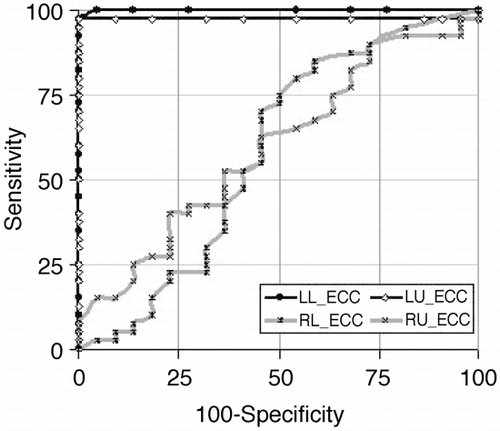
Results: 256 PV were analyzed, including common ostia in 18 patients (2‐right, 16‐left) and separate ostia for the right middle lobe in 6 patients. The metrics measured and their statistical significance are listed in . In both patient populations, the right upper (RU) OAI was generally the largest, followed by right lower (RL), left upper (LU), and finally the left lower (LL) OAI. In terms of Dmax_I, only the Dmax_I of the LL PV between the normal and AF groups was statistically significant. The left sided PVs were significantly more eccentric in the AF group compared to the normal group. The ROC analysis shows that left side PV eccentricity was a near perfect predictor of AF with area under the curve for LL and LU Ecc as 0.99 ± 0.003 (95% CI: 0.94–1.00) and 0.98 ± 0.02 (95% CI: 0.89–0.99), respectively ().
Table 1. Quantitative Indices Describing PV Morphology in Normal and Patients with AF
Figure 1. ROC curve showing the high sensitivity and specificity of left sided PV Ecc compared to the right sided PV for identifying patients with AF.
Conclusions: Our results indicate that metrics describing PV morphology can be assessed using 3D CE‐MRA non‐invasively. In patients with AF, the eccentricity of left side PVs is significantly higher than in normals and provides an extremely sensitive and specific marker for AF.
113. Feasibility of Early Magnetic Resonance Imaging for Assessment of Treatment Effects of Tirofiban in Patients After Primary Percutaneous Transluminal Coronary Angioplasty and Stenting for Acute Myocardial Infarction
Henning Steen,1 Matthias Stuber, PhD,2 Joao A. C. Lima, MD,1 Hugo A. Katus, MD,3 Evangelos Giannitsis, MD.3 1Cardiology, Johns Hopkins Hospital, Baltimore, MD, USA, 2Radiology, Johns Hopkins Hospital, Baltimore, MD, USA, 3Cardiology, Universitätsklinikum, Klinik III, Heidelberg, Germany.
Introduction: MRI in acute myocardial ST‐ Elevation infarctions with concomitant vessel stenting it has been rarely used for clinical investigation and functional cardiac assessment. The effectiveness of Tirofiban, a selective GPIIa/IIIb receptor inhibitor as receptor blocker has been established but is still controversial in patients with acute ST segment elevation myocardial infarction (STEMI) undergoing primary percutaneous interventions. We hypothesized that pre‐treatment with Tirofiban after primary percutaneous transluminal cardiac intervention (PCI) would improve cardiac function initially and one week after intervention, and that cardiac MRI can be utilized to characterize potential effects of GPIIb/IIIa antagonists.
Purpose: We hypothesized that pre‐treatment with Tirofiban after primary percutaneous transluminal cardiac intervention (PCI) would improve cardiac function initially and one week after intervention, and that cardiac MRI can be utilized to characterize potential effects of GPIIb/IIIa antagonists.
Methods: Patients (n = 53) admitted within 12 hours (mean 5.8 hours) after onset of symptoms were randomized to Tirofiban (n = 29) or standard therapy (controls, n = 24) prior to primary PCI with stenting. MR images were obtained initially, within 24 hours, and one week after the acute event with a 1.5‐T Whole Body Scanner (Siemens Symphony; Siemens, Erlangen, Germany, flexible 2 element phased‐array surface and two back coils). After Scout imaging a vertical long axis (VLA) and a stack of 9–11 contiguous short axis CINE True‐FISP slices (TR = 3.64 ms, TE = 1,82 ms, Flip angle = 64°, FOV = 340 mm, Matrix = 256*256, slice thickness = 10 mm, temporal resolution 53 ms) were obtained. Four short‐axis levels (I = base, II = proximal, III = distal papillary muscles, IV = apex.) were selected for perfusion imaging during breath‐hold Inversion Recovery (IR) T1‐weighted Turbo Flash imaging (TR = 171 ms, TE = 1,14 ms, Flip angle = 8°, TD = 535 ms, FOV = 450 ms, Matrix = 256/208, slice thickness = 8 mm) using 0.05 mmol/l of Gadolinium). Delayed (after 15 minutes) contrast‐enhanced images were acquired on the same short axis levels using an IR ECG triggered breath‐hold Turbo‐ FLASH sequence (TR = 390 ms, TE = 2.9 ms, TI = 650–900 ms depending on the heart rate; Flip angle = 25°; matrix, 256*256; FOV = 256*256, 2RR intervals, TI = 320 ms, incrementally adapted by 10 ms every 5 min) covering the entire left ventricle in a short‐axis view. Wall motion assessment (6 segments per short axis slice), calculation of left ventricular end‐diastolic and end‐systolic volume (EDV‐ESV) and resulting ejection fraction (EF) were derived from the multiple CINE short axis images (SIEMENS ARGUS).
For assessment of delayed enhancement, each hyperenhanced area was outlined manually in magnified views. For perfusion analysis, myocardium was divided into 22 segments (6 segments for slice I–III, 4 slices for slice IV) and time‐intensity curves (TICs) were generated in all segments by placing regions of interest (ROI) within the hypoenhanced sections and normal myocardium (remote), manually corrected for motion artefacts with unchanged ROI size. p smaller 0.05 was considered statistically significant.
Results: The patient characteristics and MRI results are summarized in Tables and .
Table 1. Patient Characteristics of Patients Treated with or without Tirofiban (GPIIb/IIIa Antagonist) in ST‐Elevation Myocardial Infarctions (STEMI)
Table 2. MRI Measurements Patients Treated with or without Tirofiban (GPIIb/IIIa Antagonist) in ST‐Elevation Myocardial Infarctions (STEMI)
After PCI and Tirofiban, MRI revealed higher normalized peak signal intensities (2.19 vs 1.63, p = 0.046) and a trend toward steeper upslopes (0.79 vs. 0.48, p = 0.1) in cardiac perfusion imaging. Cardiac function was slightly better preserved with Tirofiban as indicated by a trend for higher LV‐EF (46.9 vs. 39.6%, p = 0.1) and a significantly lower number of myocardial segments with abnormal wall thickening (6.4 vs. 8.5, p = 0.025).
Conclusions: The current findings suggest that MRI may be useful as a new sensitive and safe multifunctional diagnostic tool for patients with acute myocardial events. MRI provides a complementary method for non‐invasive assessment of cardiovascular function, myocardial perfusion and delayed hyperenhancement in patients with STEMI undergoing primary PCI. Although the statistical power is currently limited (ongoing study), MRI is able to detect pharmacologically induced physiological differences after pre‐treatment with Tirofiban. Secondly, GPIIb/IIIa antagonists appear to be safe and improve myocardial perfusion detectable with cardiac MRI acutely and one week apart.
114. Effect of Glycoprotein IIb/IIIa Antagonist on the Extent of Irreversible Microvascular Injury in Patients with Reperfused Acute Myocardial Infarction
Nidal Al‐Saadi, MD, Ralf Dechend, MD, Hassan Abdel‐Aty, MD, Andrew Taylor, MD, Rainer Dietz, MD, Matthias Freidrich, MD. Cardiology, Franz‐Volhard‐Klinik, Charite, Campus Berlin‐Buch, Humboldt University, Berlin, Germany.
Introduction: Cardiac magnetic resonance (CMR) provides a comprehensive means for the assessment of microvascular and myocardial viability states following acute myocardial infarction (AMI). It has been shown to differentiate between reversible and irreversible microvascular as well as myocardial injury in this clinical setting, which is of prognostic importance.
Purpose: To investigated the influence of Glycoprotien (GP) IIb/IIIa antagonists on reversible and irreversible microvascular injury in acute reperfused myocardial infarction.
Methods: 43 Patients were examined 4 ± 2 days after AMI (n = 33). 22 patients were treated with GPIIbIIIa (GP +) and 21 were not (GP −). All patients were successfully revascularized by PCI. The multisequential CMR approach included a multislice evaluation of wall motion analysis, first pass myocardial perfusion, and irreversible myocardial injury (delayed hyperenhancement). Slice thickness and slice orientation was kept constant for all sequences. For all three evaluations the circumferential extent of the abnormality (injury) was assessed by quantitative analysis and subsequently correlated to one another. Delayed enhancement was utilized to identify irreversible myocardial injury, whereas reversible microvascular injury was defined as perfusion defects outside the area of delayed enhancement.
Results: The circumferential extent of microcascular injury did not differ significantly between the two groups (GP + 90 ± 38°, GP − 87 ± 35°), whereas the extent of irreversible injury (delayed enhancement) was significantly smaller in GP + than in GP‐ (52 ± 27° vs 58 ± 23°; p < 0.05). The ratio delayed enhancement/reversible injury was in the GP + larger than in the GP‐ (0,67 vs. 0,58, p < 0.05).
Conclusions: Treatment with GP IIb/IIIa antagonist in the setting of AMI with reperfusion therapy seems to reduce the extent of irreversible injury within the hypoperfused area reflecting a protective property, which may be due to a reduction of micoembolization and improved rheology. This effect might contribute to the clinical benefit observed with glycoprotein IIb/IIIa antagonist in conjunction with PCI in acute myocardial infarction.
115. The Effect of Intraaortic Balloon Counterpulsation on Regional Systolic Function After Acute Myocardial Infarction—Randomized Experimental Magnetic Resonance Imaging Trial
Clerio F. Azevedo,1 Luciano C. Amado, MD,1 Dara L. Kraitchman, VMD, PhD,2 Bernhard L. Gerber, MD, PhD,1 Nael F. Osman, PhD,2 Carlos E. Rochitte, MD,1 Katherine C. Wu, MD,1 Joao A. C. Lima, MD.1 1Cardiology, Johns Hopkins Hospital, Baltimore, MD, USA, 2Radiology, Johns Hopkins Hospital, Baltimore, MD, USA.
Introduction: The intraaortic balloon pump (IABP) is currently the most widely used of all circulatory assist devices. Counterpulsation increases myocardial oxygen supply by diastolic augmentation of coronary perfusion and decreases myocardial oxygen requirements through a reduction in the afterload component of cardiac work.
Purpose: We attempted to determine whether the favorable shift in the myocardial oxygen supply/demand ratio afforded by IABP translates into improved regional myocardial function after reperfused AMI.
Methods: Fourteen dogs underwent 90‐min coronary artery occlusion followed by reperfusion. From those, 7 dogs were randomized to receive IABP immediately after reperfusion. Five short‐axis slices were acquired for each dog at 1 h, 6 h and 24 h of reperfusion using both delayed‐enhancement (DE) and tagged MRI. IABP was turned off during image acquisition. Regional blood flow < 50% of remote by radioactive microspheres during coronary artery occlusion was used to define risk region. Each slice was divided in 6 segments that were classified into 4 categories: extensive AMI (DE > 50% area), subendocardial AMI (DE < 50% area), risk region and remote area. Peak systolic circumferential strain (Ecc) was calculated and recorded for each segment.
Results: Among segments with extensive AMI there was no difference in Ecc between the IABP group and controls. Moreover, there was no Ecc improvement in either group from 1 h to 6 h or 24 h. Among subendocardial AMI segments, however, we found that 24 h after reperfusion, the IABP group had significantly higher Ecc values than controls (P < 0.01). Indeed, among these segments, the IABP group had a significant Ecc improvement from 1 h or 6 h to 24 h (P < 0.001), while controls did not (NS). Among risk region segments, we found that both groups displayed significant systolic dysfunction 1 h after reperfusion and recovered to normal contractility at 24 h. Six hours after reperfusion, however, the IABP group already exhibited normal contractility while controls still displayed significant systolic dysfunction (P < 0.001). Therefore, both groups showed a significant Ecc improvement in risk region segments, but the improvement occurred earlier in the IABP group (between 1 h and 6 h), than in controls (between 6 h and 24 h). Both groups displayed normal Ecc values in remote segments at all time points. ()
Conclusions: IABP has a direct beneficial effect on regional functional recovery of segments that are predominantly composed of non‐infarcted reversibly injured myocardium. These results indicate that IABP has a favorable effect on stunned myocardium functional recovery after reperfused AMI.
116. In Vivo Evaluation of the Effects of Mouse Embryonic Stem Cells Oncardiac Function Using MRI
Takayasu Arai, MD,1 Jorg de Bruin, MD,2 Theo Kofidos, MD,2 Ross Venook, PhD,3 Michael McConnell, MD,1 Jeff Bulte, PhD,4 Thomas Quertermous, MD,1 Robert Robbins, MD,2 Phillip Yang, MD.1 1Cardiovascular Medicine, Stanford University, Stanford, CA, USA, 2Cardiothoracic Surgery, Stanford University, Stanford, CA, USA, 3Electrical Engineering, Stanford University, Stanford, CA, USA, 4Radiology, Johns Hopkins University, Baltimore, MD, USA.
Introduction: While recent medical advances have improved the treatment of congestive heart failure (CHF), the disease continues to be a major public health problem. Stem cell transplantation may offer therapeutic potential to salvage the injured myocardium. Investigational data suggest that there is functional replacement of or differentiation into cardiac myocytes by skeletal myoblasts, fetal cardiac myocytes, and hematopoietic and embryonic stem cells. Assessment of cell labeling and viability of transplanted cells has been described using non‐invasive imaging techniques. However, systematic longitudinal data regarding the improvement in cardiac function by cell transplantation therapy are not available.
Purpose: To perform a longitudinal evaluation of cardiac function in myocardial infarct mouse model following the transplantation of mouse embryonic stem cells (mESC).
Methods: The mESC line, TL‐1, were derived from 129 Sv/J mice and cultured in DMEM supplemented with 10% fetal bovine serum, L‐glutamate, 0.1 mM B‐mercaptoethanol (Sigma, St. Louis, MO) and 103 µ/ml leukemia inhibitory factor (LIF, Chemicon International, Temecula, CA). Cell labeling solution was prepared using 25‐ug of Feridex (Berlex Laboratories, Wayne, NJ) incubated for 60 minutes with 375‐ng of PLL (Sigma, St. Louis, MO) for 1 cc of mESC medium (approximately 1 × 10⁷ cells). The mESC were incubated with the labeling solution for 24 hours.
Under anesthesia via endotracheal intubation, left anterior thoracotomy incision was performed. The left anterior descending coronary artery was ligated with a 9–0 silk ligature. 250,000 mESC were injected into the midportion of the myocardial infarction. Residual air was aspirated from the left chest following chest closure.
Twenty‐one 129 Sv/J mice were imaged using a 1.5 T Signa Whole Body MR Scanner (GE, Milwaukee, WI). The mice were divided into 5 groups: normal control (4), sham operated (5), LAD‐ligated (5), LAD‐ligated with non‐labeled ESC (4), and LAD‐ligated with labeled ESC (3). The mice weighing 20–30 g were anesthetized with spontaneous breathing and imaged in a prone position. The ECG leads were attached to both front and hind paws. The images were acquired using ECG‐triggered cine sequence (TE 5.6‐ms, TR 34‐ms, FA 30°, FOV 6.0 cm2, matrix 256 × 192, slice gap 0‐mm, slice thickness 1.0‐mm, and 15 cardiac phases). Imaging plane was localized using scout images in a coronal plane followed by double‐oblique acquisition. Multiple contiguous short‐axis slices were acquired to cover the LV. A single turn elliptical (2.5 × 3.5‐cm) receive only surface coil was used.
Data were analyzed using MASS software (GE, Milwaukee, WI). Left ventricular ejection fraction (LVEF) and LV mass (LVM) were calculated by manually adjusted tracing of endocardial and epicardial borders in all 15 cardiac phases. The LVM was determined by multiplying the diastolic volume by the specific gravity of myocardium (1.05 g/cm3).
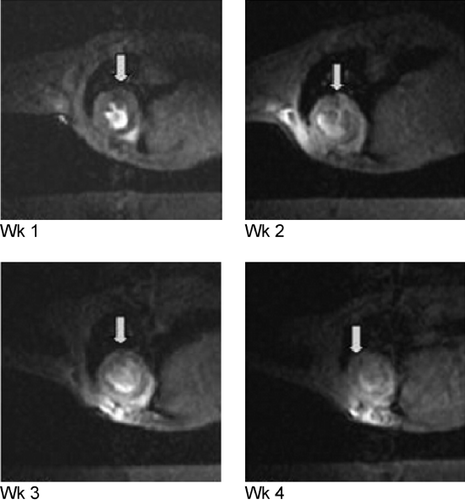
Results: This study demonstrated reliable in vivo longitudinal assessment of mouse cardiac function using a 1.5 T clinical MR scanner. The data indicated significant restoration of LVEF and LVM in the mESC treated group in comparison to the untreated group at each time point throughout the 4 weeks (p < 0.05). The mESC treated group demonstrated mean LVEF of 37.9% vs. 28.6% in the untreated group (p < 0.05). A significant increase was also observed in mean LV mass in the treated group of 51.4 mg vs. untreated of 34.2 mg (p < 0.05). The data throughout the 4 week duration are shown in and . The end‐diastolic and end‐systolic MR images of sham‐operated, LAD‐ligated, and mESC treated groups are shown in . Reliable imaging of the labeled cells for the duration of 4 weeks is shown in (white arrow).
Figure 1.
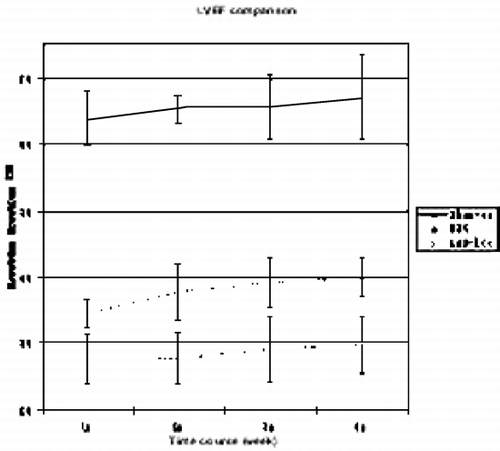
Figure 2.
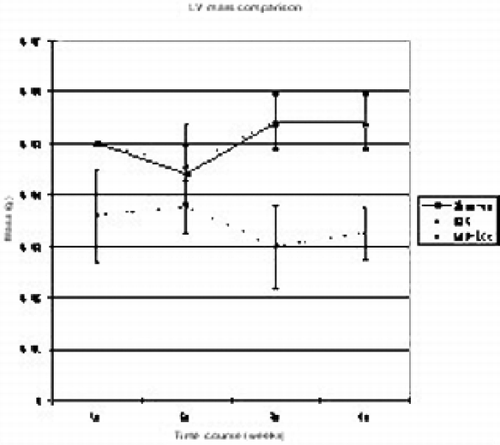
Figure 3.
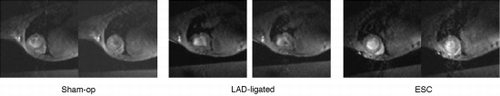
Figure 4.
Conclusions: In vivo MR imaging of the labeled mESC enable identification of the cells and assessment of their therapeutic effects on the cardiac function.
117. In Vivo Tracking of Human Adipo‐Derived Multilineage Progenitor Cells by CMR in a Murine Model of Myocardial Infarction
Adam J. Katz, M.D.,1 Zequan Yang, M.D./Ph.D.,2 Hulan Shang, MS,1 Allison T. Chamberlain,1 Stuart S. Berr, Ph.D.,3 R. Jack Roy,3 Frederick H. Epstein, Ph.D.,3 Brent A. French.2 1Plastic Surgery, University of Virginia, Charlottesville, VA, USA, 2Biomedical Engineering, University of Virginia, Charlottesville, VA, USA, 3Radiology, University of Virginia, Charlottesville, VA, USA.
Introduction: Regenerative cell therapies hold great promise for treating myocardial infarction (MI); however, an optimal cell source for translating this promise to the clinical realm remains to be determined. The use of embryonic stem cells presents several ethical and practical issues, including adequacy of supply and non‐autologous tissue responses. Adult stem cells offer a less controversial, and potentially autologous solution. However, their utility may be restricted by a limited range of developmental plasticity and an inadequacy of supply. Recently, we and others have demonstrated the existence of multipotent progenitor cells within human subcutaneous adipose tissue (Zuk et al., [Citation2001]). These cells have the capacity for extensive growth, renewal and can differentiate in vitro along ectodermally‐ and mesodermally‐derived lineages. Moreover, adipose tissue represents an abundant, autologous source of cells which can be easily and safely harvested.
Purpose: The purpose of the current study was to non‐invasively track the fate of SPIO‐labeled Human Adipo‐derived Multipotent Progenitor (HAMP) cells to determine whether they could successfully engraft into infarcted myocardium. Towards this end we employed immunodeficient mice and a murine model of MI (Ross et al., [Citation2002]).
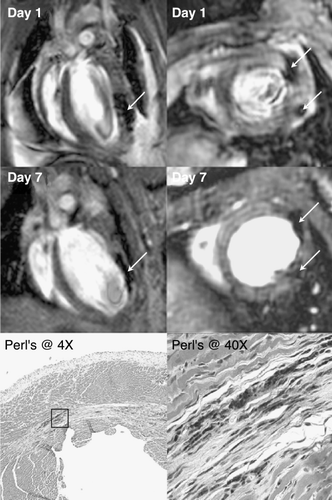
Methods: HAMP cells were isolated from clinical liposuction samples and cultured using published methods (Zuk et al., [Citation2001]). Cells at early passage (3–5) were split and plated at high density. One day later, the HAMP cells were loaded with iron (Frank et al., [Citation2002]) using complexes of Feridex (Berlex) and Lipofectamine (Gibco). Two‐three days after iron transfection, the cells were trypsinized, resuspended and counted. SCID‐beige mice (n = 4, male) were anesthetized and subjected to 1 hr of coronary occlusion followed by reperfusion. At 20 min post‐reperfusion, HAMP cells were injected under direct vision into the infarcted left ventricular wall via two separate injections of 9–11 microliters each (approx. 100–150 k cells per heart). CMR images were acquired using a 4.7 T Varian scanner with a birdcage quadrature RF coil at baseline and on post‐operative Days 1 and 7. At baseline, the imaging protocol included cine FLASH MRI with flip angle = 30°, TE = 3.2 ms, TR = 8–10 ms, FOV = 30 mm, matrix = 128 × 128 and slice thickness = 1mm, resulting in 14 phases across the cardiac cycle. For Day 1 scanning, Gd‐DTPA (0.6 mmol/kg, IP) was infused and infarct‐detection imaging was performed 15–20 minutes later using FLASH MRI with flip angle = 60° for greater T1 weighting. In separate control experiments, two normal (non‐infarcted) mice were similarly injected with HAMP cells and assessed by CMR at one month post‐injection. After imaging, the hearts were removed and assessed histologically for the presence of iron using Perl's stain.
Results: In all six mice, the presence of iron could be confirmed at the organ level by CMR (as hypoenhanced regions) or at the microscopic level (as blue‐staining iron inclusions) using Perl's stain (). The injection of microliter volumes was found to create dissection planes in the mouse heart that ran parallel to fiber orientation (particularly in infarcted hearts). As a result, the deposition of HAMP cells also favored fiber orientation.
Figure 1. (View this art in color at www.dekker.com.)
Conclusions: HAMP cells can be labeled intracellularly with SPIO nanoparticles using lipofection and tracked in vivo using CMR. HAMP cells engrafted into both normal and infarcted myocardium and were found to persist for at least one month post‐injection. The distribution of HAMP cells after direct injection into the myocardium is largely determined within 24 hr of injection, with their location changing little thereafter. However, a trend towards a decrease in the size of the hypointense regions was noted over time.
118. Dobutamine Stress Cardiac Magnetic Resonance Imaging (CMR) in Children and Young Adults After Correction of Tetralogy of Fallot (TOF)
W.J.B.W. van den Berg,1 P.A. Wielopolski,2 P.M.T. Pattynama,2 R.J. van Geuns,3 F.J. Meijboom,3 A.J. Bogers,4 M. Dalinghaus,1 W.A. Helbing.1 1Paediatric Cardiology, Erasmus Medical Centre, Location Sophia Children's hospital, Rotterdam, Netherlands, 2Radiology, Erasmus Medical Centre, Location Dijkzigt, Rotterdam, Netherlands, 3Cardiology, Erasmus Medical Centre, Location Dijkzigt, Rotterdam, Netherlands, 4Cardio‐Thoracic Surgery, Erasmus Medical Centre, Location Dijkzigt, Rotterdam, Netherlands.
Introduction: Pulmonary regurgitation (PR) is a frequently encountered sequel after corrective surgery for TOF. Longstanding PR leads to systolic and diastolic biventricular dysfunction. CMR combined with physical stress has been used to study biventricular response to exercise. Such a protocol demands a highly co‐operative patient with sufficient motor skills, making it less feasible in children. Pharmacological stress with an inotropic drug may be a good alternative but has not been used in children with congenital heart disease. We used a low dose dobutamine stress protocol. All patients underwent an incremental maximal bicycle exercise test after CMR.
Purpose: To determine biventricular response to stress using CMR and low dose dobutamine stress. To correlate CMR outcomes with outcomes of maximal incremental exercise‐testing.
Methods: Twenty patients operated for TOF (mean age 17,0 ± 4,9 years, range 7,4 to 23,2 years, mean age at repair 1,0 ± 0,7 years) underwent CMR at rest, and during low dose dobutamine stress (maximum dose 7,5 γ). A 1,5 T GE Signa CV/i scanner and a torso array coil were used. Ventricular volumetric datasets covering both ventricles were derived in short axis direction using a multiphase, multislice, fast gradient‐echo technique (FIESTA: SL = 8 mm/Spacing = 1 mm/α = 45 deg/TR = 3,4–3,6/TE = 1,3/FOV = 30–36 cm). On short axis data, EDVi, ESVi, SVi and EF were measured. Phase Velocity Cine (PVC) MR was used to measure flow across the tricuspid and pulmonary valve orifices. Maximal incremental bicycle exercise testing was performed according to the Godfrey protocol. Respiratory measurements were recorded during the test.
Results: CMR Results—No serious adverse effects of dobutamine were seen. Heart rate (HR) (/min) increased from 75 ± 12 in rest to 89 ± 16 during stress (p < 0,001). Right ventricular measurements at rest and with stress: RVEDVi(ml/m2) 127 ± 40 vs. 122 ± 36 (p < 0,05); RVESVi 66 ± 28 vs. 50 ± 24 (p < 0,001); RVSVi 62 ± 13 vs. 73 ± 15 (p < 0,001); RVEF(%)50 ± 8 vs. 61 ± 8 (p < 0,001). Left ventricular measurements at rest and with stress: LVEDVi 78 ± 11 vs. 75 ± 12 (p = 0,07); LVESVi 34 ± 9 vs. 21 ± 7 (p < 0,001); LVSVi 45 ± 7 vs. 54 ± 8 (p < 0,001); LVEF 57 ± 8 vs. 72 ± 7 (p < 0,001). PR measurements at rest and with stress: PRi(ml) 22 ± 13 vs. 25,6 ± 17,5 (p < 0,001); PR(%) 32 ± 17 vs. 31 ± 18 (p = 0,26). Bicycle‐ergometry Results—The test was stopped at submaximal levels in two patients: n = 1 with insufficient height and n = 1 with respiratory limitations. The percentage of predicted maximal workload (Watts) was 88 ± 13% (n = 18); max. HR 184 ± 13/min; max. VO2/kg 37,8 ± 9,0 ml/kg/min; respiratory quotient at max exercise 1,2 ± 0,1. No arrhytmias were noted. A signifincant difference was noted for achieved percentage of predicted maximal workload in patients with PR < 30% versus patients with PR ≥ 30% (98 ± 6 vs 81 ± 13%, p < 0,05). Correlations—Positive correlations with percentage of reached predicted workload were found for: RVEF at rest (r = 0,59 p < 0,01), RVEF during stress (r = 0,61 p < 0,01) and LVEF at rest (r = 0,46 p < 0,05). Negative correlations were found for: PR percentage during stress (r = − 0,60, p < 0,01), RVEDVi in rest (r = − 0,61 p < 0,05), RVESVi in rest (r = − 0,74 p < 0,01) and RVESVi during stress (r = − 0,62 p < 0,01).
Conclusions: LV measurements in our population are in agreement with earlier reports. In contrast to earlier studies in TOF patients, the normal systolic RV response to stress and unchanged PR(%) in our patients, operated on at a relatively young age, are remarkable. Patients with PR(%) over 30% perform significantly worse in maximal exercise testing. All patients with exercise capacity below 80% of predicted workload had a PR(%) of over 30% in rest. CMR derived cut of points could play an important role in future clinical decision‐making on timing of pulmonary valve replacement.
119. Reproducibility of Acute and Chronic Infarct Size Measurement by Contrast‐Enhanced Magnetic Resonance Imaging
Mathias J. E. Kappl, Gerhard Schuler, Holger Thiele. Cardiology, University of Leipzig—Heart Center, Leipzig, Germany.
Introduction: Using mortality as a primary study endpoint in studies comparing different reperfusion strategies in patients with an acute myocardial infarction requires increasingly large sample sizes of several 1000 patients to test advances with existing therapy. Recently, there has been growing interest in infarct size measurements as a surrogate endpoint, thus allowing a much smaller sample size. Delayed enhancement MRI allows the direct visualization of infarcted or necrotic tissue at the highest spatial resolution in comparison to other imaging techniques and may therefore be the optimal imaging method to assess infarct size. However, a low intra‐, interobserver variability and reproducibility is mandatory for this purpose. So far, the reproducibility of contrast‐enhanced MRI has been established only for chronic infarcts and for measurement within one day without a second injection of the contrast agent.
Purpose: To asses the reproducibility of infarct size measurements in a group of patients with acute and chronic myocardial infarction scanned at subsequent days with a second contrast agent injection.
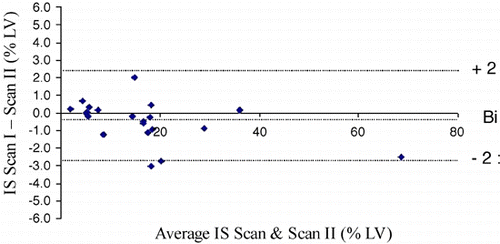
Methods: In 21 patients, 10 with acute and 11 with chronic myocardial infarction cine loops of the complete heart in short and horizontal long‐axis planes were acquired using a steady‐state free precession technique (TR/TE/flip = 3.2/1.2/60). Furthermore, delayed enhancement images covering the whole ventricle were acquired 10–20 min after a double‐bolus of Gadolinium‐BOPTA (Gadovist, Schering, Germany) using a 3 D inversion recovery gradient echo sequence (TR/TE/flip 2.8/1.1/15). All patients underwent a repeat measurement of left ventricular function and infarct size the subsequent day, starting with new scout images and using the same dose of the contrast agent. Infarct size was determined as the percentage of the left ventricular mass by two independent observers. Inter‐, intraobserver variabilities and reproducibility were assessed according to standard definitions and compared by the method of Bland and Altman. Image quality was assessed by a score ranging from 0–4 (0 = not assessable; 4 = optimal image quality).
Results: All images were suitable for assessment. Mean image quality for functional images was 3.4 and 3.1 for delayed enhancement images. Mean ejection fraction was 48 ± 18%, mean percentage infarct size was 16.7 ± 14.0% (range 2.1–68.7%). Acute and chronic infarct sizes were 16.9 ± 17.7% (range 4.9–69.8) and 16.6 ± 10.1% (range 2.0–40.3), respectively. In 4 patients with acute myocardial infarction there was evidence of microvascular obstruction. The difference in infarct size (bias) between scan I and scan II was − 0.5% LV and the limits of agreement were ± 2.4% of left ventricular mass (). The mean bias (− 0.6%) and the limits of agreement (± 3.2%) were slightly higher for acute infarcts in comparison to chronic infarcts with − 0.4% ± 1.3% of the total left ventricular mass. There were no significant differences in reproducibility for patients with good (score 3–4) and impaired (score 0–2) image quality. Intra‐ and interobserver variability was low with a mean bias of 0.8 (limits of agreement ± 2.6) and − 1.0 (limits of agreement ± 3.1), respectively. Using previously published data on SPECT repeatability (bias − 1.3%, limits of agreement ± 4.0%) the number of patients treated to detect differences between reperfusion strategies could be reduced by 30% in clinical trials by the use of delayed enhancement MRI.
Figure 1. (View this art in color at www.dekker.com.)
Conclusions: Infarct size measurement by delayed enhancement MRI is an excellent tool for infarct size assessment due to its excellent repeatability in chronic and acute infarctions even in case of an impaired image quality. It has therefore the potential to serve as a surrogate endpoint to uncover advantages of new reperfusion strategies and allows a further reduction in the sample size of clinical trials.
120. Geometry, Scar Patterns, and Regional Function of the Left Ventricle in the Development of “Ischemic” Mitral Regurgitation
Monvadi B. Srichai, M.D.,1 Abigail Lara, M.D.,1 Michael L. Lieber, M.S.,1 Jane M. Kasper, R.N.,1 Richard A. Grimm, D.O.,1 Arthur E. Stillman, M.D., Ph.D.,2 Patrick M. McCarthy,3 Richard D. White, M.D.2 1Cardiovascular Medicine, Cleveland Clinic Foundation, Cleveland, OH, USA, 2Cardiovascular Medicine and Radiology, Cleveland Clinic Foundation, Cleveland, OH, USA, 3Cardiothoracic Surgery, Cleveland Clinic Foundation, Cleveland, OH, USA.
Introduction: Mitral regurgitation (MR) is a common complication of ischemic heart disease and its presence is an indicator of adverse outcomes. The mechanism of ischemic MR is not fully understood, but experimental studies suggest dysfunction of the papillary muscles and the underlying myocardium contribute to its development.
Purpose: This aim of this study was to discern left ventricular (LV) and mitral valve geometric and functional measurements important to the development of mitral regurgitation (MR) in patients with chronic ischemic heart disease (CIHD).
Methods: Thirty‐two patients with varying degrees of MR determined by echocardiography and referred for magnetic resonance imaging for assessment of CIHD were included. Volumetric and geometric distance measurements of the LV and mitral valve apparatus were calculated at end systole. Extent of hyper‐enhancement (HE) on delayed‐enhanced contrast magnetic resonance images was used to determine degree of infarct scarring in the regions of interest with the following scale: 0: no HE, 1: 1–24% HE, 2: 25–49% HE, 3: 50–74% HE, 4: 75–99% HE, 5: 100% HE. Regional wall function was measured according to the following scale: 1‐normal, 2‐hypokinetic, 3‐akinetic/dyskinetic.
Results: See Tables and .
Table 1. Functional and Geometric Indices of the Left Ventricle
Table 2. Functional and Geometric Indices of the Mitral Valve Apparatus
Conclusions: The degree of MR in patients with CIHD correlates with global and regional LV geometry and function. Increased scarring with accompanying dysfunction of the infero‐posterior wall and associated deformation of the mitral valve apparatus, further contributes to the degree of MR.
121. The Anatomical Basis of Q‐Wave vs. Non‐Q‐Wave Myocardial Infarction
James C. C. Moon,1 Diego Perez,1 Andrew G. Elkington,1 Anil K. Taneja,1 Raj Janardhanan,2 Roxy Senior,2 Philip A. Poole‐Wilson,3 Dudley J. Pennell.1 1Department of MRI, Royal Brompton Hospital, London, United Kingdom, 2Department of Cardiology, Northwick Park Hospital, London, United Kingdom, 3Department of Cardiology, Royal Brompton Hospital, London, United Kingdom.
Introduction: The nature of Q‐wave (QW) and non‐Q‐wave (NQW) myocardial infarction (MI) remains controversial, principally because of debate over transmurality.
Purpose: We hypothesized that measurement of MI extent and transmurality by gadolinium enhanced Cardiovascular Magnetic Resonance (CMR) would identify the pathological basis of Q waves.
Methods: 100 consecutive patients with previous infarction (recent, n = 33, chronic, n = 41, multiple, n = 17, LBBB precluding Q wave analysis, n = 9) underwent ECG and CMR. The total extent of infarction, degree of transmural infarction and ECG classification as QW/NQWMI was determined in 3 territories and correlated.
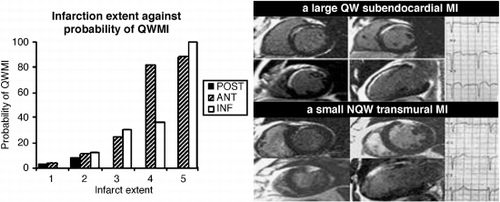
Results: Subendocardial infarcts could be QWMIs (28%); transmural infarcts could be NQWMIs (29%). However, as infarct extent and number of transmural segments increased, the probability of the classification as QWMI increased: (anterior territory, extent chi2 = 53, p < 0.0001, transmurality chi2 = 36, p < 0.0001; inferior territory, extent chi2 = 16, p = 0.001, transmurality chi2 = 10, p = 0.001). These findings did not hold for posterior MI. In a multivariate model, transmurality of infarction was not an independent predictor when extent of infarction was taken out. The QW/NQWMI classification was a good test for size of infarct. (area under ROC curve: anterior 0.9, inferior 0.77) ().
Figure 1.
Conclusions: The total extent of infarction rather than the transmurality determines classification as QW/NQWMI. QW/NQWMI is a good test for transmurality of infarction, but a better test of infarct extent.
122. Assessment of Viability in Patients with Chronic Total Occlusions
Han W. Kim,1 Dipan J. Shah, MD,2 Manesh R. Patel, MD,3 David Kandzari, MD,4 Brenda Hayes, RCIS,3 John F. Heitner, MD,3 Michele A. Parker, MS,3 Francis Klocke,5 Robert M. Judd, PhD,6 Raymond J. Kim, MD.3 1Cornell University Medical Center, New York, NY, USA, 2Nashville Cardiovascular Magnetic Resonance Institute, Nashville, TN, USA, 3Duke Cardiovascular Magnetic Resonance Center, Durham, NC, USA, 4Duke University Medical Center, Durham, NC, USA, 5Feinberg Cardiovascular Research Institute, Chicago, IL, USA, 6Duke Cardiovascular Magnetic Resonance Center, Durham, NC, USA.
Introduction: Conventional thinking has been that patients (pts) with chronic total occlusions (CTO) do not have significant myocardial viability (MV) and may not benefit from revascularization. Current contrast (ce) MRI techniques can assess MV with high spatial resolution and accuracy. We sought to determine if significant MV is present in CTO perfusion territories.
Methods: We studied 44 pts with 58 CTO territories (35 M, 9W; age 63 ± 11 years; EF 48 ± 18%. All pts underwent baseline (BL) cine and ce‐MRI (10 minutes after 0.15 mmol/kg gd). Cine and ce‐MRI were scored for regional wall thickening and amount of infarction; coronary angiograms were read for CTO perfusion territory and extent of collaterals using the Rentrop (4 point) scoring scheme. Furthermore, to determine if ce‐MRI findings predicted functional improvement, 19 pts with 24 CTO territories underwent follow up cine‐MRI 3 months after revascularization.
Results: At baseline, of the 58 CTO territories, only 21 (36%) had > 50% infarction, 37 (64%) had < = 50% infarction; furthermore 12 (21%) had no infarction at all within the CTO territory. At follow up the presence of normal or improved contractile function in the 24 CTO territories that were revascularized was inversely related to the transmural extent of infarction (). Extent of collateral flow did not relate to amount of MV at BL (p = 0.90), or to improvement after revascularization (p = 0.85).
Figure 1.
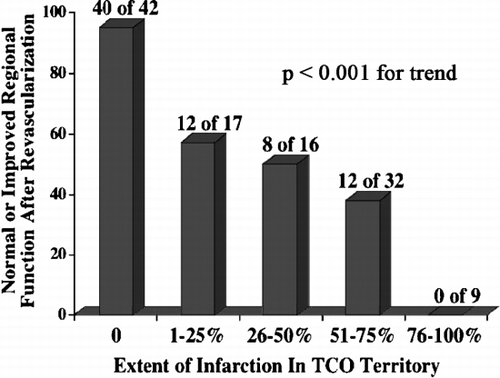
Conclusion: The majority of CTO territories have a significant amount of viable myocardium detectable by ceMRI, independent of collateral flow grade. These viable territories demonstrate functional improvement if myocardial blood flow is restored.
123. The Apparent TI Time for Optimal MDE Imaging Differs Between the Right and Left Ventricles
Milind Y. Desai, MD,1 Chandra Bomma, MD,1 Harikrishna Tandri, MD,1 Thomas Foo, PhD,2 Joao A. C. Lima, MD MBA,1 David A. Bluemke, MD PhD.2 1Cardiology, Johns Hopkins Hospital, Baltimore, MD, USA, 2Radiology, Johns Hopkins Hospital, Baltimore, MD, USA.
Background: Delayed post contrast magnetic resonance (MR) imaging is a relatively new technique used to assess myocardial viability. This technique involves suppression of signal from the normal myocardium using inversion times (TI) in the range of 150–225 ms. In this TI range, the normal myocardium appears dark and the nonviable, fibrotic scar appears very bright because of differential washout kinetics of the gadolinium chelate. However, we noticed that at a TI optimized for maximal signal suppression of the left ventricle (LV), the signal from the right ventricle (RV) appeared distinctly brighter, a finding that has not been described before.
Purpose: The purpose of this study was to evaluate the TI for maximal myocardial signal suppression in the RV compared to the LV, and to try and identify the cause of this observation.
Methods: We studied 26 patients (ages ranged from 17–79 years, 13 females) referred to our MR laboratory for assessment of myocardial structure, function and viability. All patients had an MR scan on 1.5 T General Electric scanner. Delayed post contrast short axis images were obtained 10–15 minutes after injection of 0.2 mmol/kg of intravenous gadolinium chelate. TI optimization was performed with a pulse sequence that acquired a range of TI times within a single breath‐hold, typically in increments of 25 msec. The TI time that resulted in lowest signal for the RV and LV was recorded.
Results: The TI ranged from 150–225 ms in all the patients. We observed that at the optimum TI for LV suppression, the signal from the RV was significantly more intense than the LV signal in all the patients (26/26). Conversely, at the TI to maximally suppress the RV signal, the LV showed suboptimal suppression. (TI time of 200 ms to suppress the LV) and (TI time of 150 ms to suppress the RV) demonstrate the observation in the same patient. The TI times required to suppress the RV were usually less than or equal to 150 ms. The increased signal from the anterior surface coil was eliminated by using the body coil, but the results were similar.
Figure 1.
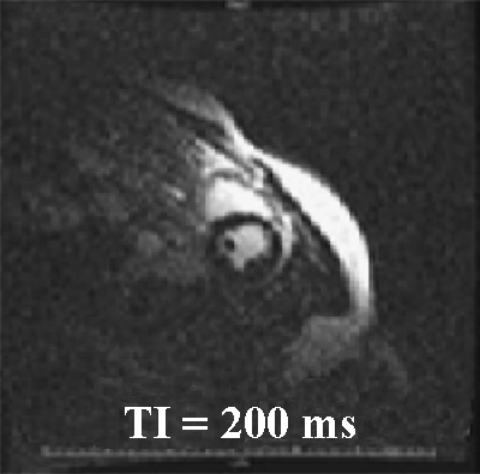
Figure 2.
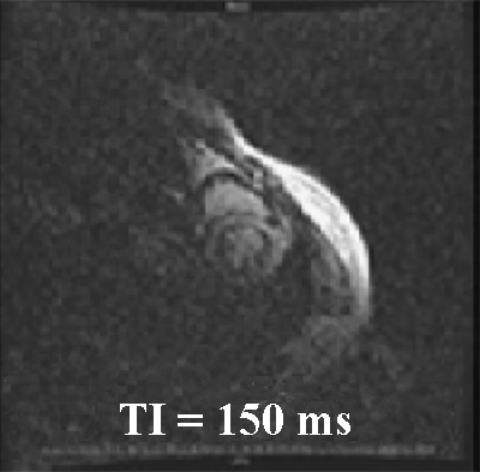
Conclusion: The apparent TI for maximal myocardial signal suppression appears to be different between LV and RV. It does not seem to be due to the anterior coil artifact. Potential mechanisms include partial volume averaging with fat or blood pool (related to increased trabeculation) in the RV, due to the thin structure of the RV. Alternatively, increased blood pool signal within thebesian veins in the RV compared to the LV leads to altered TI times due to similar partial volume effects. Further evaluation is needed to identify the etiology of the altered T1 signal in the RV, and to develop optimal schemes for TI optimization of the RV.
124. Early N‐Terminal Pro Brain Natriuretic Peptide Release in Acute Coronary Syndromes is Directly Related to Infarct Size Measured by Contrast Enhanced Cardiac Magnetic Resonance Imaging
Thomas N. Martin,1 John James Morton,2 Tracey Steedman,1 John Edward Foster,1 Alex T. Elliott,1 Henry J. Dargie,1 Bjoern Aaris Groenning.1 1Glasgow Cardiac Magnetic Resonance Unit, Glasgow, United Kingdom, 2Glasgow University, Glasgow, United Kingdom.
Introduction: The plasma concentration of N‐terminal pro Brain Natriuretic Peptide (NTBNP) is elevated post Acute Coronary Syndromes (ACS) and is able to predict the degree of left ventricular remodeling. However it remains unclear whether NTBNP release is due to myocardial necrosis or wall stress (measured by an increase in LV dimensions).
Purpose: The purpose of this study was to assess the relationship between early NTBNP and infarct size using rest contrast enhanced Magnetic Resonance imaging (ceMR).
Methods: 36 male and 18 female (median (range) age = 61 (34–83) years index hospital admissions with ACS (22 ST elevation myocardial infarctions (treatment: primary thrombolysis) and 30 Non ST elevation myocardial infarctions (treatment: conservative)) were consecutively recruited. Patients excluded if percutaneous coronary intervention prior to ceMR, serum creatinine > 200 µmol/l or history of chronic renal failure, hypertension, cardiomyopathy, significant valve disease or cor pulmonale. Blood sampling for troponin I (TnI) took place 8–12 hours following onset of chest pain. Samples for serum creatinine and NTBNP (Elecsys 2010 using a Roche NTproBNP assay, plasma stored at − 70°C and analysed as a single batch) were taken immediately pre ceMR which was performed at a median (range) of 69 (16–120) hrs on a Siemens Sonata 1.5 T system using a phased array chest coil. LV dimensions were evaluated by cinematographic (TrueFISP) breath‐hold sequence. ceMR was performed 10 minutes after injection of 0.2 mmol/kg gadolinium‐DTPA using a breath‐hold segmented turbo FLASH inversion‐recovery sequence. Images were evaluated by planimetry by 2 independent and blinded observers and the consensus used.
Results: Basic haemodynamic measures were within normal limits (mean (SD) heart rate 54 (11) bpm, systolic BP 122 (19) mmHg and diastolic BP 76 (12) mmHg) and renal function was preserved (creatinine 98 (22) µmol/l). Log NTBNP (median (range 3.03 (1.9–3.96) pg/l) strongly correlated with hyperenhancement volume (mean (SD) 27 (25) ml: r = 0.55, p < 0.0001 but less well with TnI (median (range) 16.2 (0.3–417) µg/ml): r = 0.34, p = 0.01. TnI correlated strongly with hyperenhancement volume: r = 0.6, p < 0.0001. Log NTBNP was unrelated to LV ejection fraction (mean (SD) 56 (10) %), LV mass (130 (36) g), LV end diastolic (137 (35) ml) or end systolic (60 (23) ml) volumes ().
Figure 1.
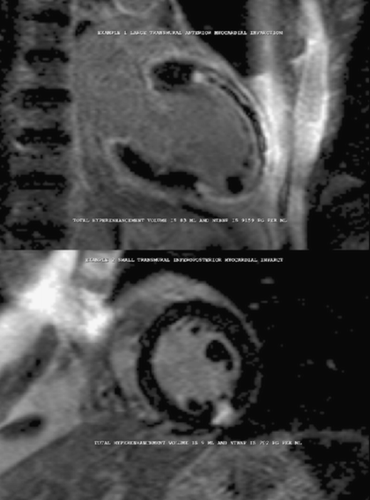
Conclusions: In patients with ACS there is no relationship between early NTBNP concentration and overall LV function or dimensions. The amount of myocardium damaged, assessed using ceMR, correlates strongly with an early increase in both plasma NTBNP and TnI. However the correlation between NTBNP and TnI is not as strong suggesting that there is an additional mechanism underlying its release.
125. ST Segment Resolution, Time from Symptom Onset to Reperfusion, TIMI Flow Grades, and CK‐Release: Association with Infarct Size as Assessed by Delayed Enhancement Magnetic Resonance Imaging
Holger Thiele, Mathias J. E. Kappl, Kazem Rahimi, Peter Sick, Josef Niebauer, Gerhard Schuler. Cardiology, University of Leipzig—Heart Center, Leipzig, Germany.
Introduction: The TIMI flow, the ST‐segment resolution and the time from symptom onset to reperfusion are associated with mortality after an acute myocardial infarction either after thrombolysis or mechanical reperfusion.
Purpose: We hypothesized that these measures would also be associated with infarct size by delayed enhancement magnetic resonance imaging (MRI).
Methods: In the Leipzig prehospital thrombolysis study patients with an acute myocardial infarction were randomized to either a prehospital thrombolytic therapy (n = 70) or a prehospital initiated facilitated PCI after prehospital thrombolysis (n = 71). Time from symptom onset to reperfusion, ST‐segment resolution at 90 min., CK‐release as area under the curve over 3 days, and the CK max were assessed for all patients. In those patients randomized for facilitated PCI the TIMI‐flow grade pre and post PCI was assessed additionally. ST‐segment resolution was defined as complete (> = 70%), incomplete (< 70% to 30%), or no resolution (< 30%).
At 6 months follow‐up in 114 patients cine loops of the complete heart in short and horizontal long‐axis planes were acquired using a steady‐state free precession technique (TR/TE/flip = 3.2/1.2/60). Additionally, delayed enhancement images covering the whole ventricle were acquired 10–20 min after a double‐bolus of Gadolinium‐BOPTA (Gadovist, Schering, Germany) using a 3 D inversion recovery gradient echo sequence (TR/TE/flip 2.8/1.1/15) with the inversion time adapted to null normal myocardium. Infarct size was determined as the percentage of the left ventricular mass.
Results: The correlation of the infarct size was excellent for MRI in comparison to the CK release, either assessed as area under the curve or the CK max (r = 0.90 and r = 0.89, p < 0.001). The time interval between symptom onset to reperfusion had a significant effect on final infarct size (r = 0.37, p = 0.005). The ST‐segment resolution also correlated significantly with the final infarct size (r = − 0.35, p = 0.005). In the groups with complete, partial, and no resolution the final infarct size was 14.5 ± 9.3%, 14.2 ± 8.8%, and 6.7 ± 7.8% (p < 0.001), respectively. In patients with facilitated PCI the preinterventional TIMI flow correlated with final infarct size. Infarct sizes for TIMI flow 0–I versus II–III were 11.4 ± 6.9 versus 5.6 ± 5.1% (p = 0.03) of the left ventricular mass. After adjustment for baseline characteristics, ST‐segment resolution was the strongest predictor of final infarct size (p = 0.009) after the type of reperfusion, facilitated PCI, or prehospital thrombolysis (p < 0.001).
Conclusions: Early resolution of ST‐segment elevation, time from symptom onset to reperfusion and TIMI flows before PCI correlate with the final infarct size as assessed by delayed enhancement MRI. This underlines the assumed pathophysiological link between early restoration of the flow and perfusion in the infarct related artery that may explain why these early angiographic and ECG measures are associated with long‐term survival.
126. Contrast MRI Predicts Reverse Remodeling and Contractile Improvement in Akinetic Thinned Myocardium
Dipan J. Shah, MD,1 Han W. Kim, MD,2 Michael Elliott, MD,3 Edwin Wu, MD,4 Binit B. Shah, B.S.,3 Louise E. J. Thomson, MBChB,3 Igor Klem, MD,3 Michele A. Parker, MS,3 Robert O. Bonow, MD,4 Robert M. Judd, PhD,3 Raymond J. Kim, MD.3 1Nashville Cardiovascular Magnetic Resonance Institute, Nashville, TN, USA, 2Cornell University Medical Center, New York, NY, USA, 3Duke Cardiovascular Magnetic Resonance Center, Durham, NC, USA, 4Northwestern University Feinberg School of Medicine, Chicago, IL, USA.
Introduction: Prior studies suggest that akinetic myocardium which is thinned (< = 5.5 mm) is not viable and cannot improve in contractile function even after revascularization (RVS). Current cine (c) and contrast (ce) MRI techniques can assess end diastolic wall thickness (EDWT), systolic wall thickening (SWT), and myocardial viability (MV) with high spatial resolution. We sought to determine if significant MV (= 50% transmural thickness) occurs in thinned myocardial regions.
Methods: We evaluated 21 patients (pts), 16 men and 5 women, with chronic CAD and large areas of thinned myocardium (15 ± 6% of LV), age 63 ± 13 years, EF 31 ± 10%, who underwent RVS. All pts underwent baseline (BL) c‐MRI and ce‐MRI (10 minutes after 0.15 mmol/kg Gd), and follow up (FU) c‐MRI 99 ± 70 days after RVS. Patients were subdivided based on extent of viability by ce‐MRI in the thinned region: group A, < 50% viable; and group B, ≥ 50% viable. The interval between RVS and the FU scan was not different between the 2 groups.
Results: The 14 pts in group A demonstrated limited MV (31 ± 12%) in the thinned region while the 7 pts in group B exhibited significant MV (73 ± 13%) in the thinned region. Group A demonstrated no significant change in EDWT (4.9 ± 0.5 mm vs. 5.0 ± 0.5 mm, p = 0.28) or SWT (0 ± 7% vs. 1 + 5%, p = 0.51) after RVS (). Group B exhibited a significant increase in EDWT (4.7 ± 0.5 mm vs. 7.6 ± 1.0 mm, p < 0.001) and SWT (− 2 ± 14% vs. 28 ± 18%, p < 0.001) after RVS (). There was a linear relationship between the amount of MV in the thinned akinetic region and the change in EDWT (r = 0.84, p < 0.001) and SWT (r = 0.83, p < 0.001) after RVS.
Figure 1.
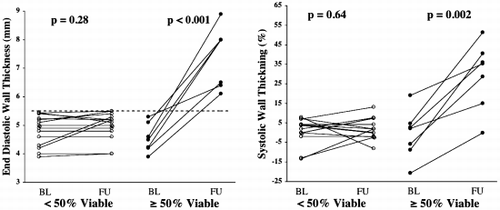
Conclusion: Patients with severely thinned, akinetic myocardium may have significant amounts of MV in these regions. These viable regions demonstrate marked improvement in EDWT and SWT following revascularization.
127. Additional Low‐Dose Dobutamine Predicts Segmental Improvement Six Months After Bypass Surgery Better Than Late Gadolinium Enhancement Alone
Anna S. John,1 John R. Pepper,2 Dudley J. Pennell.1 1CMR Unit, Royal Brompton Hospital, London, United Kingdom, 2Cardiothoracic Surgery, Royal Brompton Hospital, London, United Kingdom.
Background: Patients with coronary artery disease and impaired left ventricular function face considerable morbidity and mortality from bypass surgery. It is therefore important to stratify which patients are likely to benefit from surgery. Traditionally, low dose dobutamine has been used to determine myocardial recruitability which has been shown to predict functional improvement post‐operatively. More recently, late gadolinium enhancement studies have been used to detect viable myocardium which has also been shown to predict recovery of function. We investigated both techniques in terms of prediction of segmental functional recovery.
Methods: Eleven patients with impaired LV function awaiting bypass surgery underwent CMR before and six months after surgery. Patients were scanned on a Siemens Sonata 1.5 T scanner using standard TrueFISP cines in long and short axis orientations at rest and during low‐dose dobutamine (10 mcg/kg/min) followed by late gadolinium enhancement (0.1 mmol/kg). Images were analysed using a standard 17 segment model. Segments with < 50% transmural gadolinium extent were classified as viable. Segments with resting wall motion abnormality not matched by gadolinium uptake were classified as hibernating and grouped into dobutamine responsive (positive) and non‐responsive (negative) segments.
Results: 50 of the hibernating segments were dobutamine positive, and 24 segments were dobutamine negative.
At 6 months follow‐up after revascularisation, 68% of the hibernating (dobutamine positive) segments showed functional improvement at rest, versus 29% of the hibernating (dobutamine negative) segments (p = 0.002).
However, when dobutamine stimulation was used at 6 months follow‐up to examine for recruitable contractile reserve in segments which had failed to improve at rest, this was found in 100% of the remaining dobutamine positive segments, and 64% of the remaining dobutamine negative segments (p = 0.02). In total, 100% of the dobutamine positive segments improved either rest or stress function at follow‐up, compared with 67% of the dobutamine negative segments (p < 0.0001).
Conclusion: In segments identified as being hibernating by late gadolinium enhancement CMR, those with a positive dobutamine response pre‐operatively have a significantly higher likelihood of showing normalisation of resting function at 6 months after bypass surgery.
In the segments with unchanged resting function at 6 months follow‐up, recruitable contractile reserve was present more frequently in the dobutamine positive versus the dobutamine negative segments.
These findings suggest that at 6 months, examination of resting function alone considerably underestimates recovery of function. Also, in segments identified as hibernating by late gadolinium enhancement, those which are dobutamine negative have a significantly lower likelihood of functional recovery at 6 months. Longer term follow‐up is required to determine whether these segments will ultimately show functional improvement, as these segments may have severe ultra‐structural cellular changes that require a prolonged recovery phase.
128. Adenosine Stress Myocardial Perfusion Magnetic Resonance Imaging: Initial Experience in a Community Imaging Center
Scott E. Bingham, MD, Caleen Johnson, RT, Shelly Mitchell, RT, Nicole Smith, Douglas Smith, MD. CUMC Imaging, Provo, UT, USA.
Introduction: The accuracy of adenosine stress myocardial perfusion magnetic resonance imaging (adenosine CMR) has been demonstrated in academic centers, typically using quantitative analysis of first‐pass contrast signal intensity curves to predict angiographic coronary disease. Simple visual inspection of first‐pass perfusion images may be an accurate and more feasible approach in a community practice.
Purpose: To determine the predictive accuracy and reproducibility of visual inspection of adenosine CMR in a community imaging center.
Methods: 138 patients were referred for adenosine CMR from July 2002 to May 2003. After informed consent, adenosine was infused in a periperal vein for 2 minutes before injection of gadoversetamide 0.05 mmol/Kg at 3 cc/second. An ECG triggered interleaved notched saturation echo‐planar sequence was performed on a 1.5 T magnet (Twinspeed Zoom Mode, General Electric Medical Systems, Milwaukee, Wisconsin). 5 to 7 short axis left ventricular slices were obtained over 2 cardiac cycles during the first‐pass of contrast in the left ventricle. All patients also underwent functional imaging and myocardial delayed enhancement imaging after a total of 0.2 mmol/Kg of gadoversetamide was given. Inversion time was carefully selected to null normal myocardium. After the adenosine CMR results were reported, 32 patients subsequently underwent xray coronary angiography at the discretion of their referring physician. All CMR images were read twice: once prior to angiography, and again several months later blinded to previous adenosine CMR interpretation, clinical and angiographic data. Criteria for ischemia were: 1) subendocardial defect within a coronary perfusion territory more extensive than any delayed hyperenhancement zone; 2) persisting atleast 10 seconds after first myocardial contrast arrival; 3) seen in atleast 2 contiguous myocardial slices. A non‐protected 70% diameter xray angiographic coronary stenosis was judged to be significant by an angiographer blinded to the results of the adenosine CMR.
Results: Data from all 32 patients was used for analysis regardless of arrhythmia, prior infarction or bypass grafting. 24 patients had significant coronary stenosis. Compared to xray coronary angiography, initial reader and blinded reader adenosine CMR sensitivities were 92% and 88%, specificities were 75% and 88%, predictive accuracies were 81% and 78%, and ROC areas were 0.87 and 0.86. Intraobserver agreement was 93.75%, Kappa = 0.846 (95% confidence interval = 0.640–1.00).
Conclusions: Adenosine stress myocardial perfusion magnetic resonance imaging is a promising tool in the evaluation of patients with suspected CAD. Careful visual inspection of perfusion images can be successfully applied in a community practice.
129. Comprehensive Stress MRI Compared to Stress Echo in the Evaluation of Patients Presenting to the ED with Chest Pain
John Heitner, MD,1 Igor Klem, MD,1 Derek Rasheed, MS,1 James G. Jollis, MD,1 Abhinav Chandra, MD,1 Michele Parker, MS,1 Dipan J. Shah, MD,1 Louise Thomson, MBChB, FRACP,1 Brenda Hayes,1 Michael Elliott, MD,1 Jonathan Weinsaft, MD,1 Pete Cawley, MD,1 Anna Lisa Crowley, MD,2 Manesh Patel, MD,1 Robert M. Judd, PhD,1 Raymond J. Kim, MD.1 1Duke University, Durham, NC, USA, 2Duke Cardiovascular MRI Center, Duke University, Durham, NC, USA.
Introduction: Despite advances in diagnostic tools for acute coronary syndrome, there remains 4–5% of pts that are misdiagnosed and erroneously discharged from the ED.
Purpose: To compare a comprehensive stress MRI study, with rest and adenosine stress first pass perfusion, cine and contrast enhanced MRI (ceMRI), to stress echo (standard of care at our institution) for the detection of significant CAD (> 50% stenosis) in patients with chest pain (CP) presenting to the ED.
Methods: We prospectively enrolled 56 pts (29 F, age 55 ± 10) without a prior hx of cardiac disease who presented to the ED with CP and were deemed to be at intermediate risk (> = 2 risk factors) for CAD. Pts with a positive troponin, ST elevation or contraindication to MRI were excluded. All pts underwent both stress echo (exercise 49, dobutamine 7) and stress MRI; if either were positive on a clinical interpretation then coronary angiography (CA) was recommended. If both were negative, pts were discharged and followed for clinical events (unstable angina, myocardial infarction, or death). For adenosine stress MRI, a SR GRE‐EPI sequence was used (109 msec/slice;4–5 short axis slices per heart beat, 0.0625 mmol/kg of Gd). All MRI studies were scored again at a later date blinded to patient identity following randomization into a pool of studies from 125 pts. Perfusion MRI was interpreted qualitatively with the aid of cine and ceMRI. Only pts with > 50% stenosis on CA or clinical event on f/u, were considered to be true positives for CAD. True negatives were defined as < 50% stenosis by CA or negative stress echo and stress MRI with no clinical events on follow up.
Results: Sixteen pts underwent CA with 8 having significant CAD. None of the pts discharged from the ED had clinical events. See Tables and . The 5 patients that would have been discharged from the ED by the clinical stress echo interpretation, but went on for cardiac catheterization because of the stress MRI had the following results on cath: pt. A‐100% prox RCA; pt B‐99% mid LCx; pt C‐95% prox LAD; pt D‐100% prox RCA, 95% prox LAD; pt E‐60% mid LAD.
Table 1. Clinical Intrepretation
Table 2. Blinded Intrepretation
Conclusion: Comprehensive stress MRI has a higher sensitivity than stress echo in detecting CAD, without a significant reduction in specificity, for the evaluation of intermediate risk patients presenting to the ED with chest pain.
130. Multi‐component CMR Imaging Versus TIMI Risk Score for the Risk Stratification of Acute Coronary Syndromes
Sven Plein, Patrick Sparrow, John Greenwood, John P. Ridgway, Mohan U. Sivananthan. Cardiac MRI Unit, Leeds General Infirmary, Leeds, United Kingdom.
Introduction: A key clinical decision in the management of non‐ST elevation acute coronary syndromes (NSTE‐ACS) is to determine which patients require early revascularisation. Currently, algorithms such as the TIMI risk score, which is based on clinical and biochemical markers, are used to identify patients for such invasive management. Cardiac Magnetic Resonance (CMR) imaging can provide a wide range of information in patients with coronary artery disease (CAD).
Purpose: To evaluate the ability of CMR and the TIMI risk score to identify significant CAD requiring revascularisation in patients presenting with NSTE‐ACS.
Methods: Seventy‐two patients (56 men and 16 women, mean age 57.6 years, range 37–75 years) with a clinical diagnosis of NSTE‐ACS who were listed for in‐patient coronary angiography were recruited for the study. The diagnosis of NSTE‐ACS was based on the presence of suspected cardiac chest pain and/or abnormalities of the electrocardiogram (ST segment depression, T wave abnormalities or transient ST segment elevation). TIMI risk scores were calculated after recruitment to the study. CMR imaging was performed on a 1.5 T Philips scanner with a comprehensive single‐session protocol that assesses myocardial function, perfusion (at rest and Adenosine‐stress), viability (with delayed‐contrast enhanced imaging) and coronary artery anatomy. Visual analysis of all CMR data combined was performed. The accuracy of CMR and of the TIMI risk‐score to detect significant CAD (stenosis < 70% on x‐ray angiography) was determined.
Results: CMR imaging was completed in 69 of the 72 patients. The combined data analysis yielded a sensitivity of 96.4% and a specificity of 83.3% to predict the presence of significant CAD on x‐ray angiography. CMR analysis was significantly more sensitive than the TIMI risk score to predict CAD (TIMI risk score: sensitivity 50%, p < 0.05, specificity 83.3%, n.s.).
Conclusions: CMR imaging in NSTE‐ACS predicts the presence of significant CAD more accurately than the TIMI risk score. CMR could be used for the triage of patients to early‐invasive management or in combination with x‐ray angiography for a fully informed treatment of patients with NSTE‐ACS.
131. Clinical Evaluation of Patients with Suspected Coronary Artery Disease Using a Multimodality Stress MRI Protocol
Igor Klem, MD,1 John F. Heitner, MD,1 Dipan J. Shah, MD,1 Sherrie Spear,1 Michael H. Sketch, Jr, MD,1 Michele A. Parker,1 Michael Elliott, MD,1 Peter Cawley, MD,1 Udo Sechtem, MD,2 Robert M. Judd, PhD,1 Raymond J. Kim, MD.1 1Duke University Medical Center, Durham, NC, USA, 2Robert‐Bosch‐Krankenhaus, Stuttgart, Germany.
Introduction: Stress perfusion MRI (pMRI) requires high temporal resolution which limits image quality and potentially introduces artifacts. Visual, unlike quantitative analysis of pMRI is feasible in a clinical timescale although its accuracy may be limited.
Purpose: We hypothesized that a multimodality stress MRI protocol including information about wall motion and viability as assessed by cine and contrast enhancement MRI (ceMRI) results in improved diagnostic accuracy compared to pMRI alone. We aimed to test this clinically feasible, comprehensive stress MRI protocol for detection of significant stenosis in patients with suspected coronary artery disease (CAD).
Methods: We prospectively enrolled 69 consecutive pts (age 58.5 ± 11.2 yrs, 29 F) without prior history of cardiac disease who were referred for coronary angiography (CA). A comprehensive study including cine MRI, adenosine and rest pMRI, and ceMRI was performed in 62 pts within 24 hrs prior to CA. For pMRI, a SR GRE‐EPI sequence was used (109 msec/slice; 4–5 slices per heart beat; 0.0625 mmol/kg Gd). All MRI studies were randomized into a pool including full studies from 30 control pts and analyzed blinded to pt identity. Analysis was performed by rapid visual assessment in order to provide results that are applicable in the clinical setting. Images were scored multiple times on separate days in the following manner: pMRI alone, cine alone, ceMRI alone, and an interpretation incorporating all 3 sets of MRI data. Pts were considered positive for CAD if there was ≥ 70% coronary stenosis on CA.
Results: pMRI alone had a higher sensitivity than specificity for the detection of CAD (). Cine MRI alone or ceMRI alone resulted in low sensitivity for CAD. CeMRI had high specificity for CAD. A comprehensive assessment incorporating all imaging data had the highest accuracy which was significantly improved (P = 0.02) compared with pMRI alone. Specificity was improved by the recognition that matched stress and rest pMRI defects in the absence of corresponding hyperenhancement on ceMRI were artifacts and not true perfusion defects.
Table 1. Sensitivity, Specificity, Diagnostic Accuracy of Stress Perfusion MRI
Conclusion: A multimodality stress MRI protocol is clinically feasible and has a significantly higher diagnostic accuracy compared to that of stress perfusion MRI alone for the detection of coronary artery disease.
132. Qualitative Evaluation of Magnetic Resonance Myocardial Perfusion for the Detection of Coronary Artery Stenosis
Nidal Al‐Saadi. Cardiology, Franz‐Volhard‐Klinik, Charite, Campus Berlin‐Buch, Humboldt University, Berlin, Germany.
Introduction: The clinical utility of first pass magnetic resonance (MR) myocardial perfusion imaging will depend on rapid analysis. Qualitative, although subjective, rather than quantitative assessment fulfills this demand, because quantitative or semiquantitative approaches requires time consuming image post‐processing.
Purpose: We aimed to evaluate the diagnostic accuracy of the qualitative approach for the detection of coronary artery stenosis as defined by coronary angiography.
Methods: One hundred sixty patients (131 men, 62 ± 9 years) with known or suspected coronary artery disease underwent first pass rest and adenosine stress MR. Each heartbeat 3 short axis slices were acquired during the first pass of a compact Gadolinium bolus (0.1 mmol/kg). In addition delayed enhancement and wall motion analysis was performed in the same axis. Visual analysis was performed by 2 readers based on the 16 segment model applying a 5 score system for the presence or absence of a perfusion defect. Furthermore, regional perfusion was classified according to its transmural extent and defect reversibility. MR and angiographic data were compared after assignment of segments to coronary territories based on angiographic results. A luminal reduction of > 50% was considered as a significant coronary artery stenosis.
Results: 125 patients had coronary artery disease (52 single, 47 double, 26 triple coronary artery disease). The sensitivity and specificity for the detection of a significant coronary artery stenosis were 95 and 84%, the diagnostic accuracy 88%. Positive and negative predictive values were 83% and 96%. The majority of perfusion defects were subendocardial (86%). Irreversible and/or transmural defects corresponded mainly to the presence of myocardial infarction (as determined by delayed enhancement imaging).
Conclusions: Qualitative MRI analysis shows an excellent sensitivity and good specificity for the detection of coronary artery stenoses. Specially the high sensitivity and negative prediction may allow the technique to be suitable for the evaluation of patients with suspected coronary artery disease in a clinical setting.
133. MRI Myocardial Perfusion Accurately Detects Cardiac Transplantation Arteriosclerosis and Predicts 6‐Month Clinical Outcome
Marcus A. Averbach, MD,1 Hayden Huang, PhD,2 Michael Jerosch‐Herold, PhD,3 James Fang, MD,1 John A. Jarcho, MD,1 Gilbert H. Mudge, Jr, MD,1 E. Kent Yucel, MD,2 Raymond Y. Kwong, MD.1 1Cardiology, Brigham and Women's Hospital, Boston, MA, USA, 2Brigham and Women's Hospital, Boston, MA, USA, 3University of Minnesota School of Medicine, Minneapolis, MN, USA.
Introduction: 50% of patients who undergo orthotopic cardiac transplantation develop clinically significant transplantation arteriosclerosis within 5 years of transplantation. MRI myocardial perfusion (MRMP) at high spatial resolution distinguishes perfusion characteristics of the endomyocardium and the epimyocardium and may represent an accurate tool in the surveillance of transplantation arteriosclerosis and in prediction of clinical adverse events.
Purpose: To determine the utility of MRI myocardial perfusion reserve in detecting cardiac transplantation arteriosclerosis and predicting adverse clinical events.
Methods: 22 patients (17 M, 5 F), at mean age of 59 and 7 years post heart transplant, underwent MRMP utilizing first pass gadolinium myocardial perfusion imaging with echo planar fast gradient recalled echo imaging at rest and during dipyridamole stress. One case was excluded from receiving dipyridamole due to a history of severe pulmonary disease. Absolute endomyocardial and epimyocardial flow reserves from 3–5 slices were quantified with a Fermi function model‐constrained deconvolution. Based on an 18–24‐segment model, MRI perfusion reserves from the endomyocardium and the epimyocardium were compared by paired‐t test. MRI myocardial perfusion was considered abnormal either if the endomyocardial perfusion reserves are significantly lower than the epimyocardial perfusion reserves, or if the MRI myocardial perfusion is qualitatively abnormal. Coronary angiography was performed and analyzed by the Stanford criteria on all patients within a mean of 6 days of MRMP. Interpretation of the angiography and the MRI perfusion are blinded to each other. Patients were followed prospectively for a mean of 6 months from the MRI for diagnosis of cardiac transplantation arteriosclerosis and adverse cardiovascular events of death, acute coronary syndrome, coronary revascularization, or myocardial rejection.
Results: During a mean subsequent 6‐month follow‐up period, 5 patients were diagnosed with coronary arteriosclerosis on angiography, one of which subsequently required coronary revascularization. The remaining 16 patients have no evidence of coronary arteriosclerosis on angiography and were free of events at 6 months. MRI myocardial perfusion was abnormal in the 5 patients with transplantation arteriosclerosis. All 16 patients with no clinical events or diagnosis of transplantation arteriosclerosis at 6 months had normal MRI myocardial perfusion. Qualitative MRI myocardial perfusion was abnormal in 4 of the 5 patients with transplantation arteriosclerosis. Quantitative MRMP detected the remaining patient with transplant arteriosclerosis but missed one patient who had a transmural myocardial perfusion defect that was detected qualitatively. Patients with transplantation arteriosclerosis have significantly lower endomyocardial vs. epimyocardial perfusions reserves (1.7 ± 0.8 vs. 1.9 ± 0.9, p < 0.01). Patients with transplantation arteriosclerosis have significantly lower endomyocardial perfusion reserves compared to those without transplantation arteriosclerosis (1.7 ± 0.8 vs. 2.3 ± 1.6, p < 0.03). ()
Figure 1
Conclusions: MRI myocardial perfusion accurately detects cardiac transplantation arteriosclerosis, and predicts clinical outcomes at a mean follow‐up of 6 months.
134. Long Term Reproducibility of Myocardial Perfusion Measurements by MRI
Michael Jerosch‐Herold, Ph.D.1, Gabriela Vazquez, M.Sc.,2 Aaron Folsom, M.D., M.P.H.2 1Radiology, University of Minnesota, Minneapolis, MN, USA, 2Division of Epidemiology, University of Minnesota, Minneapolis, MN, USA.
Introduction: MRI allows the non‐invasive assessment of absolute myocardial blood flow in ml/min/g during rest and hyperemia as shown previously. Intravenous adenosine is a powerful coronary vasodilator with a very short decay time, which is commonly used for the induction of hyperemia. The variability of the response to adenosine, and the long‐term reliability of MR measurements of the response to adenosine in healthy volunteers remains largely unknown.
Purpose: The purpose of this study was to assess the reproducibility of measurements of myocardial blood flow with MRI during hyperemia, induced by adenosine.
Methods: 12 male and 5 female volunteers, without symptoms of heart disease, aged 46 to 79 years (mean ± std. deviation: 65 ± 10 years), were imaged twice with MRI within 34 to 561 days (mean: 324 ± 144). MR images were acquired during the first pass of a Gd‐DTPA bolus (0.04 mmol/kg)with a rapid, multi‐slice, T1‐weighted sequence during an iv adenosine infusion (0.14 mg/min per kg BW). Hyperemia was induced over 3 minutes before starting the acquisition of the perfusion images. Myocardial blood flow was determined for eight circumferentially‐distributed myocardial sectors at the mid‐ventricle level by model‐independent deconvolution of the regional signal‐intensity curves. The relative difference between two measurements was calculated from the absolute difference, divided by the mean of the two measurements. Reliability of the MBF measurements was assessed through Cronbach's alpha method.
Results: The response of myocardial blood flow to iv. adenosine was quite heterogeneous in this cohort, with hyperemic blood flows in myocardial sectors ranging from 1.13 ml/min/g to 6.72 ml/min/g. Heart rate and mean arterial pressure during hyperemia were not significantly different between exams 1 and 2. The relative difference between exams 1 and 2 for the global average of blood flows in each participant ranged from 0.6% to 36% (mean: 12.6% ± 9.5%). The 95% confidence limits of the absolute difference and relative difference of two MBF measurements were ± 1.03 ml/min/g and ± 19%, respectively. For matching myocardial sector locations the relative difference averaged 19% ± 14%. The reliability coefficient (Cronbach's alpha) for the global averages of MBF in each participant, and the MBF's in matched myocardial sector locations were 0.935 and 0.88, respectively. The corresponding Pearson correlation coefficients for the global averages of MBF in each participant, and for MBF's in matched myocardial sectors were 0.905 and 0.8, respectively.
Conclusions: The present study shows that the response of myocardial blood flow to iv. adenosine, although heterogenous in a cohort of aysmptomatic voluteers, is reproducible over time. No significant trend of MBF could be detected for a time span of close to 2 years. These findings should be of help in determining the potential value of MR perfusion imaging for longitudinal studies on the progression of heart disease. (The authors gratefully acknowledge the support by NIH with 1 R01 HL65580‐01.) (.)
Table 1. Hypermic Blood Flows (Myocardial Sector Averages)
135. The Limits of Quantifiable Differences in Dipyridamole Stress MRI Myocardial Perfusion Defects in Human Subjects with Coronary Artery Disease
Kenneth L. Rhoads, MD, Li‐yueh Hsu, ScD, W. Patricia Ingkanisorn, MD, Christopher K. Dyke, MD, Mushabbar A. Syed, MD, Preeti Kansal, Anthony H. Aletras, PhD, Andrew E. Arai, MD. Laboratory of Cardiac Energetics, National Institutes of Health, Bethesda, MD, USA.
Introduction: A dual‐bolus first‐pass MRI quantitative perfusion technique can evaluate absolute myocardial blood flow where a low concentration bolus defines the input function and a high concentration bolus provides strong myocardial enhancement.
Purposes: 1) To determine the limits with which MRI myocardial perfusion can be quantified. 2) To evaluate the feasibility of dual‐bolus perfusion analysis in humans.
Methods: Perfusion analysis limits were tested: 1) by measuring the coefficient of variation of myocardial blood flow (MBF) in 10 normal volunteers; and 2) by measuring perfusion in 20 patients in: a) normal myocardium; b) regions with ≥ 70% stenosis (ST) by quantitative coronary angiography but without infarction (ST w/o MI); c) regions of infarction (MI) with ≥ 70% stenosis (ST w/MI); and d) regions of MI without significant stenosis (MI w/o ST).
Feasibility was tested in 64 patients and 10 normal subjects. A quantifiable study required: 1) a single transient increase in signal intensity for the small bolus in the LV cavity, 2) LV myocardial time intensity curves (TICs) that captured baseline, upslope, and the return to steady state level by the recirculation peak, and 3) TICs without significant heartbeat‐to‐heartbeat variations.
Dipyridamole (0.56 mg/kg) stress utilized a dual‐bolus first pass perfusion technique [Gadolinium‐DTPA 0.005 and 0.1 mmol/kg] on a GE 1.5 T CV/i scanner and Fermi function deconvolution. Cine MRI and delayed hyperenhancement imaging were also performed.
Results:Limits in Normal Volunteers—Perfusion averaged 4.45 ± 1.12 ml/min/g with stress and 2.06 ± 0.56 ml/min/g at rest (p < 0.001). The coefficient of variation for six segments averaged 8% during stress and 7% at rest. Limits in Patients—[]: Relative to a normal segment, infarcted segments without residual stenosis had 75% as much MBF (p = 0.01), segments with stenosis but no MI had 61% as much MBF (p < 0.001), and segments with both stenosis and MI had 44% as much MBF (p < 0.001). The sensitivity for a ≥ 70% stenosis was 86%.
Figure 1. Graded severities of perfusion abnormality based on MI and/or stenosis.
Technical feasibility: Of 74 consecutive studies, 96% were adequate for qualitative interpretation and 78% for quantitative analysis. Studies which were not quantifiable had gating/arrhythmia problems (n = 8), short TICs (n = 3), small bolus problems (n = 2), or qualitatively inadequate studies (n = 3).
Conclusions: The low coefficient of variation in normal volunteer studies suggests quantitative perfusion analysis should differentiate ∼ 15–16% variations in blood flow between myocardial segments. In patients, quantitative dipyridamole stress MRI myocardial perfusion imaging successfully detected four graded levels of perfusion, including defects in reperfused MI that were only 25% below normal.
136. Quantitative Assessment of Myocardial Perfusion with a Spin‐Labeling Technique: Preliminary Results in Patients with Coronary Artery Disease
Christian M. Wacker, Florian Fidler, Christian Dueren, Peter M. Jakob, Axel Haase, Wolfgang R. Bauer. Medical Clinics, Cardiology and Biophysics, University, Wuerzburg, Germany.
Introduction: Determination of myocardial perfusion is of paramount importance in diagnosis and treatment of coronary artery disease (CAD). In most cases alterations of perfusion are much closer related to the functional significance of a coronary artery stenosis than the morphology of the stenosis itself. Despite the quantification of perfusion it is an indispensable component of a comprehensive diagnosis to determine the perfusion reserve as indicator for myocardial viability.
In recent years, most MRI approaches for perfusion assessment were based on first‐pass techniques, which evaluate signal dynamics after application of contrast agent (CA). Perfusion then is obtained either qualitatively by empiric parameters or quantitatively by deconvolution of the concentration time curve. However, despite of its widespread use in myocardial perfusion imaging, the disadvantages of first pass techniques are well known, e.g. measurements are not easily repeatable and data have to be unfolded with an arterial input function.
Spin‐labeling techniques exploit the labeling of the nuclear magnetization of water protons either by direct preparation of inflowing spins or by specific preparation of the imaging slice and leaving the inflowing spins in thermo‐magnetic equilibrium.
We recently introduced a technique for the quantitative assessment of myocardial perfusion. The feasibility of the technique was shown and changes in myocardial perfusion under different vasodynamic states were assessed in volunteers.
Purpose: In the present trial myocardial perfusion reserve by spin labeling was assessed for the first time in patients with CAD. This was a pilot study to show whether or not regional changes in perfusion reserve are generally detectable using the presented technique at 2 T.
Methods: Assessment of myocardial perfusion is based on T1 measurements after global and slice‐selective spin preparation.
Due to the inflow of unsaturated spins, T1 in tissue is shortened after slice selective preparation case compared to global saturation. Assuming a two‐compartment model with fast proton exchange between the compartments, the absolute perfusion P [ml/g/min] can be calculated as P = λ/T1blood × (T1glob/T1sel‐1), where the blood tissue partition coefficient λ represents the quotient of water content of capillary blood and perfused tissue, which is ∼ 0.9 ml/g. T1blood is the longitudinal relaxation time of arterial blood, measured in the left ventricle (LV) whereas T1glob and T1sel are values for myocardial T1 calculated after global and slice‐selective spin preparation.
For T1 assessment saturation recovery turboFLASH sequences were implemented on a 2T whole body scanner (Bruker TOMIKON, Ettlingen, Germany) with a maximal gradient strength of 31 mT/m and a rise time of 600 µsec.
The T1 technique was applied to 12 healthy volunteers and 16 patients with suspected coronary artery disease under resting conditions and adenosine‐induced vasodilatation.
Results: In volunteers, quantitative perfusion was calculated as 2.4 ± 1.2 ml/g/min (rest) and 3.9 ± 1.3 ml/g/min (adenosine), respectively. Perfusion reserve was 2.1 ± 0.6. Coronary reserve could be calculated in 9 of 11 patients who underwent pharmacological stress testing. When comparing perfusion reserve in the anterior and posterior myocardium, reduced values according to a stenotic supplying vessel could be seen in 7 patients (5 × single‐vessel disease, 2 × two‐vessel disease). Two patients without stenosis of coronary arteries showed no differences in coronary reserve.
Conclusions: In patients with single‐vessel coronary artery disease differences in coronary reserve were clearly detectable when comparing anterior and posterior myocardium. The spin labeling method is noninvasive and easily repeatable and it could therefore become an important tool to study changes in myocardial perfusion.
137. Retrospective Correction for Respiratory Motion in Navigated Coronary Velocity Mapping
Christof Baltes,1 Sebastian Kozerke, PhD,1 David Atkinson, PhD,2 Peter Boesiger, PhD.1 1Institute for Biomedical Engineering, University and ETH, Zurich, Switzerland, 2Division of Imaging Sciences, King's College, London, United Kingdom.
Introduction: In navigated cardiac magnetic resonance (MR) imaging, the importance of minimal temporal delays between navigator and acquisition window has been pointed out (Spuentrup, [Citation2002]). While this condition can usually be met for coronary imaging, it cannot be fulfilled for coronary flow quantification. The high temporal resolution required for coronary velocity mapping does not allow for the acquisition of additional navigator echoes. Using a single navigator per cardiac cycle leads to poor image quality especially for phases later in the cardiac cycle. Therefore, simple gating might not be appropriate in applications acquiring data throughout the cardiac cycle such as in coronary flow quantification (Nagel, [Citation1999]).
Purpose: The aim of the current work was to improve image quality of heart phase images acquired late in the cardiac cycle. For this purpose, retrospective image correction was performed based on navigator information additionally collected at the end of each cardiac cycle.
Methods: A standard TFE phase contrast sequence with a single leading navigator (L‐NAV) for gating and slice position correction was extended with a trailing navigator (T‐NAV) (). Navigated velocity mapping was performed in the left coronary artery system of 8 volunteers (7:LAD, 1:LCX) on a Philips 1.5 T Intera MR system with the following scan parameters: temporal resolution: 36.0–37.7 ms, venc: 30 cm/sec, resolution:0.9 mm × 0.9 mm, TE/TR:4.3–4.6/8.7–8.9 ms, tracking factor: 0.6 (Wang, [Citation1995]), gating window:5 mm. During scanning, respiratory positions detected by the navigators were recorded into a file along with the sampled k‐space data. In post‐processing, the cardiac positions for each heart phase were computed by linear interpolation based on the recorded diaphragm positions (). This information was used to correct k‐space data for residual respiratory in‐plane motion according to the Fourier shift theorem. Gradient entropy of the images was used as image quality measure (McGee, [Citation2000]) to quantify vessel sharpness and to retrospectively determine the optimal tracking factor. Volume flow rates were determined in all volunteers before and after correction.
Figure 1. (a) Scheme of the multi‐heart phase, ECG triggered imaging sequence. Data from leading (L‐NAV) and trailing (T‐NAV) navigator were recorded for retrospective corrections. (b) Linear interpolation (black) performed between leading (dlead) and trailing (dtrail) navigator.
Results: compares anatomical images and phase maps acquired 49ms and 874 ms after the ECG trigger showing the LAD (circles) before (2c,2g,2e,2i) and after (2d,2h,2f,2j) correction. Image blurring observed in the later heart phase (2e,2i) was significantly reduced (2f,2j) after correction. For all volunteers, vessel sharpness increased by 15 ± 11% (mean ± SD) on average.
Figure 2. Anatomical images and velocity maps acquired 49ms and 874ms after ECG trigger. First heart phase: image quality is comparable for uncorrected (2c,2g) and corrected (2d,2h) data. Later heart phase: considerable improved image quality and vessel sharpness of the LAD (circles) is seen (2f,2j compared to 2e,2i).
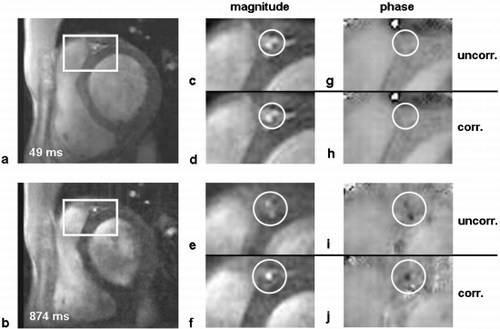
As depicted in , the corrected flow profile (rectangle) approximates the reference profile (circles)—acquired with gating on leading and trailing navigator—more closely compared to the uncorrected profile (triangles). On average, retrospective correction led to an increase of volume flow rates by 16 ± 14%.
Figure 3. The significant difference between the flow profiles before (triangles) and after (rectangles) correction results in varying volume flow rates. However, the corrected profile approximates the reference profile (circles) acquired with gating on leading and trailing navigator more closely, as indicated by the mean error (ME).
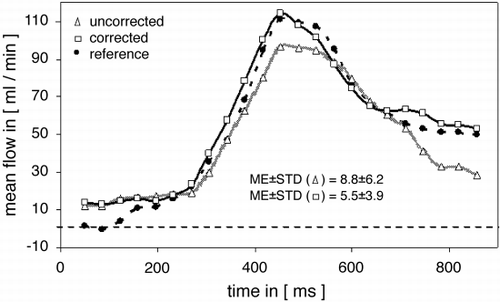
Conclusion: In this study, a post‐processing approach was presented to correct for in‐plane components of residual respiratory motion in navigated velocity mapping. The current method achieved considerably improved image quality in particular for later cardiac phases and resulted in significantly increased volume flow rates.
138. Comparison of Cartesian and Radial Balanced TFE Coronary MRA
Tim Leiner, MD PhD,1 Ernest N. Yeh, MSc,2 George Katsimaglis, MD,3 Kraig V. Kissinger, RT, BS,3 Elmar Spuentrup, MD,4 Warren J. Manning, MD,3 Rene M. Botnar, PhD.3 1Department of Radiology, Maastricht University Hospital, Maastricht, Netherlands, 2Laboratory for Biomedical Imaging Research, Beth Israel Deaconess Medical Center, Boston, MA, USA, 3Cardiac MR Center, Beth Israel Deaconess Medical Center, Boston, MA, USA, 4Department of Radiology, Technical University of Aachen, Aachen, Germany.
Introduction: Coronary magnetic resonance angiography (MRA) is a promising non‐invasive alternative to X‐ray coronary angiography. The main obstacles for reliable depiction of the coronary artery lumen are cardiac and respiratory motion. Free breathing coronary MRA in combination with navigator echoes, a subject specific trigger delay, and mid‐ to end‐diastolic acquisition window (typically less than 100 ms) has helped minimizing motion related artefacts. However, even with these advances, ∼ 10–20% of coronary MRA's are non‐diagnostic, probably due to residual cardiac motion. Recently, a lot of attention has been directed towards steady‐state free precession (SSFP) balanced TFE (bTFE) coronary MRA using Cartesian and radial k‐space sampling. We hypothesize that non‐Cartesian (radial) k‐space filling may be less sensitive to bulk cardiac motion and thus advantageous for coronary MRA.
Purpose: To compare Cartesian‐ and radial‐bTFE coronary MRA and to investigate the influence of acquisition duration on image quality.
Methods: Free breathing, navigator gated and corrected radial and Cartesian 3D bTFE coronary MRA with subject specific mid‐diastolic trigger delay and different acquisition window durations (70, 140, and 210 ms) was performed in 10 healthy volunteers (mean age = 30). To minimize motion related artifacts due to RR‐variability, an arrhythmia rejection algorithm was used. All imaging was done on a 1.5 T clinical MR scanner (Gyroscan‐NT, R9.1, Philips Medical Systems, Best, The Netherlands) using a vector ECG and a 5‐element cardiac receiver coil. Five left and 5 right coronary arteries were imaged. Imaging parameters for the Cartesian 3D bTFE were: TR = 5.4 ms, TE = 2.7 ms, flip angle = 110°, scan duration = 2 min56 s @ 70 bpm. Imaging parameters for the radial 3D bTFE sequence were: TR = 6.2 ms/TE = 3.1 ms, flip angle = 120°, scan duration = 4 min @ 70 bpm. In‐plane spatial resolution of both sequences was 1.0 × 1.0 mm and 10 slices of 3 mm thickness were acquired (zero interpolated to 20 slices of 1.5 mm). Scan durations decreased by a factor of 2 and 3 when the longer acquisition windows were used. All 6 sequences were acquired in random order. To assess the influence of the different k‐space filling algorithms and acquisition windows on image quality we used the following end‐points: mean vessel length for left main and anterior descending (LAD), circumflex (LCX) and right coronary (RCA) arteries; vessel sharpness, and mean vessel diameter for the first 40 mm of the left (left main and anterior descending combined) and right coronary arteries.
Results: Radial 3D balanced FFE with the shortest acquisition window duration (70 ms) allowed for longest mean coronary artery visualization (LAD: 64 ± 5.2 mm vs. Cartesian: 61 ± 5; LCX: 42 ± 5 mm vs. Cartesian: 39 ± 8; RCA: 134 ± 17 mm vs. Cartesian: 115 ± 19). For both Cartesian and radial imaging, mean coronary artery length decreased with increasing acquisition window duration (range: − 2 to − 35%).Vessel sharpness was significantly higher for all acquisition window durations when radial imaging readout was used (all P < 0.05). An example is shown in the (a–c: cartesian acquisitions at 70, 140 and 210 msec acquisition durations; d–f: radial acquisitions at 70, 140 and 210 msec acquisition durations). There were no significant differences in vessel diameter between the two different readout techniques nor for different acquisition window durations (no more than 8% variation for all arteries between techniques and different acquisition windows).
Figure 1.
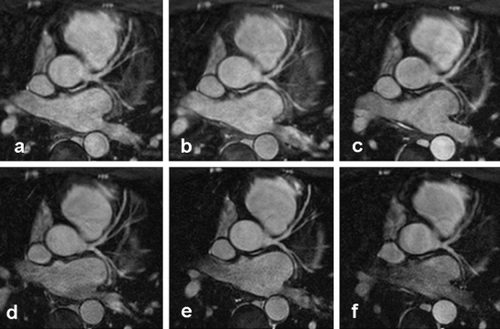
Conclusions: Radial bTFE allows for better coronary artery delineation when compared with Cartesian bTFE, (higher vessel sharpness) and better conservation of image quality at increased acquisition windows. These results encourage further studies in selected patient groups to determine the diagnostic accuracy of both techniques.
139. Rapid Coronary Artery Imaging Using a True 32‐Channel Phased Array MRI System
Thoralf Niendorf,1 Christopher J. Hardy,2 Daniel K. Sodickson,3 Robert D. Darrow,2 Randy O. Giaquinto,2 Manojkumar Saranathan,1 Yudong Zhu,2 Gontran Kenwood,2 Neil M. Rofsky.3 1Applied Science Laboratory, GE Medical Systems, Boston, MA, USA, 2GE Global Research Center, Niskayuna, NY, USA, 3Beth Israel Deaconess Medical Center, Harvard Medical School, Boston, MA, USA.
Introduction: Increasing the number of receiver channels in multi‐coil imaging beyond the industry standard of 4–8 offers the potential for 1) signal‐to‐noise‐ratio improvements (1) and 2) scan time reductions due to the application of massively accelerated parallel imaging (2,3). This is of profound importance to tackle cardiac and respiratory motion in diagnostic coronary artery imaging (CMRA). It also yields the potential to enhance patient comfort by using large imaging volumes for whole heart coverage, which may render time consuming localization scans obsolete.
Purpose: This study demonstrates the technical feasibility of using a 32‐channel coil array in conjunction with a true 32‐channel receiver system for short breath‐hold coronary artery imaging. For this purpose an ECG gated 3D FIESTA technique was combined with parallel imaging.
Methods: A 32‐channel acquisition system including multiple sets of GE EXCITE system electronics (GE Medical Systems, Waukesha, WI, USA) was employed for signal transmission/reception. A 32‐channel coil array (GE Global Research Center, Niskayuna, NY, USA), each equipped with 16 component coils in a 4 × 4 grid, was used (3). One former was placed underneath the subjects torso while the other was positioned on the subjects chest. The 3D FIESTA pulse sequence was customized in order to synchronize the ECG gated data acquisition for all 32 channels. Retrospective ECG gating was achieved by using the physiological signal for the master cabinet and an external scope trigger for the slave cabinets.
A gradient echo sequence was used to calculate coil sensitivity maps. 3DFIESTA was performed using: FOV = 35 cm, data matrix = 256 × 192 × 12, interpolated spatial resolution = (0.6 × 0.6 × 1.0) mm3. Two different acquisition strategies were implemented for parallel imaging (acceleration factor 2–4): 1) acquisition was completed in a single heartbeat for each slice partition (1 R–R interval approach), 2) acquisition for each slice partition was distributed over 2 consecutive heart beats (2 R–R interval approach) and compared with a non‐accelerated approach (5). No contrast media were applied.
Results: High SNR coronary artery images were obtained for the conventional approach () and both parallel imaging acquisition strategies (). The delineation of the most distal arterial segments was substantially improved using the 32‐channel array. A longer segment of the diagonal branch is clearly visible in a 32‐channel acquisition () as compared with a 4‐channel acquisition using a standard cardiac phased array (). For the non‐accelerated approach SNR was 50 in the proximal and distal part of the RCA, a 40% increase compared with the 4‐channel acquisition. Although the 32‐channel array is comprised of individual elements, which are smaller than those used in commercially available cardiac phased array coils, the array as a whole provides depth penetration which is suitable for coronary artery imaging, as demonstrated in and .
Figure 1. RCA images (MIP) of the same volunteer acquired with a 4‐channel (left) and a 32 channel (right) phased array. The distal portion of the RCA is clearly visualized in the 32‐channel image due to a 40% SNR improvement over the 4‐channel image.
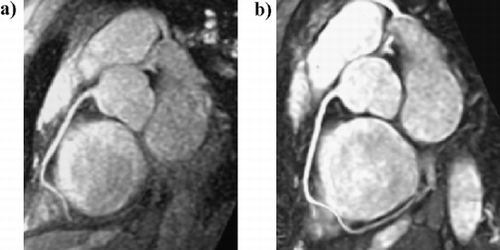
Figure 2. RCA images (MIP) derived from a healthy volunteer using parallel imaging. The breath‐hold time wasa 25 sec when using the 2 R–R interval approach (a) and 12 sec when applying the 1 R–R interval approach. Note the clear delineation of the distal segment of the RCA.
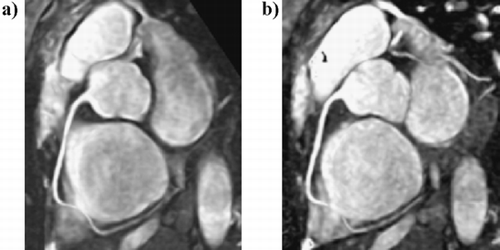
Conclusions: The feasibility of rapid breath‐hold coronary artery imaging using a 32‐channel MRI system has been demonstrated. The application of 32 independent coil elements revealed superb image quality and SNR improvements compared with results using traditional few‐element arrays. This suggests that breath‐hold CMRA with a 32‐channel system may provide benefits for clinical cardiac MR. A multi‐element array as sort of used here should also be useful for highly accelerated acquisitions using bi‐dimensional acceleration. Although we focused on uni‐dimensional acceleration with a limited slab thickness in this work, we anticipate the application of more massively parallel imaging (e.g. 10‐ to 20‐fold accelerations as previously demonstrated using this array (3)) to achieve whole heart coverage in a single breath‐hold for future CMRA studies. This would constitute a significant scan time reduction compared to free‐breathing techniques, which offers the potential to integrate CMRA into a comprehensive cardiac examination without sacrificing patient comfort.
140. Tracking 3D Coronary Artery Motion by Intravascular MRI
Frederick H. Epstein, PhD,1 Shayee Wang, MS,1 C. Joon Choi, MD, PhD,1 Tom Sierocuk,2 Kamal Vij, PhD,3 Walter J. Rogers, PhD.1 1Radiology, University of Virginia, Charlottesville, VA, USA, 2Cordis Corporation, Miami Lakes, FL, USA, 3ViaRes Technologies, Chandler, AZ, USA.
Introduction: Cardiac and respiratory motion contribute to artifacts in conventional and intravascular MRI of the coronary lumen and vessel wall. Navigator echoes that monitor diaphragm position can be used to reduce the affects of respiratory motion, however they do not directly measure the respiratory‐induced motion of the coronary arteries themselves.
Purpose: We sought to investigate the cardiac and respiratory contributions to three‐dimensional coronary artery motion by tracking intravascular RF coils positioned within the coronary arteries.
Methods: A 3D tracking sequence was implemented on a 1.5 T scanner (Sonata, Siemens Medical Solutions, Germany), where successive gradient‐echo projections were acquired with frequency encoding cycling through the x‐, y‐, and z‐directions. The TR of the tracking sequence was 10 ms, the flip angle was 20, the field of view was 77 mm, and the number of points was 256, so that projections with 0.3 mm spatial resolution were acquired in all three directions every 30 ms.
Three swine were studied in accordance with protocols approved by the animal care and use committee at our institution. For each animal an investigational 5 French catheter with an opposed solenoid RF coil mounted on its tip (Cordis, Warren NJ) was positioned in either the LAD, RCA, or LCX artery. Catheter positioning occurred under x‐ray guidance, and the animals were subsequently transported into the MRI lab with the catheter in place. During x‐ray angiography and MRI, animals were ventilated and anesthetized with isofluorane.
To investigate the effect of respiratory state on coronary motion, the respirator was switched off at different respiratory phases. Within each period of suspended respiration, conventional navigator data for determining diaphragm position was acquired for 5 seconds and catheter tracking data for measuring coronary motion was acquired for an additional 2.5 seconds.
Three‐dimensional coronary artery motion trajectories were generated and analyzed to determine the 3D motion range, the 3D trajectory shift between end inspiration and end expiration, and the minimum amount of motion that occurred for any 90 and 180 ms period. The latter measure was computed to assess the amount of motion that occurs during specific data acquisition windows due to the cardiac cycle.
Results: Three‐dimensional motion trajectories were computed for all three arteries and for multiple respiratory phases. An example trajectory of a catheter in the proximal LAD across 3 cardiac cycles, at end expiration is shown in . The trajectory in successive heart beats was nearly congruent during mid systole and mid diastole, but showed some variability at end‐diastole and end‐systole.
includes ranges of motion due to cardiac contraction during suspended respiration, and due to respiratory motion between end‐expiration and end‐inspiration. 3D motion due to cardiac contraction ranged from 3.4 to 9.7 mm, whereas motion due to respiration was significantly less, ranging from 0.09 to 2.84 mm. During suspended respiration, minimum motion during 90 and 180 ms windows was never less than 1.2 mm.
Figure 1. (View this art in color at www.dekker.com.)
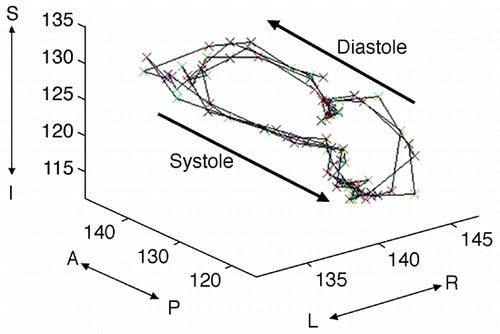
Table 1. Intracoronary Catheter Derived 3D Motion
Conclusions: These data confirm that respiratory motion leads to 3D, not only superior‐inferior, shifts of the coronary arteries on the order of 1–6 mm in pigs. This finding, like others, argues against the practice of performing superior–inferior only position shifts in adaptive navigator sequences. These data also support the use of short data acquisition windows to reduce motion artifacts, as displacements larger than typical pixel sizes occur during windows of both 90 and 180 ms. In order to image plaque components in coronary arteries, a spatial resolution < 150 microns is desired. In the future, when imaging with intravascular coils it may be possible to use real‐time 3D catheter tracking to direct 3D adaptive slice positioning for ultra‐high resolution imaging.
141. In Vivo Cardiovascular Catheterization Under Real‐Time MRI Guidance
Shaoxiong Zhang, M.D./PhD, Shervin Rafie, M.D., Jeffrey L. Duerk, PhD, Jonathan S. Lewin. Radiology‐MRI, University Hospitals of Cleveland, Case Western Reserve University, Cleveland, OH, USA.
Introduction: Cardiovascular intervention can be successfully performed under MRI guidance in many ways, including through the use of passive tracking methods. With passive tracking, different strategies have been employed to visualize the tip of the catheter, such as filling the catheter with contrast medium. To date, however, there has been no report on the feasibility of cardiac and coronary catheterization under real‐time MR guidance by using only the native susceptibility of a standard X‐ray angiographic catheter.
Purpose: To test the hypothesis that cardiac and coronary catheterization can be successfully performed under real‐time MR guidance with a conventional x‐ray angiographic catheter through application of the appropriate MR imaging technique.
Material and Methods: All experiments on 5 farm pigs were conducted on a 1.5 T Siemens Sonata MR system, and were performed under a protocol approved by our institutional animal care and use committee. After acquisition of a localizer, axial and oblique two‐dimensional true FISP images (TR/TE/Tip/Thickness: 3.03 ms/1.52 ms/40°/5 mm) were used to localize the aortic arch and root, coronary artery for the left heart, and to localize the inferior vena cava and right atrium and ventricle for the right heart. Then, a real‐time True FISP sequence (TR/TE/Tip/Thickness: 2.33 ms/1.17 ms/40°/10 mm; 3 frames/sec) was used to track the tip of the catheters. A pigtail catheter was used for both left heart and right heart catheterization, performed in all 5 animals, while an Amplatz catheter was used for right coronary catheterization, attempted in 4 animals. All catheters used were manufactured by Cordis, (Miami Lakes, FL). A steerable hydrophilic‐coated guidewire was coaxially inserted to advance the catheter. The intravascular devices were visualized by means of their native susceptibility artifacts. For right coronary artery catheterization, 5–10 ml 25% diluted Gadolinium contrast material was injected to confirm engagement of the right coronary artery.
Results: Cardiac catheterizations of both right and left heart were successfully performed in all 5 pigs. Not only the catheter tip, but also the longitudinal profile of the catheter was readily visible as signal avoid on the real‐time True FISP images (). In addition, right coronary catheterization was successfully completed in 3 of 4 pigs attempted (). The average time for either left heart catheterization including ascending aorta and left ventricle, or right heart catheterization including right atrium and ventricle, was one minute, while the time range required for coronary catheterization was 30 minutes to 90 minutes.
Figure 1. Real‐time True FISP sagittal images. a: tip of catheter in ascending aorta; b: tip of catheter in left ventricle (short arrow). Long arrows indicate the longitudinal profile of the catheter.
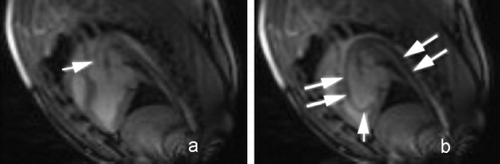
Figure 2. Real‐time True FISP sagittal (a,b) and axial (c,d) images were acquired. a, c show catheter engaged in right coronary artery without contrast injection; b,d show catheter in right coronary artery during injection of 25% diluted Gadolinium contrast. With injection, the right coronary artery can be visualized as a dark curvilinear structure (dual long arrows).
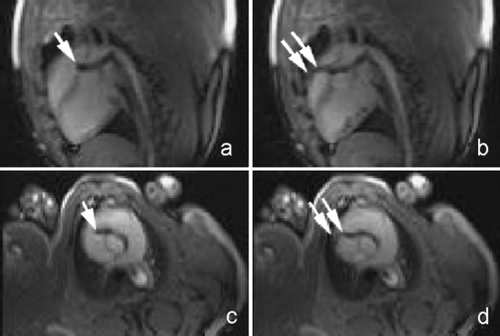
Discussion and Conclusion: While many conventional angiographic catheters cannot be used for interventional MRI because of unacceptable artifacts, certain catheters (including the Cordis catheters used in this study) are MRI compatible. Cardiac catheterization was feasible with passive visualization using the native susceptibility effect of selected conventional X‐ray angiographic catheters under real‐time MR guidance. Coronary catheterization was also achievable under real‐time MR guidance; however, the procedure time for these experiments was unacceptably long for clinical application. More robust MR sequences for real‐time demonstration of the coronary arteries and better device visualization, as can be achieved with active tracking utilizing catheter‐based coils, will be necessary if coronary artery catheterization under MR guidance is to become a clinical reality.
142. Coronary Angiography with Hyperpolarized C13 Using Interventional MR Imaging
Lars E. Olsson,1 Karsten Wicklow,2 Chun‐Ming Chai,1 Stefan J. Petersson,1 Oskar Axelsson,1 Klaes Golman.1 1Amersham Health R and D, Malmoe, Sweden, 2Siemens Medical Solutions, Malmoe, Sweden.
Introduction: Catheter based X‐ray examination with contrast medium is the standard method for coronary angiography. It is a fast, reliable method with high temporal and spatial resolution. X‐rays do not provide very much of soft tissue contrast of the heart muscle, the artery wall or atherosclerotic plaque nor the perfusion data of the areas supplied by the coronaries. MRI has very good soft tissue contrast and may evolve as a modality for interventional cardiac procedures. However, in conventional proton based MRI the catheter may be hard to visualize due to signal from overlapping tissue. The use of contrast medium is also hampered by the accumulation of the CM in the tissue, which gradually decreases the contrast effect.
Recently, a new type of water soluble contrast media based on hyperpolarized carbon‐13 has been used for angiography in rats (Svensson et al., [Citation2003]). The degree of polarization, achieved is > 35%, which is more than a factor of 105 above the thermal equilibrium polarization at 1.5 T. Since the scanner is tuned to 13C imaging the only signal in the images is generated by the 13C CM. This technique resembles X‐ray type of contrast. The aim of the present work was to study the 13C CM in cardiac interventional MRI procedures.
Methods: Pigs 25–35 kg were used. Using X‐ray guidance catheters were positioned in left and/or right coronary arteries. The pigs were then transported to the MR scanner (Siemens Sonata). Standard proton scans where used in order to select projection angles for the heart. A special build coil tuned to 13C was used for 13C imaging. Hyperpolarized 13C CM (4 ml solution, 0.5 M, ∼ 30% polarization) was injected during projection imaging using tFISP sequence. Imaging was performed both with and without cardiac gating.
Results: The catheter was always clearly visible during the procedure. The coronary arteries were depicted well. show three out of a series of non‐gated images generated during an injection into the left coronary artery, ∼ 3 images/s. The high CNR is clearly demonstrated. In the last image the 13C‐CM also depicts the myocardium, suggesting that perfusion data are simultaneously provided.
Figure 1.
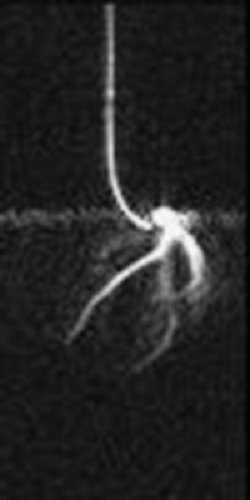
Conclusion: 13C‐CM is a contrast medium with great potential in interventional MRI, especially for cardiovascular applications.
143. Deployment of Endovascular Stent for Aortic Coarctation Repair Under XMR‐Guidance
Maythem Saeed, Christine Henk, Oliver Weber, Alastair Martin, Mark Wilson, David Saloner, Charles B. Higgins. Radiology, University of California San Francisco, San Francisco, CA, USA.
Introduction: Aortic coarctation is a congenital cardiovascular disease in children. Left ventricular (LV) function and collateral blood flow depend on the severity of stenosis. Coarctation repair by transcatheter balloon angioplasty and stent deployment under x‐ray fluoroscopy is now widely used. Furthermore, pre‐operational detection of aortic coarctation and measurement of collateral blood flow by x‐ray angiography and transthorasic echocardiography requires additional radiation exposure. MRI techniques have been used to partially replace these techniques. However, MRI has limited use in visualizing stent lumen due to susceptibility artifacts and rf shielding effects. Thus, the combination of MRI and x‐ray fluoroscopy (XMR) may allow full assessment of aortic coarctation and minimize radiation exposure of patients and staff.
Purpose: To use XMR system for the deployment of endovascular aortic stents to repair aortic coarctation and to determine the acute effect of aortic coarctation on collateral blood flow and LV function in canine model.
Methods: Four dogs were anesthetized and mechanically ventilated. After thoracotomy, the descending aorta was dissected distal to the left subclavian artery and looped with a plastic band. Catheters were placed in the right carotid and iliac arteries to monitor blood pressure proximal and distal to coarctation. The aortic band was tightened to reduce iliac arterial pressure to 40–50 mmHg.
The XMR suite contains two systems; namely short bore MR imager (1.5 T Intera, Philips Medical Systems) and digital x‐ray fluoroscopy system (Integris V5000, Philips Medical Systems). A movable tabletop was used to transfer the subject between the systems. Four MR sequences were used: 1) retrospectively‐gated T1‐FFE sequence for measurement of aortic flow (TR = 8.3 ms, TE = 5.1ms, phases = 16, VENC = 50–200 cm/s, flip angle = 15°), 2) B‐TFE sequence for determination of LV function (TR = 4 ms, TE = 2 ms, flip angle = 70°, number of phases = 18, 3) T1‐FFE sequence for MRA (TR = 4.9 ms, TE = 1.57 ms, flip angle = 30°), and 4) B‐FFE sequence for MR fluoroscopy (TR = 3.7 ms, TE = 1.9 ms, flip angle = 75°, scan matrix = 160 × 160, FOV = 270 × 270 mm, SENSE = 2). A self‐expandable (14 × 24 mm) nitinol stent was mounted on the tip of a dilator. The delivery system was guided a cross the coarctation by nitinol guidewire (0.035″). Iohexal and Gd‐DTPA‐BMA were used as contrast agents for x‐ray fluoroscopy and MRA.
Results: Aortic coarctation was visible on x‐ray fluoroscopy and contrast‐enhanced MRA (; left images). A jet signal was observed distal to the coarctation on VEC‐MRI. On MR fluoroscopy, the guide‐wire was observed as a dark object in the aorta and the delivery system was free of susceptibility artifacts. Aortic lumen after deployment of the stents was visible on x‐ray fluoroscopy, but not on contrast‐enhanced MRA (, right images). Aortic blood flow was changed after coarctation (proximal to coarctation = 0.84 l/min, distal = 0.28 l/min and diaphragm = 0.83 l/min) compared to baseline (at subclavian artery = 1.46 L/min and diaphragm = 1.29 l/min). The greater blood flow at the diaphragm compared to distal to the coarctation suggests that development of collateral blood flow is a rapid process. Deployment of the stent increased aortic flow distal to the stent (0.76 l/min). Cine MRI showed increase in LV volumes after coarctation, suggesting that the heart rapidly accommodates to changes in afterload. Aortic coarctation abolished phasic blood pressure in the iliac artery and reduced mean blood pressure from 110 ± 10 to 45 ± 8 mmHg. Deployment of the stent restored phasic and mean blood pressure.
Figure 1.
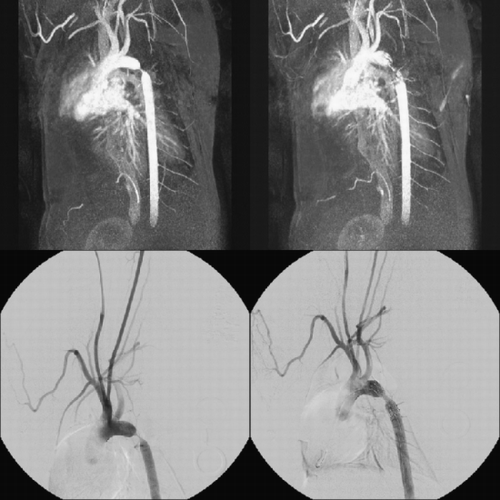
Conclusions: The cardiovascular system accommodates rapidly to acute aortic coarctation. Deployment of endovascular stents to repair aortic coarctation is feasible under MR‐guidance. MR imaging provides quantitative assessment of aortic blood flow and cardiac function as well demonstrates the success of the intervention. Visualisation of the aortic lumen after stent placement was possible on x‐ray fluoroscopy, but not on contrast‐MRA. Thus, complimentary use of x‐ray and MRI may be crucial in some cardiovascular interventions.
144. MRI Guided Implantation of a Prosthetic Valve in Aortic Valve Position: Feasibility Study in Swine
Titus Kuehne,1 Sevim Yilmaz,1 Carolin Meinus1, Bernhard Schnackenburg,2 Axel Bornstedt,2 Ingram Schulze‐Neick,1 Eckart Fleck,2 Peter Ewert,1 Eike Nagel.2 1Congenital Heart Disease and Pediatric Cardiology, German Heart Institute, Berlin, Germany, 2Cardiology, German Heart Institute, Berlin, Germany.
Introduction: As an alternative to surgery a first in‐human case description of transcatheter implantation of an aortic prosthetic valve was reported in an critically ill patient with aortic valve stenosis. However, until now transcatheter implantation of a prosthetic valve in the aortic position remains technically challenging and displacement of the device can lead to vital dangerous situation particularly due to occlusion of the coronary arteries and obstruction of the mitral valve.
The ability of MRI to acquire images in any given orientation and with high soft tissue contrast, as well as with various contrast characteristics, makes this technique very attractive for guidance of cardio‐vascular intervention. In contrast to conventional x‐ray angiography, MRI can provide the interventionist with both information about the interventional instruments and its background soft tissue anatomy.
Purpose: Purpose of this study was to assess the feasibility of MRI to guide the transcatheter implantation of a prosthetic valve in the aortic position.
Materials and Methods: Interventions were performed in 6 swine at a 1.5 Tesla scanner (Intera, Philips Medical Systems). The implanted device comprised a tricuspid teflon heart valve, which was sutured into a self expanding nitinol stent. This valved stent was compressed and front loaded into a 10 French delivery system. The delivery system was advanced through a carotid artery sheath to the left ventricle under interactive real‐time MRI guidance (irMRI). Catheter visualization during irMRI was achieved by use of small susceptibility markers. The position of the susceptibility markers, coronary artery orifices, aortic valve and mitral valve were determined during advancement of the delivery system. The valved stent was released when the desired position of the delivery system was seen on two‐chamber and axial image planes.
After completion of the intervention, catheters were removed from the vascular system. The valved stent, mitral valve and coronary artery orifices were evaluated with balanced fast field echo. Biventricular wall motion was investigated in order to assess whether myocardial ischemia occurred due to the intervention. Finally, quantitative aortic blood flow was measured within the lumen of the valved stent using velocity encoded cine (VEC) MRI. After completion of all MRI studies, position and morphology of the valved stents were confirmed at autopsy.
Imaging parameters for irMRI were: TR = 2.7 msec, TE = 1.4, FOV = 200–350, RFOV = 80%, matrix = 144 × 144, slice thickness = 8–10 mm, k‐space filling = radial. Acquisition frame rate = 9 frames per second, image reconstruction = online.
Imaging parameters for VEC MRI were: TR = 16 ms, TE = 9 ms, flip angle = 15°, slice thickness = 8 mm, retrospective gating, VENC = 200 cm/s.
Results: All six animals had successful implantation of a prosthetic aortic valve. The susceptibility markers produced a local artefact which was easily perceptible to the observer during irMRI. At the same time irMRI acquired images which contained detailed anatomical information about the aortic valve, mitral valve and the coronary artery orifices.
After intervention, the position of the implanted valved stent could well be determined. Obstruction of the mitral valve, coronary arteries or wallmotion abnormalities was not observed.
Quantitative blood flow as measured with VEC MRI showed no aortic regurgitation in four out of six animals. Slight incompetence of the prosthetic valve with a regurgitant fraction of 9 ± 4% was measured in two cases. In all cases there was no evidence for aortic valve stenosis. Peak flow velocities as measured within the lumen of the nitinol stent were 1.1 ± 0.5 m/second. Autopsy confirmed non‐obstructed mitral valve and coronary arteries.
Conclusions: The results of this study show that MRI is well suited to guide transcatheter implantation of a prosthetic valve in the aortic valve position.
145. Treatment of Myocardial Infarction using MR Delivery of Feridex‐Labeled Mesenchymal Stem Cells: Effects on Global LV Function
Kraitchman L. Dara, VMD, PhD,1 Long Tai,2 Izlem Izbudak, MD,1 Parag Karmarkar, MS,1 Danielle Fritzges,1 Raymond C. Boston, PhD,3 Jeff W. M. Bulte, PhD.1 1Radiology‐MRI, Johns Hopkins University, School of Medicine, Baltimore, MD, USA, 2Biomedical Engineering, Johns Hopkins University, School of Medicine, Baltimore, MD, USA, 3Veterinary Medicine, University of Pennsylvania, Kennett Square, PA, USA.
Introduction: While cellular therapies to repair infarcted myocardium have shown promising results, MR delivery of MR‐visible labeled stem cells offers the potential to non‐invasively target the therapeutic to the tissue adjacent to the infarction. Thus, in addition to improved therapeutic targeting, the ability to track the stems cells over time could be envisioned.
Purpose: The purpose of the present study was to monitor the progression of infarct size and parameters of global function non‐invasively by MRI over 8 weeks in a canine model of myocardial infarction (MI) after magnetic resonance (MR) fluoroscopic delivery of Feridex‐labeled mesenchymal stem cells (MR‐MSCs).
Methods: Mongrel dogs (25–30 kgs, n = 7) were subjected to a 90‐minute closed‐chest coronary artery occlusion by cardiac catheterization followed by reperfusion to create an acute MI. MSCs were isolated from bone marrow and magnetically labeled with 25 µg Fe/ml Feridex and 375 ng/ml poly‐L‐lysine for 24 h prior to injection under MR fluoroscopy (1.5 T scanner). In five dogs, MR‐MSCs (30–150 × 106 cells) delivery was performed 72 h post‐MI. MR‐MSCs were targeted adjacent to the MI as determined on delayed contrast‐enhanced (DCE) MRI using a custom MR‐compatible, steerable guide catheter and injection needle. A real‐time imaging sequence (4 frames/s) with interactive scan plan acquisition was used to guide left ventricular (LV) catheterization from a carotid approach and MR‐MSC injection. DCE and SSFP MRI were serially obtained at 1, 2, 4, and 8 weeks post‐injection. MI size was determined using a full‐width half‐maximum (FWHM) thresholding criteria on DCE‐MRI. Global left ventricular (LV) function parameters were determined from measurement of endocardial and epicardial contours on SSFP images. The changes in these parameters over time as a response to therapy was determined using a feasible generalized least squares of the cross‐sectional time series and compared to MI dogs that did not receive MR‐MSCs. A level of P < 0.05 was considered statistically significant.
Results: Hypoenhancing artifacts, representing MR‐MSC injections, demonstrated spreading within and adjacent to the infarct over 8 weeks on MRI. Dogs that received MR‐MSCs demonstrated a 3 fold reduction in infarct size over 8 weeks (21.6 ± 13.1% at injection vs. 8.6 ± 5.9% at 8 weeks, P < 0.002) while LV mass was preserved (125.9 ± 46.5 g vs. 107.4 ± 29.8 g, P = NS). This pattern of the infarct remodeling over 8 weeks without a significant loss in LV mass was different than that observed in control dogs (, P < 0.001). LV ejection fraction (EF) and stroke volume (SV) and were significantly improved at all weekly timepoints as compared to the injection timepoint. However, there was no difference in LV EF or SV between the dogs receiving MR‐MSCs and controls.
Figure 1. (View this art in color at www.dekker.com.)
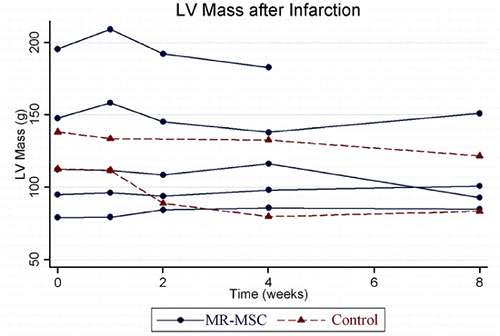
Conclusions: MR delivery of MR‐MSCs allows precise targeting and the ability to confirm the presence of MSCs for several months. Serially non‐invasive MRIs demonstrate that the potential benefit of MSCs may be due to preservation of LV mass rather than limiting infarct size.
146. Use of Magnetic Resonance Imaging to Evaluate the Depth and Transmurality of Radiofrequency Ablation Lesions
Timm Dickfeld, Ritsushi Kato, Menekhem Zviman, Glenn Meininger, Ariel Roguin, Krystl Frank, Ron Berger, Hugh Calkins, Henry Halperin. Johns Hopkins University, Baltimore, MD, USA.
Background: The transmural extent of radiofrequency ablation (RFA) is highly predictive of the procedural success for either focal ablation or creation of isolation lines as for idiopathic ventricular tachycardia, atrial flutter and atrial fibrillation. However, current imaging technologies like fluoroscopy or echocardiography are unable to accurately assess the thickness of the created lesion. Therefore, we tried to determine the transmural extent of RFA using magnetic resonance imaging (MRI).
Methods: RFA were created on the epicardial surface of the right ventricle in 18 mongrel dogs using a power‐controlled, water‐cooled 7‐French catheter system (10 to 50W for 30 s). The ablation lesions were imaged with non‐contrast enhanced T1‐weighted (SPGR: spoiled gradient recalled acquisition) and T2‐weighted (FSE: fast spin echo) protocols, or after intravenous injection of 0.225 mmol/kg gadolinium using a T1‐weighted fast gradient echo (FGRE) sequence. Ablation lesions and intramural extent were analyzed in the MR images and compared to the gross anatomy and histopathology.
Results: 59 RF lesions were created extending 2.2 mm to 8.3 mm into the ventricular wall and resulting in 17 transmural ablations. Lesions were accurately detected with all three imaging protocols. Non‐contrast enhanced T2‐weigthed images had a sensitivity of 100% and a specificity of 93.4% to detect transmural extent but slightly overestimated lesion thickness by 0.81 mm. For T1‐weighted imaging protocols the sensitivity and specificity were 71.4% and 100% without contrast and 85.7% and 94.4% after gadolinium injection. Transmural extent of the lesion as assessed with the T1‐weighted protocols was underestimated by 0.15 mm without and overestimated by 1.22 mm with contrast. The correlation with the histopathological specimen was excellent with all three imaging protocols (r = 0.89, r = 0.89, and r = 0.93, respectively).
Conclusion: Successful transmural RFA can be accurately assessed using MRI with and without contrast enhancement. Therefore, MRI might provide a useful tool to determine the procedural success for complex ablation procedures and guide further therapeutic strategies.
147. The Utility of Contrast Enhanced MRI for Screening Patients at Risk for Malignant Ventricular Tachyarrhythmias
Igor Klem, MD, Jonathan Weinsaft, MD, John F. Heitner, MD, Manesh Patel, MD, Annalisa Crowley, MD, Tristram Bahnson, MD, Robert M. Judd, PhD, Raymond J. Kim, MD. Duke University Medical Center, Durham, NC, USA.
Introduction: Invasive electrophysiologic study (EPS) is commonly performed to stratify patients (pts) in terms of risk for sudden death (SD). Prior studies clearly demonstrate that pts in whom sustained monomorphic ventricular tachycardial (MVT) is induced during EPS have high risk for future malignant ventricular tachyarrhythmias. Myocardial scar is believed to be the anatomic substrate for inducible MVT. Contrast enhanced MRI (ceMRI) can detect myocardial scarring with high sensitivity and specificity.
Purpose: We postulated that the absence of myocardial scar on ceMRI identifies a cohort who do not have the anatomic substrate for spontaneous malignant tachyarrhythmias and thus will not have inducible MVT during EPS.
Methods: We performed cine and ceMRI in 58 consecutive pts (29 with known CAD, age 56.1 ± 15.5, 64% male) who were scheduled to undergo clinical EPS to determine risk for malignant ventricular tachyarrhythmias. The results of the EPS were classified as sustained monomorphic VT (MVT), polymorphic VT or ventricular fibrillation (PVT/VF), non‐inducible (No VT), or idiopathicVT (I‐VT) for fascicular/bundle‐branch reentry VT or right ventricular outflow tract VT. Only inducible sustained MVT was considered to be a high risk finding. Hyperenhanced myocardium on ceMRI was considered to represent scar tissue. The presence of LV aneurysms and LV ejection fraction was determined on cine MRI. Routine clinical demographic information and 12‐lead electrocardiograms (for QRS duration) were also obtained.
Results: EPS demonstrated that 18 pts were at high risk for SCD (MVT, cycle length 290 ± 49 ms). Of the remaining pts. 10 pts had PVT/VF, 27 pts had No VT and 3 pts had I‐VT (1 RVOT‐VT, 2 fascicular VT). On ceMRI, 22 pts (38%) did not have hyperenhancement and none of these pts had inducible MVT. For each EPS diagnosis the percentage of pts without hyperenhancement is shown in the . Patient characteristics which were assessed for their relationship to inducibility of MVT are shown in the . On multivariate analysis the size of hyperenhancement was the strongest independent predictor. LV ejection fraction although a strong univariate predictor showed a trend towards significance on multivariate analysis (p = 0.07).
Table 1. Predictors of S‐MVT Inducibility
Figure 1.
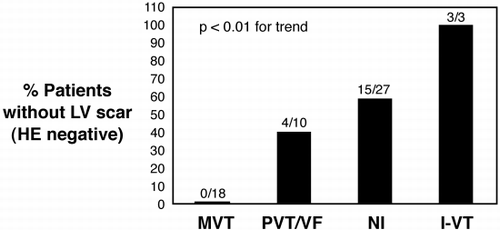
Conclusions: Patients undergoing EPS to determine risk for SD often do not have myocardial scarring on ceMRI. Based on the high negative predictive value of ceMRI for inducible MVT, ceMRI should be considered as a screening test in the diagnostic work‐up of patients at risk for SD prior to invasive EPS.
148. Late Enhancement in MR Imaging of Arrhythmogenic Right Ventricular Cardiomyopathy
Peter Hunold, MD,1 Heiner Wieneke, MD,2 Oliver Bruder, MD,3 Raimund Erbel, MD,2 Jörg F. Debatin, MD,1 Jörg Barkhausen, MD.1 1Department for Diagnostic and Interventional Radiology, University Hospital, Essen, Germany, 2Department of Cardiology, University Hospital, Essen, Germany, 3Department of Cardiology, Elisabeth Hospital, Essen, Germany.
Introduction: Arrhythmogenic right ventricular cardiomyopathy (ARVC) is characterized by total or partial fibro‐fatty replacement of the right ventricular (RV) myocardium, which leads to regional or global dysfunction of the RV. Dilation of the RV, impaired RV ejection fraction with no or only mild impairment of the left ventricular function and localized RV aneurysms are major morphologic criteria for the diagnosis of ARVC. Cine MR imaging provides cross‐sectional images with high spatial and temporal resolution and must be considered the standard of reference for the assessment of wall motion abnormalities. Furthermore, due to the excellent soft tissue contrast MRI can distinguish fat from muscle. Several studies have shown that MRI might directly visualize fatty replacement of myocytes using T1‐weighted sequences. However, no efforts have been made to detect fibrous replacement of the right ventricular myocardium.
Late enhancement in contrast‐enhanced MRI has been proven to reliably detect myocardial scarring in ischemic heart disease, which is mainly characterized by fibrous replacement of necrotic myocardium.
Purpose: Aim of the study was to evaluate whether late enhancement (LE) in contrast‐enhanced MRI can be used to detect fibrous tissue within the right ventricular myocardium in patients with suspected ARVC.
Methods: Twelve patients with suspected ARVC and excluded ischemic heart disease (mean age, 29 yrs; range 19–52 yrs) and 12 healthy volunteers (mean age, 31 yrs; range 26–38 yrs) were enrolled in the study. MRI examinations were performed on a 1.5 T scanner (Magnetom Sonata, Siemens Medical Systems, Erlangen, Germany). Long‐axis and contiguous short axis Cine MRI data sets were collected using a SSFP sequence (TrueFISP; TR, 3 ms; TE, 1.5 ms; FA, 60°). Additionally, T1‐weighted turbo spin echo (TSE) sequences (TR, 700 ms; TE 6.9 ms) with and without fat suppression were added in long and short axis views. Ten to 20 minutes following the injection of 0.2 mmol/kg Gd‐DTPA (Magnevist™, Schering AG, Berlin, Germany), scans were collected in the long and short axis orientation using an inversion recovery turboFLASH sequence (TR, 8 ms; TE, 4 ms; FA, 25°) to detect LE. Slice thickness was 5 mm and the in‐plane resolution was 1.4 × 1.4 mm2 for all sequences.
Results: None of the volunteers showed wall motion abnormalities or contrast enhancement of the RV wall. Six (50%) of 12 patients showed akinetic or dyskinetic areas within the RV myocardium and/or severe dilation of the RV with reduced RV ejection fraction being major diagnostic criteria for ARVC. All six patients had at least one additional major criterion or two additional minor criteria for the diagnosis of ARVC making the diagnosis highly probable. Late enhancement of the RV myocardium was detected in 4 and of the left ventricular myocardium in 2 patients. The additional 6 patients neither presented morphologic criteria for ARVC nor contrast enhancement.
Conclusions: Late enhancement in the right and left ventricular myocardium can be detected in patients with suspected ARVC, whereas volunteers do not show any contrast enhancement. These areas of LE are likely to represent intramyocardial fibrous tissue. Therefore we recommend adding inversion recovery gradient echo sequences after contrast injection to the standard examination protocol in these patients. However, the clinical impact of these findings, e.g. cause of arrhythmia, still has to be defined.
149. Myocardial Delayed Enhancement MRI Detects Myocardial Fibrosis and Is Associated with Worse Left Ventricular Function and Biopsy Increased Collagen Content in Patients with Severe Chronic Aortic Valve Disease
Marcelo Nigri, MD, Max Grinberg, MD, PhD, Flávio Tarasoutchi, MD, PhD, Roney O. Sampaio, MD, Guilherme S. Spina, MD, André M. Bento, MD, Marcello Zapparoli, MD, José R. Parga, MD, Luiz F. Ávila, MD, José AF Ramires, MD, PhD, Carlos E. Rochitte, MD. Cardiovascular Magnetic Resonance Laboratory, Heart Institute‐InCor‐University of Sao Paulo Medical School, São Paulo, Brazil.
Introduction: Severe aortic valve disease can lead to the development of interstitial myocardial fibrosis (MF). This can be detected by myocardial biopsy. Delayed Enhancement MRI technique (MDE) provides the ability of precisely define MF in the myocardial infarction setting and also in other cardiac diseases that course with MF.
Purpose: To evaluate the relationship between MF detected by MRI and by biopsy with rest left ventricular (LV) function in patients (pts) with severe chronic aortic valve disease.
Methods: We evaluated 60 pts, 45 males, mean age 47.6 ± 12.2 years old with severe aortic valve disease. Thirty pts with predominant stenosis and thirty with predominant regurgitation. All pts underwent MRI examination. MRI was performed in a 1.5 T SIGNA CV/i GE scanner using a gradient echo with an inversion‐recovery pre‐pulse after injection of 0.2 mmol/kg of gadolinium‐DTPA for detection of MF (MDE) and a steady state gradient echo (FIESTA‐GEMS) for LV function analysis. Left ventricular ejection fraction (LVEF), end diastolic, systolic and stroke volumes were measured by Simpson's rule using MASS analyses software.
Myocardial biopsy was made during valve replacement surgery in all pts. Biopsy samples were stained by hematoxiline‐eosine and Masson's trichrome technique to investigate MF and were qualitatively classified as presence or absence of MF.
Results: MRI detected MF in 36 patients (60%) with severe chronic aortic disease. Thirty three of those (91.6%) were confirmed by myocardial biopsy. depicts an example (myocardial delayed enhancement indicated by arrrows).
Figure 1.
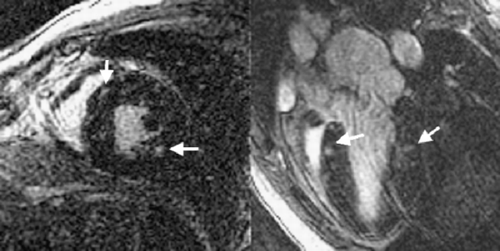
MRI sensitivity and specificity compared to biopsy were: 0.80 and 0.84, respectively ().
LV function differs significantly on those with or without MF defined by MRI or by biopsy (Tables and ).
Table 2. MF by MRI
Table 3. MF by Biopsy
Conclusions: The decrease of left ventricular function in patients with severe chronic aortic valve disease is associated to detectable areas of myocardial fibrosis detected by MRI and by myocardial biopsy. This may contribute to the pathophysiology knowledge of heart failure in this clinical setting.
150. Cardiovascular Magnet Resonance Assessment of Human Myocarditis; A Comparison to Histology and Molecular Pathology
Heiko Mahrholdt, MD,1 Anja Wagner, MD,2 Christine Goedecke, MD,1 Stefan Hager, MD,1 Gabriel Meinhardt, MD,1 Anastasios Athanasiadis, MD,1 Holger Vogelsberg, MD,1 Karin Klingel, MD,3 Reinhard Kandolf, MD,3 Udo Sechtem, MD.1 1Cardiology, Robert Bosch Medical Center, Stuttgart, Germany, 2Cardiology, Duke Cardiovascular MR Center, Durham, NC, USA, 3Institute of Pathology, University of Tuebingen, Tuebingen, Germany.
Introduction: Active myocarditis can occasionally lead to sudden death (SD) in young adults and 10% of all patients (pts) may develop chronic dilated CMP. Since the initial onset is difficult to recognize clinically and the diagnostic tools available are unsatisfactory, new strategies to diagnose and monitor myocarditis are needed.
Methods: Cine and contrast MR imaging (CMR) was performed in 32 pts who were diagnosed with myocarditis by clinical criteria. To determine whether CMR visualizes areas of active myocarditis, endomyocardial biopsies (EMB) were taken from the region of hyperenhancement (HE) and submitted to histological, immunohistological and molecular pathological analysis. Follow‐up CMR (FU) was performed 3 months later.
Results: HE was present in 28 pts (88%) and was mostly seen originating from the epicardial quartile of the wall, most frequently located in the lateral free wall. In the 21 pts, in whom EMB was obtained from the region of HE, active myocarditis was found in all except two (PVB 19, n = 13; HHV 6, n = 6;). Conversely, in the remaining 11 pts in whom EMB was not taken from HE active myocarditis was found in one case only (EBV). At follow‐up the amount of HE decreased from 9 ± 11% to 3 ± 4% (FU) of LV mass as the LVEF improved from 47 ± 19% to 60 ± 10% (FU) and the end‐diastolic volume decreased from 174 ± 80 ml to 133 ± 47 ml (FU) ().
Figure 1.
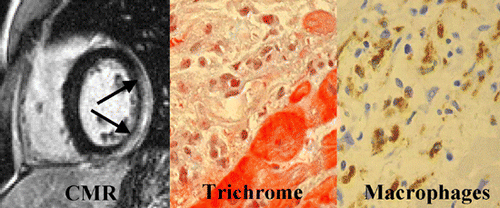
Conclusions: HE is a frequent finding in the clinical setting of myocarditis and is associated with active inflammation defined by histology and immunohistology. Myocarditis occurs predominantly in the lateral free wall, originating from the epicardial quartile of the myocardium. CMR is a powerful tool to diagnose and monitor human myocarditis.
151. Non‐invasive Early Detection of Acute Cardiac Allograft Rejection by MRI
Yijen L. Wu, Ph.D.,1 Kazuya Sato, M.D.,1 Ying Sun, M.Eng.,2 Jose M. F. Moura, Ph.D.,2 Chien Ho, Ph.D.1 1Pittsburgh NMR Center for Biomedical Research, Carnegie Mellon University, Pittsburgh, PA, USA, 2Department of Electrical and Computer Engineering, Carnegie Mellon University, Pittsburgh, PA, USA.
Introduction: Endomyocardial biopsy (EMB) is the clinical “gold standard” for evaluating rejection after heart transplantation. However, EMB is not only invasive but also prone to sampling errors. It is highly desirable to have a non‐invasive alternative.
Purpose: The goal of this study is to establish cardiac MRI functional indexes for early and non‐invasive detection of acute cardiac allograft rejection.
Methods: Animal Model—We have developed an abdominal heterotopic working heart and lung transplantation rat model with DA to BN rat pair (). The grafts received adequate pre‐load and exhibited physiological range of stroke volume (SV), ejection fraction (EF), and pressure, all close to those of native hearts. The cardiac functions of the allogeneic group (DA to BN) are compared to the syngeneic controls (DA to DA, or BN to BN). Total 38 transplantation pairs were studied. The progression of the acute rejection is determined by histology right after the MRI evaluation (). MRI Methods—Cine imaging was used to evaluate cardiac function with the following imaging parameters: FOV = 4 cm; resolution = 156 × 156 × 1500 µm3; TR = a cardiac cycle (about 165 msec); TE = 5.5 msec. Cardiac tagging was achieved by a modified DANTE sequence. All MRI scans were performed on Bruker AVANCE DRX 4.7‐T system.
Figure 1.
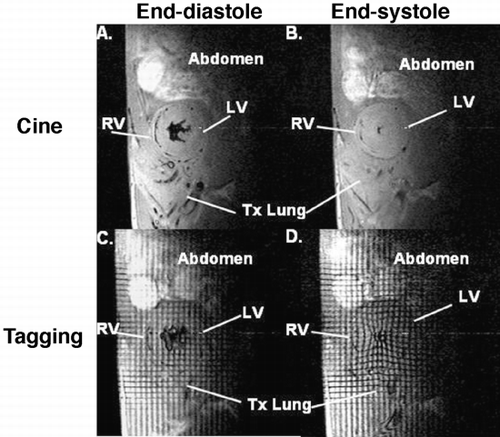
Table 1. Histologically Determined Rejection Grades for the Heterotopic Transplanted Hearts
Results: We have previously reported that not until the cardiac allografts suffered severe acute rejection, no significant changes in global systolic functions were detected. Thus, the focus of this study is to investigate the early cardiac rejection before the severe rejection occurred on the post‐operational day (POD) 3, 4, and 5. No detectable changes in heart rate, SV or EF were observed at this stage.
We have explored the time‐dependent characteristics of the LV ventricular volume and the LV wall motion in the working heart transplantation. Each of the phases in a cardiac cycle can be identified from the ventricular and wall analysis: isovolumic contraction, ejection, isovolumic relaxation, rapid filling, diastasis, and atrial contraction. The relative time span and the rate constant of each phase are extracted from the time‐dependent volume or wall thickness curves (). All isografts and allografts undergoing mild to moderate rejection largely exhibited similar volume‐time relationship. Most of the parameters examined had shown no significant changes, except the diastolic rate constant and the relative time span for the isovolumic relaxation (TIVR). As rejection grades increased over time, TIVR increased significantly for allografts (), which is indicative of gradual loss of diastolic function. Conversely, TIVR decreased over time for isografts, which is due to recovering from the ischemic injury of operation. The result suggests that TIVR can be a sensitive index for early diastolic dysfunction resulting from acute rejection.
Figure 2.
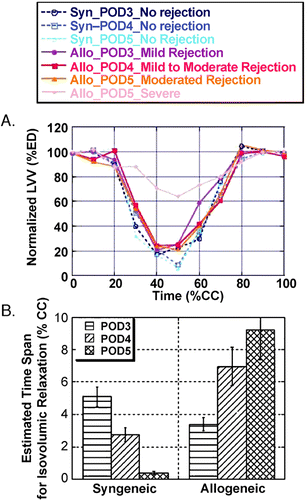
In addition, some of the allografts exhibited spatial heterogeneity in contractility. shows the strain, twist and radial shortening mapped by tagging of a moderately rejected allograft. The brightness of the strain map (A, B) represents the extent of stretching. The angle and the extent of the twist and radial shortening (C, D) are represented by the direction and the length of the arrow heads at each intersection of tag lines. For this particular heart, the inferolateral (upper left) and anterior (lower right) LV wall preserved most of the motility whereas the anterolateral wall (lower left) has lost its contractility.
Figure 3. (View this art in color at www.dekker.com.)
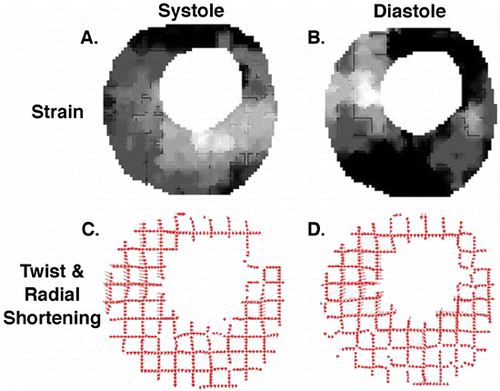
Conclusions: Our data suggest that diastolic dysfunction precedes systolic functional loss. The relative time span of the isovolumic relaxation can be a sensitive index for the early diastolic dysfunction. The spatially heterogeneity of the functional loss can be revealed by cardiac tagging.
152. Infarct Size Measurement Using Fast T1‐Mapping and Correlation with Myocardial Delayed Enhancement
Sandeep N. Gupta, Ph.D.,1 Manojkumar Saranathan, Ph.D.,1 Izlem Izbudak, Ph.D.,2 Dara L. Kraitchman, Ph.D.2 1Applied Science Laboratory, GE Medical Systems, Baltimore, MD, USA, 2Department of Radiology, Johns Hopkins University, Baltimore, MD, USA.
Introduction: Myocardial delayed enhancement (MDE) imaging has been widely used for identifying the size and location of myocardial infarction and for assessing viability and predicting recovery of function after revascularization (Kim et al., [Citation1999]). An inversion‐recovery prepared fast gradient‐echo sequence is the most commonly used technique for MDE imaging. In this technique, imaging parameters such as delay‐time after contrast injection and inversion time (TI) must be chosen appropriately in order to null normal myocardium and accurately determine infarct size based on the extent of hyper‐enhancement (Kim et al., [Citation2003]; Oshinski et al., [Citation2001]).
Purpose: We present here a method for fast T1 mapping of the myocardium, and demonstrate correlation between infarct size measurements from T1 maps and regional signal hyper‐enhancement from MDE images. Our method can be used for mapping infarcted tissue directly based on regional T1 differences due to differential Gd uptake eliminating the need for accurate setting of TI or delay‐time.
Methods: Seven mongrel dogs were subjected to a closed‐chest myocardial infarction via a 90‐minute balloon occlusion followed by reperfusion. MR imaging was performed under general isoflurane anesthesia 1–8 weeks post‐infarction on a 1.5T GE Signa CV/i scanner. Short‐axis MDE images were acquired 15–20 minutes after 0.2 mmol/kg i.v. bolus of Gd‐DTPA. Imaging parameters were: TR/TE = 7.2/3.2 ms; FOV 28 × 21 cm; TI 150–200 ms; NSA 2; BW 32 kHz; slice thickness 8 mm; flip 25 deg, and views‐per‐segment 16. For T1 mapping, a saturation‐recovery gradient‐echo sequence was used, in which 10 different preparation times ranging from 50 ms to 750 ms were acquired sequentially in 2 or 3 breathholds. The matrix size was 256 × 128 and views‐per‐segment was 24.
Results: Infarct size from MDE images was measured semi‐automatically using full‐width at half‐max thresholding using a custom software (CINE, GE Medical Systems).T1 maps were calculated from the multiple TI images dataset using pixelwise curve‐fitting. Infarct size was then measured automatically by thresholding the R1 maps (the reciprocal of the T1 maps). Sample MDE image and the corresponding curve‐fit R1 map are shown in Figure and below. Infarct size measurements from the two methods for all cases are plotted in Figure and have a strong correlation (R2 = 0.98).
Figure 1. (a) MDE image from a dog (b) Corresponding R1 map (c) Correlation of infarct size between MDE and T1 mapping. (View this art in color at www.dekker.com.)
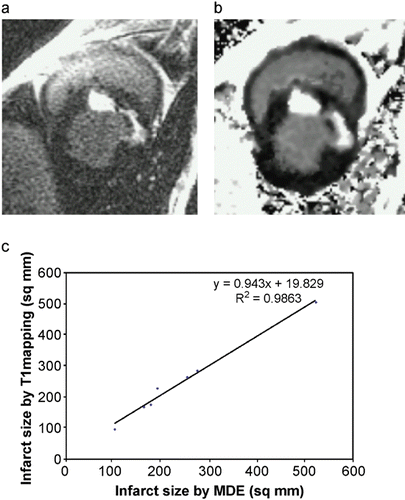
Conclusions: We have shown that infarct sizing using fast T1 mapping correlates well with MDE imaging. Using T1 mapping obviates the need to pick an exact TI time and is further expected to be insensitive to variations in imaging delay time after contrast injection. Thus, inaccuracies in infarct size measurements can be avoided with T1 mapping. In addition, T1 mapping has the potential of better characterization of infarct border zones.
153. Three‐Dimensional Reconstruction of Cardiac Fiber Structure Using Diffusion Tensor MRI
Peter Schmid, Urs Gamper, Thomas Jaermann, Sebastian Kozerke, Peter Boesiger. Institute for Biomedical Engineering, University and ETH, Zurich, Switzerland.
Introduction: Myocardial fiber structure correlates with anisotropy in the water self‐diffusion of the myocardium (Hsu et al., [Citation1998]), which can be assessed by using diffusion tensor MRI. Measuring the diffusion eigenvalues in each voxel of a complete heart allows visualization of the myocardial fiber structure, following the direction of the largest diffusion eigenvalue.
Purpose: The aim of this work was to measure the diffusion eigenvalues of an entire pig heart post mortem and to visualize the myocardial fiber structure in 3D.
Methods: Sample Preparation—Fat, coronaries, atria and papillary muscles of a fresh pig heart were removed to reduce image artefacts. The heart was then fixed in a box (11 × 11 × 12 cm3) filled with agarose gel which was doped with copper sulfate to obtain better signal contrast between myocardium and the surrounding gel. Diffusion Tensor Imaging—The measurements were performed on a 3 T Philips Intera whole body MR system (Philips Medical Systems, Best, NL) using a coil array with 4 rectangular elements for signal reception. A multi‐slice Stejskal–Tanner sequence was used to obtain diffusion weighting in 6 independent directions. Images were acquired using single‐shot echo‐planar imaging (EPI) in combination with SENSE to reduce EPI‐related artefacts (Bammer et al., [Citation2001]). Imaging parameters were: FOV = 130 × 130 mm2, 80 × 80 image matrix, SENSE‐factor = 1.9 (in‐plane spatial resolution = 1.62 × 1.62 mm2), slice thickness = 2 mm, TR = 10.2 s, TE = 70 ms, flip angle α = 90°, number of signal averages = 9, diffusion gradient = 3.1 G/cm (b = 900 s/mm2). A 3D volume of 43 adjacent short axis slices was acquired covering the entire heart. The total measurement duration was about 20 min. For validation purposes, diffusion weighted images of a papillary muscle which exhibits a well defined longitudinal fiber orientation were also collected and analyzed separately. Fiber Reconstruction—The 6 diffusion weighted images were segmented and registered using a 2D affine image registration algorithm to correct for residual image shifts due to eddy currents. For each slice, the diffusion tensor matrix and the corresponding three eigenvalues of each voxel were calculated. The fibers were reconstructed using a backward trilinear tensor tracking algorithm (Mori et al., Citation[2002]).
Results: The diffusion‐weighted image of the papillary muscle is shown in . The color indicates a uniform fiber orientation in the longitudinal direction as known from histological examinations. shows the fiber orientation of the right ventricle (RV) and the left ventricle (LV) in an equatorial short axis slice. The fibers on the outer and the inner surface of the LV are angulated with respect to the image plane whereas the inner fibers are more circularly oriented.
Figure 1. Diffusion images of the papillary muscles a) the short axis slice b) and the whole heart c). The green color indicates a main diffusion in up‐down, red in the left‐right and blue in the throughplane direction. (View this art in color at www.dekker.com.)
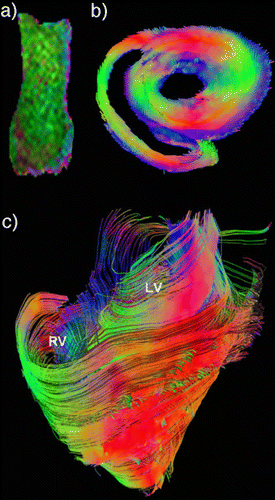
Discussion: The excellent correspondence of papillary fiber orientation detected with diffusion‐weighted imaging with data from histology indicates the validity of the methods used. Fiber orientations reconstructed for both ventricles of the pig heart were in accordance to previous histological examinations (Streeter et al., [Citation1969]).
It is concluded that diffusion tensor imaging at high field strength incorporating SENSE allows accurate reconstruction of global fiber structure in ex‐vivo samples with reasonably short measurement times. The method holds great potential in complementing histological examinations used to study changes of cardiac fiber orientations associated with a variety of diseases.
154. A Novel Radial MRI Technique for Obtaining High‐Resolution Images of the Heart with Variable Contrast from a Single k‐Space Data Set
Maria I. Altbach,1 Zhiqiang Li,2 Ali Bilgin,2 Frank I. Marcus,3 Theodore P. Trouard,4 Arthur F. Gmitro.1 1Department of Radiology, University of Arizona, Tucson, AZ, USA, 2Department of Electrical and Computing Engineering, University of Arizona, Tucson, AZ, USA, 3Department of Medicine, University of Arizona, Tucson, AZ, USA, 4Biomedical Engineering Program, University of Arizona, Tucson, AZ, USA.
Introduction: Radial MRI is a motion insensitive technique that has been used as an alternative to FT MRI for thoracic and abdominal imaging. Recently, it was demonstrated that radial MRI can be used to obtain high‐resolution images with variable contrast from a single k‐space data set (Altbach, [Citation2002]; Song, [Citation2000]). This is particularly useful in cardiac imaging because images with different contrast can be generated from data acquired in a breath hold. Since there is no misregistration between images, contrast can be compared on a pixel by pixel basis which should improve tissue characterization.
Purpose: One goal of this work is to develop a reliable an efficient method to obtain high‐resolution T2 maps of the heart that can be used in the clinic for the characterization of pathologies. Another goal is to develop a method to obtain high‐resolution fat and water images from data acquired in a breath hold to improve the diagnosis of arrhythmogenic right ventricular dysplasia (ARVD).
Methods: The method consists of a double inversion (DBIR) preparation period followed by a radial fast spin‐echo (RADFSE) acquisition period. DBIR RADFSE was implemented on a 1.5 T GE Signa MRI scanner. A phased‐array torso coil was used for detection. Data were acquired with cardiac gating in a breath hold, using an ETL = 16, 160 radial views, BW = ± 32 kHz, TR = 2RR, and NEX = 1.
Images at various TEeff were generated from a single k‐space data set using data corresponding to a specific TE in the central part of k‐space, up to a radius determined by the Nyquist condition. Radial views acquired at other TE values were incorporated in a progressive manner from the Nyquist point to the outer part of k‐space. Interpolation and complex filtered backprojection were used to reconstruct images. T2 maps were generated by fitting the pixel intensity on the T2‐weighted images, I, to I = Ioexp(− TEeff/T2).
To generate fat‐suppressed and water‐suppressed images from a single radial k‐space data set, fat and water suppression (using a chemical shift selective pulse) was alternated between TR periods. Thus, half of the data were acquired with fat suppression and half were acquired with water suppression. An image was generated from each data set using complex filtered backprojection.
Results: shows images at different TEeff generated from a single DBIR RADFSE k‐space data set. The high‐resolution T2‐weighted images and T2 map were obtained from data acquired in one breath hold.
Figure 1. Images at various TEaff and T2 map generated from a single DBIR RADFSE k‐space data set.
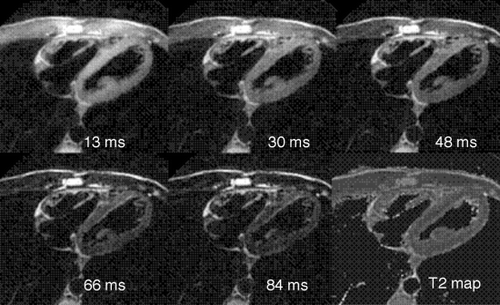
show the water and fat images obtained from a single k‐space data set. Since the data were obtained in a breath hold by interleaving the acquisition of fat‐ and water‐suppressed radial views, there is no misregistration of pixels between the fat and water images. Moreover, since the resonance frequency was centered on water or fat for acquiring fat‐ or water‐suppressed data, respectively, there is no misregistration due to chemical shift. Thus a colored lipid map (shown in white in ) can be overlaid on the water image for better identification of the lipid component.
Figure 2. (a) Water and (b) fat images of a normal subject generated from a single DBIR RADFSE k‐space data set. (c) Lipid map (bright white pixels) generated from (b) and overlaid on (a).
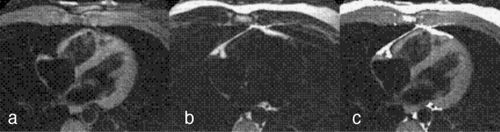
Conclusions: A DBIR RADFSE method has been developed for obtaining high‐resolution T2‐weighted images or fat and water images from a single k‐space data set. The major advantage of the method is that high‐resolution data with variable contrast are obtained in the same breath hold. This minimizes misregistration thus allowing comparison of data on a pixel by pixel basis. The T2 method can potentially improve the diagnoses of inflammatory processes, infarction, or cardiomyopathies. The fat and water method has the potential to improve the identification of lipid infiltration in ARVD.
This work was supported by the American Heart Association and NIH.
155. Evidence of Malic Enzyme Activity in Isolated Perfused Rabbit Hearts by 13C‐NMR Spectroscopy
Hetal R. Bhakta, M.D.,1 James R. Rocca, PhD,2 John R. Forder, Jr., PhD.3 1Internal Medicine, University of Southern California, Los Angeles, CA, USA, 2Mc Knight Brain Institute, University of Florida, Gainesville, FL, USA, 3Cardiovascular Medicine, University of Southern California, Los Angeles, CA, USA.
Introduction: The tricarboxylic acid cycle (TCA) plays a central role in energy production in the heart. In addition, it also provides biosynthetic intermediates for many anabolic pathways. Thus, in order to prevent impairment of the TCA, cataplerotic pathways (which deplete TCA intermediates by using them as substrate for biosynthesis of other molecules) need to be balanced with anaplerotic pathways (which increase TCA intermediates by providing entry of substrates at sites other than through acetyl‐CoA) so that mitochondrial concentrations of the intermediates remains constant. The existence of this enzyme has been well established in many tissues (Kim et al., [Citation1995]). There has also been indirect evidence of malic enzyme activity, with the direction of the net flux dependent upon intracellular redox state and/or substrate concentrations (Sundqvist et al., [Citation1987]). Significant activity of this pathway could confound analysis of 13C‐NMR spectra. In this report, we provide direct evidence for significant activity of this pathway in isolated perfused rabbit hearts.
Purpose: To determine the utility of 13C‐NMR spectroscopy to quantitate malic enzyme activity under controlled conditions in the isolated perfused rabbit heart.
Methods: Hearts (n = 20) were isolated from New Zealand White male rabbits (1.5–2 kg) and perfused at 37°C in a modified Langendorff preparation. Buffer was a modified Krebs Henseleit solution containing 3% bovine serum albumin, 0.7 mM palmitate, 0.2 mM Î2‐hydroxybutyrate, and 5 mM glucose as metabolic substrates. Insulin was added to the buffer (10  µU/mL) to aid glucose uptake. Perfusion pressure was maintained at 75 mmHg, and a balloon was placed into the left ventricle for continuous monitoring of developed pressures. Following an equilibration period for physiological parameters to stabilize, hearts were switched to a buffer containing 13C‐labeled substrates (2,4–13C‐Î2‐hydroxybutyrate, U‐13C‐palmitate), and perfused for 2,4,6,8,10,15,30,or 45 minutes. Hearts were rapidly frozen with liquid nitrogen cooled tongs, and extracted using perchloric acid. 13C‐NMR spectroscopy was performed on the extracts and isotopomer analysis was used to calculate the fractional enrichments of glutamate.
Results: The concentration of the TCA intermediates is below the levels required for isotopomer analysis using 13C NMR spectroscopy. Thus, enrichment patterns of glutamate (which is in rapid exchange with Î ± ‐ketogluterate, and present in detectable concentrations) are used for isotopomer analysis in order to reflect TCA turnover. The substrates presented to the heart in the perfusion buffer (2,4‐13C‐Î2‐hydroxybutyrate, U‐13C‐palmitate) will result in the generation of acetyl Co‐A that is labeled in the C2 position, or both the C1 and C2 positions, respectively. 13C‐2‐acetyl Co‐A should not enrich the C5 of glutamate, and labeling pattern due to 1,2‐13C‐acetyl Co‐A should be reflected in the C5 position of glutamate by the appearance of a doublet. The analysis of the obtained spectra revealed the presence of a C5 singlet in glutamate. The C5 singlet of glutamate arises from C1 enriched acetyl Co‐A. Upon review of existing literature and computer simulation models it was concluded that the occurrence of these specific enrichments is most likely due to flux from malate to pyruvate through malic enzyme/PEPCK, which would yield 1‐13C‐acetyl Co‐A. The presence of the C5 singlet was measured against the presence of the C5 doublet, and the fractional enrichment calculated, to ensure that we were well above the levels of natural abundance.
Conclusions: Under these perfusion conditions, flux through malic enzyme in the rabbit heart was significant; estimated at ≥25% of the total TCA cycle turnover. 13C NMR spectroscopy can be used to quantitatively measure malic enzyme activity by careful selection of labeled substrates for perfusion along with concomitant observation of the glutamate C5 singlet.
156. Evaluation of Free‐Breathing Balanced Fast Field Echo Whole Heart MR Angiography
David Maintz,1 Murat Ozgun,1 Andreas Hoffmeier,2 Markus Quante,1 Roman Fischbach,1 Warren J. Manning,3 Walter Heindel,1 René M. Botnar.3 1Department of Diagnostic Radiology, University of Münster, Münster, Germany, 2Department of Cardiac and Thoracic Surgery, University of Münster, Münster, Germany, 3Beth Israel Deaconess Medical Center, Boston, MA, USA.
Introduction: Free breathing coronary MRA is usually obtained in double oblique orientations targeted to the right or left coronary artery system. Coronary MRA covering the whole heart with transverse slices would offer advantages including distal segment and branch vessel visualization, comparability to CTA, advanced 3D‐reconstructions and simplified scan planning.
Purpose: Evaluation of a recently proposed free breathing coronary MR angiography technique covering the whole coronary artery tree in one single data acquisition.
Methods: Five healthy volunteers and 17 patients with known CAD were examined with a navigator (NAV) gated and corrected free‐breathing 3D balanced Turbo Field gradient echo (BTFE) sequence covering the whole heart (WH‐MRA) using parallel imaging (TR = 5.4, TE = 2.7, SENSE factor = 2, 160 slices, 0,75 mm reconstructed slice thickness, transverse orientation, in‐plane resolution = 0.99 × 0.99 mm, scan time = 14 min (50% NAV efficiency). The patients were additionally examined with a vessel targeted thin slab 3D BTFE MRA sequence (TR = 5.6 ms, TE = 2.8 ms, 20 slices of 1,5 mm reconstructed slice thickness, in‐plane resolution = 0.99 × 0.99 mm, scan time = 7 min (50% NAV efficiency)), and with coronary 16‐slice‐CT angiography (CTA). Subjective image quality (4 point scale) and objective image quality parameters including vessel sharpness, vessel diameter, SNR and CNR were calculated for WH‐MRA and BTFE‐MRA. Vessel visibility and accuracy for detection of stenoses > 50% were compared to X‐ray catheter coronary angiography (XA), which was considered the goldstandard.
Results: WH‐MRA demonstrated good vessel visibility in healthy subjects (100%) whereas in patients, vessel visibility was limited (70% in a 11 segment evaluation, 78% in an 8 segm. eval.). Vessel visibility was 91% with CTA (11 segm. eval.) and 84% with vessel targeted thin slab BTFE (8 segm. eval.). Vessel sharpness of the whole heart scan was comparable to targeted BTFE‐MRA in patients (35% vs. 37%). In healthy subjects vessel sharpness was 47%. No significant differences were found in vessel diameter between WH‐MRA and targeted BTFE‐MRA. SNR and CNR were significantly reduced for the WH‐MRA (SNR: 12 vs. 18.6, CNR 7.3 vs. 10.9). Diagnostic accuracy for the detection of CAD was inferior for WH‐MRA (78%) when compared to CTA (84%), but comparable to targeted BTFE‐MRA (79%) ().
Figure 1. WH‐MRA of RCA in a healthy subject.
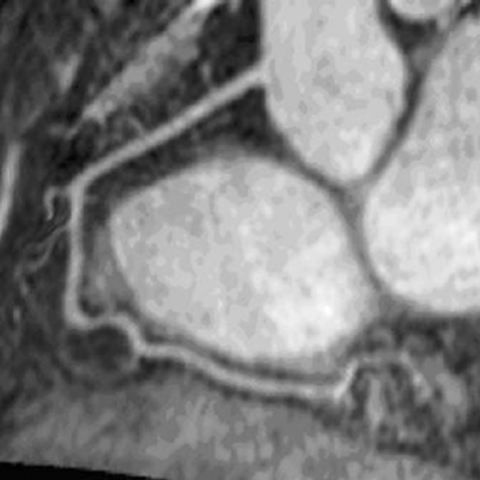
Figure 2. WH‐MRA of LCA in a healthy subject.
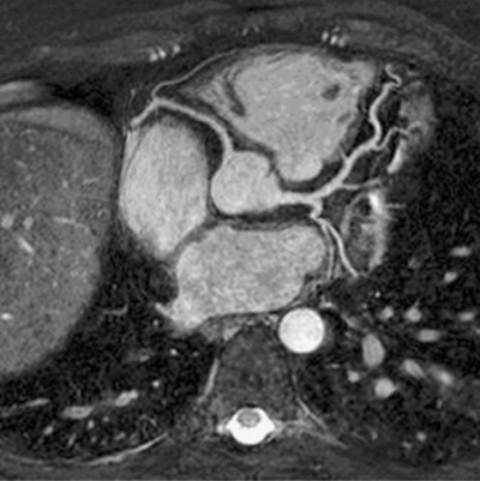
Figure 3. WH‐MRA‐surface shaded 3D‐reconstruction. (View this art in color at www.dekker.com.)
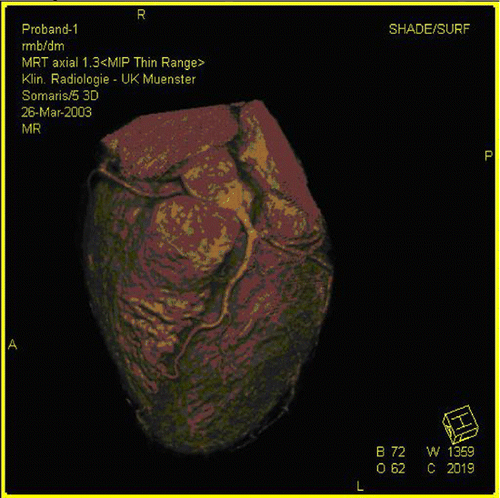
Conclusions: We successfully demonstrate the use of WH‐MRA for coronary visualization in healthy subjects. The technique facilitates visualization of more distal segments and side branches and offers a simplification of the scan planning procedure in comparison to targeted MRA. 3D reconstruction properties are comparable to CTA. In patients, subjective/objective image quality and accuracy for detection of CAD was comparable to targeted BTFE‐MRA but slightly inferior to CTA.
157. Clinical Value of Axial Thoracic HASTE in CMR
Rainer Ott,1 Brigitte Bathgate,1 Corina Cozub‐Poetica,1 Ralf Banach,1 Volkhardt Fiedler,2 Heinz Klues.3 1Institute for Cardiovascular MR Krefeld, Krefeld, Germany, 2Department of Radiology, Klinikum Krefeld, Krefeld, Germany, 3Department of Cardiology, Klinikum Krefeld, Krefeld, Germany.
Introduction: Cardiovascular MR is an excellent diagnostic tool for detecting cardiac diseases and malformations. However coexisting thoracic pathology is neglected in most cases, though the method holds the potential to deliver additional information with minimal effort.
Purpose: To implement and evaluate a quick‐screening examination for thoracoabdominal pathology in a routine CMR study.
Methods: From October 2002 to June 2003, 1033 patients with known or assumed cardiac diseases underwent CMR on a 1.5 T Siemens Sonata scanner. Mean age 65 ± 8 yrs, range 11–88 yrs.; sex: 602 males, 398 females.
Individuals received a CMR examination plus a thoracic screening with a fast‐sequence protocol.
Dependent upon patient stature, 17 to 27 axial thoracic slices of a multi‐slice, dark blood prepared Half‐Fourier Acquisition Single‐Shot Turbo Spin Echo (HASTE) sequence were acquired during each scan in order to cover a region between the apex of the lungs and the left sinus phrenicocostalis. This means that not all upper abdominal organs were examined in their entirety, but such was not the target of this study.
Scan parameters included: TR = 800 ms, trigger pulse = 2, TE = 26 ms, FOV = 360 mm, matrix 256 × 256, slice thickness 8 mm. We performed the scan ECG triggered and with two breath‐holds. Scans lasted from 21 and 53 secs. If patients were unable to retain their breath for both breath‐hold periods, they were instructed to breathe flatly for the remainder of the scan duration.
Results: In 23 cases (2.2%) imaging could not be performed or completed due to claustrophobia (n = 19; 1.8%) or non‐MR‐compatible metallic implants (n = 4; 0.4%). In the remaining 1000 patients, axial thoracic HASTE sequence was diagnostic in all cases.
In 290 (29.0%) of 1000 patients we made 327 extra‐cardiac diagnoses. These are as follows:
Of these diagnoses some are without clinical importance, while others possess high clinical or prognostic value.
Based upon our results obtained through this screening method, we recommended to patients that they undergo further testing to confirm our suspected diagnoses.
Conclusions: The implementation of a quick‐screening protocol for extra‐cardiac thoracoabdominal pathology in a routine CMR examination, is feasible and can be completed in less than one minute. HASTE as an ultrafast, stable and robust sequence, proved to be highly appropiate for this purpose, due to its insensitivity to artifacts.
Thoracoabdominal pathology is common and in some patients of highly prognostic relevance. Fast screening protocols should be a fixed component of a routine CMR examination. Due to the minimal extent of this protocol, an expanded examination is called for so that all upper abdominal organs are fully represented.
158. Histologic Validation of In‐Vivo Characterization of Plaque Components by Intravascular MRI
Walter J. Rogers, PhD,1 C.Joon Choi, MD, PhD,2 Frederick H. Epstein, PhD,1 Kamal Vij, PhD,3 Tom Sierocuk,4 Christopher M. Kramer, MD.1 1Radiology, University of Virginia, Charlottesville, VA, USA, 2Cardiology, University of Virginia, Charlottesville, VA, USA, 3ViaRes Technologies, Chandler, AZ, USA, 4Cordis Corporation, Miami Lakes, FL, USA.
Introduction: Magnetic Resonance Imaging is capable of identifying major atherosclerotic plaque components based on differences in their biochemical structure. However, surface coils do not produce sufficient signal‐to‐noise (SNR) within deep arteries to acquire images with the spatial resolution required to evaluate individual plaque components. Because of their proximity to the vessel wall, catheter‐based receiver coils can produce substantially more SNR than any current surface coils, and have sufficient penetration to image the full thickness of diseased arteries.
Purpose: The purpose of this study was to evaluate the ability of in vivo intravascular MRI (IV‐MRI) to identify iliac plaque components in a swine model of atherosclerosis containing the full spectrum of disease from minimal to advanced.
Methods: Three Adult Yucatan Mini pigs were fed a high cholesterol diet for 2 weeks prior to endothelial denudation by 3 × inflated balloon withdrawal in the proximal vessel segments. Stents were deployed at the distal extent of the arterial injury as a marker. Animals were maintained on high cholesterol diet for 41 ± 5 weeks. IV‐MRI was performed on a Siemens Sonota using an investigational 5F actively‐decoupled opposed‐solenoid imaging catheter (Cordis, Warren NJ). ECG gated, cross‐sectional dark blood, Fast Spin Echo images were acquired with T1‐weighting (TR = 1 RR, TE = 8.9 msec) and T2‐weighting (2 RR, TE = 128 msec). Slice thickness was 2 mm and FOV = 70 × 60 mm, matrix 256 × 208 yielding an isotropic 300 micron in‐plane resolution. Image pairs were acquired every 5 mm from stent to aorta. The position of the acquired image was documented with coronal images visualizing both stent and IV coil. Immediately after IV‐MRI, vessel segments were excised, fixed and 5 micron cross‐sections stained with Movat Pentachrome and Sirus Red. Images were classified according to a modified AHA type into I, II–III, VI–V, and VIbased on observed components. Two observers reviewed the histologic sections and defined a modified AHA classification by consensus without knowledge of the IV‐MRI results.
Results: A total of 35 atherosclerotic vessel segments were imaged by IV‐MRI. The shows an atherosclerotic arterial cross‐section. A variable thickness fibrous cap, overlying an organizing thrombus can be seen as a region of near white color by Movat staining and a region of bright signal on the T2‐weighted IV‐MRI (arrows).
Figure 1. (View this art in color at www.dekker.com.)
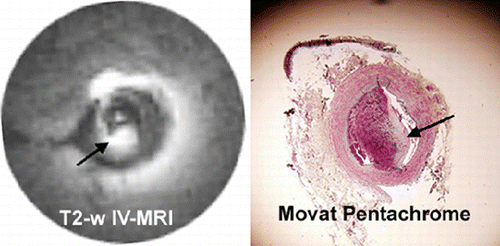
The compares the agreement between IV‐MRI and histologic classifications. Cohen's kappa was 0.63 indicating good agreement between modalities. In general IV‐MRI agreed with histology and the two modalities were never discordant by more than one classification type.
Conclusions: In‐vivo IV‐MRI using T1 and T2‐weighted dark blood imaging was able to identify and differentiate iliac atherosclerosis based on visualization of fibrous caps, lipid inclusions and intimal thickening. This study indicates that high‐resolution plaque imaging is feasible and accurate using intravascular imaging catheters.
159. Accuracy of In Vivo Quantitative Characterization of Atherosclerotic Carotid Plaque: A High‐Resolution, Multi Contrast Magnetic Resonance Imaging Study
Tobias Saam, MD,1 Marina S. Ferguson, BS,1 Vasili L. Yarnykh, PhD,1 Dongxiang Xu, PhD,1 Nayak L. Polissar, PhD,2 Thomas S. Hatsukami, MD,3 Chun Yuan, PhD.1 1Department of Radiology, University of Washington, Seattle, WA, USA, 2The Mountain‐Whisper‐Light Statistical Consulting, Seattle, WA, USA, 3Department of Surgery, University of Washington, Seattle, WA, USA.
Introduction: Currently endpoints used in clinical trials to study plaque progression and/or regression are based on wall thickness measurements. High‐resolution MRI has been shown to be able to identify the presence or absence of the main atherosclerotic lesion constituents in carotid arteries and could provide additional information in clinical trials regarding plaque composition.
Purpose: The purpose of this study was to evaluate the ability of MRI to not only identify the presence of carotid plaque constituents, but also to measure the quantity of constituent material in vivo, compared to histology.
Methods: Twenty‐two randomly selected patients with at least average image quality, scheduled for carotid endarterectomy were imaged with a 1.5 T scanner after informed consent. A standardized protocol was used to obtain 4 contrast‐weighted images (TOF, T1, PD, and T2). Area measurements of lumen, wall area, lipid rich/necrotic core, hemorrhage, calcium and loose matrix were compared between 144 in vivo MR images and matched histology sections. These measurements were performed using a custom‐designed imaging analysis tool (QVAS). Sensitivity (S) and specificity (SP) is given for each feature at 144 locations. The mean area of each component was calculated per artery and the Pearson correlation (R) coefficient was used to correlate the MRI and histology measurements.
Results: The matched in vivo MR images and histology slices showed strong and highly significant correlation for lumen area (R = 0.84), wall area (R = 0.80), size of the lipid rich/necrotic core (R = 0.76; ), hemorrhage (R = 0.75; ) and calcification (R = 0.78; ).
Figure 1. Regression line for the accuracy of measurements of the necrotic core comparing histology and MRI.
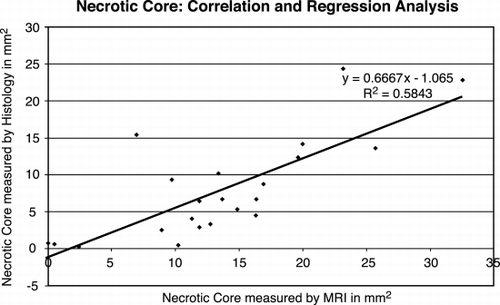
Figure 2. Regression line for the accuracy of measurements of calcium comparing histology and MRI.
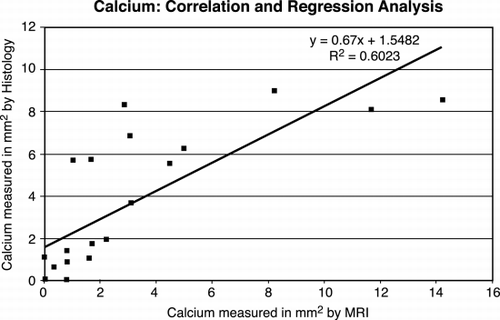
Figure 3. Regression line for the accuracy of measurements of hemorrhage comparing histology and MRI.
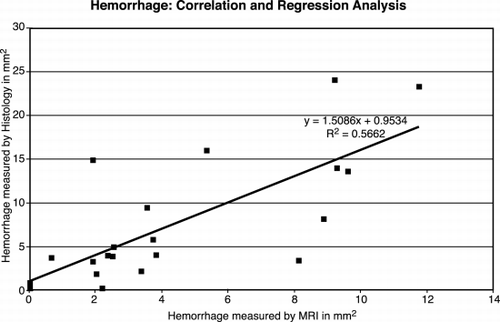
Agreement for loose matrix was moderate (R = 0.60). The overall sensitivity and specificity was good for lipid rich/necrotic core (S = 93%; SP = 62%), hemorrhage (S = 90%; SP = 72%) and calcium (S = 81%; SP = 89%) and moderate for loose matrix (S = 62%; SP = 71%).
Conclusions: High‐Resolution MRI is potentially a powerful tool to characterize and measure the components of the carotid atherosclerotic plaque. Future MRI studies in clinical trials are feasible with this technique.
160. Long‐Term Follow‐Up Study to Visualize Plaque Growing in Hereditable Hyperlipidemic Rabbits Using Gadofluorine Enhanced MRI
Jörg Barkhausen, MD,1 Wolfgang Ebert, PhD,2 Claudia Heyer,2 Jörg F. Debatin, MD,1 Hanns J. Weinmann, PhD.2 1Department of Diagnostic Radiology, University Hospital Essen, Essen, Germany, 2Schering AG, Berlin, Germany.
Introduction: Cardiovascular diseases are still the leading cause of death in western societies. In the early stages atherosclerotic plaques are invisible with luminographic techniques, because they develop without compromising the arterial lumen. However, these early plaques are of great clinical interest because plaque rupture followed by thrombus formation may result in acute coronary syndromes. About 1/3 of myocardial infarction occur in vascular segments which were considered to be normal at catheter angiography.
Contrast agents, which are taken up in plaques and increase the contrast‐to‐nose ratio between plaques and the normal arterial wall can improve the detection of early atherosclerotic lesions independent from high‐resolution MR imaging. Previous studies have shown that Gadofluorine enhances aortic wall segments with plaque burden in Watanabe hereditary hyperlipidemic rabbits and distinguishes these segments from normal vessel wall.
Purpose: To monitor the progression of atherosclerotic plaque in‐vivo using T1w MRI in conjunction with a recently introduced contrast agent.
Methods: 6 Watanabe heritable hyperlipidemic (WHHL) rabbits underwent MRI of the aortic arch at the age of 6, 9, 12, 15 and 18 month. A standardized imaging protocol ensured identical slice positions for the pre‐contrast and post‐contrast scans as well as for all follow‐up examinations. Imaging was performed before and 48 h after injection of 100 µmol Gadofluorine (Schering AG, Berlin, Germany) in 3 animals, whereas the additional rabbits were examined before and up to 90 minutes after injection of Magnevist (Schering AG, Berlin, Germany). A HASTE sequence (TR 700 ms, TE 60 ms, FA 150°) and a T1‐weighted inversion recovery turboFLASH sequence (TR 300 ms, TE 4 ms, TI 120 ms, FA 30°) were used for data acquisition. Contrast‐to‐noise ratios between enhancing plaques and the surrounding tissues were calculated based on signal intensity measurements in the vessel lumen, in plaques and in the surrounding fat tissue. Noise was defined as the standard deviation in an artefact free area outside the animal.
Results: Plain MR imaging detected no plaques in the aortic arch of the WHHL rabbits at any time during this study. In the Magnevist group the vessel wall of the WHHL rabbits showed no enhancement at any of the examinations, whereas following the injection of Gadofluorine enhancement in the aortic wall of all WHHL rabbits could be detected at the age of 6 month. Enhancement was initially observed only at the origin of the supraaortic vessels. During the follow‐up study the area of enhancement continuously increased in the Gadofluorine group (). The contrast‐to‐noise ratio between plaques and the vessel lumen as well as between plaques and surrounding fat tissue continuously increased from 28,8 respectively 24,7.at the age of 6 months to 73,9 respectively 67,4 at the age of 18 months.
Figure 1. HASTE (upper row) and IR‐turboFLASH images (lower row) at identical slice position in a WHHL rabbit. At the age of 6 months only a small area of enhancement can be detected. The area of enhancement grows continuously over time and at the age of 18 months the aortic wall shows a circumferential enhancement.
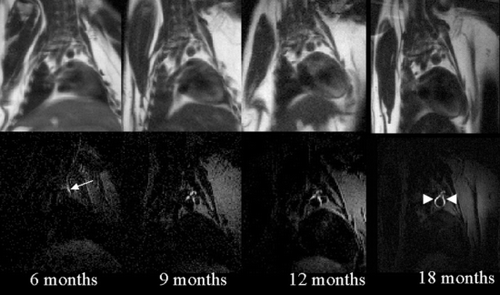
Conclusions: Gadofluorine enhances atherosclerotic plaques in WHHL rabbits and improves plaque detection compared to plain magnetic resonance imaging. In this animal model our approach allows for detection of atherosclerosis in a very early stage. Enhancement initially occurs in areas such as branches, bifurcations and curvatures with alterations of the blood flow, including increased turbulences and decreased shear stress. The follow‐up studies clearly demonstrated that the progression of the plaques can be visualized in vivo. Furthermore this approach may be helpful to evaluate the effect of drugs on the regression of plaques burden.
161. Quantitative Molecular Imaging of Fibrin with 19F MRI
Anne M. Morawski,1 Patrick M. Winter, PhD,1 Xin Yu, PhD,1 Ralph W. Fuhrhop,1 Michael J. Scott,1 Patrick J. Gafney,2 Gregory M. Lanza, MD, PhD,1 Samuel A. Wickline, MD.1 1Washington University School of Medicine, St. Louis, MO, USA, 2St. Thomas' Hospital, London, United Kingdom.
Introduction: Atherosclerosis is characterized by the presence of multiple plaques in various stages of rupture and healing throughout the arterial system, and identifying the few unstable lesions that may eventually result in complete obstruction has proven difficult. Throughout the cycle of rupture and healing that eventually results in complete obstruction, microdeposits of fibrin accumulate, revealing a characteristic feature of the unstable lesion. To sensitively diagnose unstable plaques in vivo, we have developed a noninvasive molecular imaging approach that utilizes a highly potent and specific ligand‐targeted magnetic resonance (MR) contrast agent that also has applications for targeted drug delivery. This agent is composed of lipid‐encased, liquid perfluorocarbon (PFC) nanoparticles that can be formulated with a multiplicity of payloads (i.e., drugs and/or imaging agents like gadolinium chelates) in their outer lipid layers. Additionally, the high fluorine content of the inner core may serve as a unique tracer for particle accumulation since living organisms contain too little indigenous fluorine to be detected by conventional imaging methods.
Purpose: The specific goal of this work was to utilize 19F spectroscopy and imaging to quantify molecular binding of fibrin‐targeted nanoparticles to human plasma clots.
Methods: Emulsions were composed of 20% (v/v) of perfluoro‐15‐crown‐5 or safflower oil, 2% (w/v) of a surfactant co‐mixture containing biotinylated dipalmitoyl‐phosphatidylethanolamine, and 1.7% (w/v) glycerin. The crown ether emulsion was formulated with ∼ 90,000 Gd‐DTPA‐BOA molecules in the outer lipid layer of each nanoparticle, while the safflower oil emulsion was left non‐paramagnetic. The oil and crown ether emulsions were combined in various ratios before application to individual clots in order to compete for binding and predictably reduce the fluorine and proton signal enhancement. Cylindrical clots created from fresh‐frozen human plasma were serially incubated with 125 µg biotinylated anti‐fibrin monoclonal antibodies, followed by 125 µg avidin, and then 100 µl of the selected biotinylated emulsion, and then rinsed. For each clot, fluorine spectra were acquired with a 4.7 T Varian INOVA magnet (90° flip angle; 5 sec pre‐delay; 7.3 µs TE; ∼ 12 min. scan time), and proton relaxation rates were measured at 1.5 T using a Philips NT Intera CV and a mixed spin echo and inversion recovery sequence. Fluorine and proton images of a clot treated with the non‐diluted crown ether emulsion were also acquired at 4.7 T with identical imaging parameters (multi‐slice spin echo sequence, 256 × 256 matrix; 1.0 s. TR; 7.3 µs TE; 2 mm slice thickness; ∼ 5 min. acquisition time).
Results: The spectroscopic 19F signal from the crown ether nanoparticles bound to the clots was directly related to the amount of crown ether in the applied emulsion, as was the change in proton relaxation rate compared to untreated clots measured at 1.5 T. In addition, these two independent measures for quantifying the amount of binding of these nanoparticles were highly correlated with one another (). The high concentration of fluorine caused by accumulation of the nanoparticles on the clot surface allowed acquisition of 19F images with a signal to noise ratio of 20.8 in under five minutes (, left). The co‐registered 1H image, also acquired at 4.7 T, confirms the deposition of a large number of paramagnetic nanoparticles (, right).
Figure 1. Correlation between the change in proton relaxation on rate (ΔR1) of the targeted clots at 1.5 T and normalized 19F signal at 4.7 T.
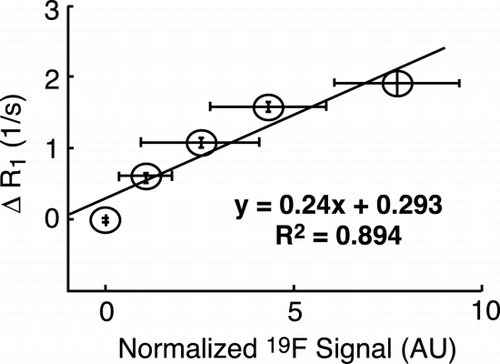
Figure 2. (top) Experimental imaging setup. (bottom, left) 19F image of an in vitro clot treated with paramagnetic, pefluoro‐15‐crown‐5 nanoparticles. (bottom, right) 1H image of the same slice. (View this art in color at www.dekker.com.)
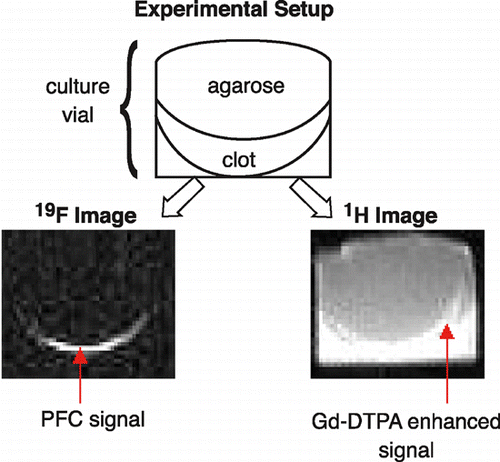
Conclusions: This work demonstrates for the first time the feasibility of using 19F spectroscopy to quantify the binding of targeted, perfluorocarbon nanoparticles to fibrin on the surface of human clots. The ability to precisely calculate the number of nanoparticles at the site of interest with MRI has many applications that were previously only attainable with nuclear imaging techniques, including epitope quantification and local drug osimetry for the treatment of atherosclerosis.
162. Antiangiogenic Therapy of Early Atherosclerosclerosis with Paramagnetic αvβ3‐Integrin‐Targeted Fumagillin Nanoparticles
Patrick M. Winter, Ph.D.,1 Anne M. Morawski,1 Shelton D. Caruthers, Ph.D.,2 Thomas D. Harris, Ph.D.,3 Ralph W. Fuhrhop,1 Huiying Zhang,1 John S. Allen,1 Elizabeth K. Lacy,1 Todd A. Williams,1 Samuel A. Wickline, M.D.,1 Gregory M. Lanza, M.D., Ph.D.1 1Cardiology, Washington University, St. Louis, MO, USA, 2Philips Medical Systems, Best, Netherlands, 3Bristol‐Myers Squibb Medical Imaging, Billerica, MA, USA.
Introduction: αvβ3‐Integrin‐targeted paramagnetic nanoparticles (NP) uniquely facilitate molecular imaging of aortic vaso vasorum expansion in early atherosclerosis with MRI at clinically relevant field strengths (1.5 T). Moreover, these paramagnetic nanoparticles can simultaneously serve as a targeted therapeutic platform using a novel drug delivery mechanism we have termed “contact‐facilitated drug delivery”.
Purpose: In the present study, αvβ3‐targeted nanoparticles were employed to detect and deliver fumagillin, a potent antiangiogenic compound, to arrest neovascular proliferation in hyperlipidemic rabbits as well as to assess the extent of therapeutic success with MRI.
Methods: Protocol—Male New Zealand White rabbits (n = 8) were fed a 1% cholesterol diet for 80 days prior to baseline scanning. At baseline, half of the animals received αvβ3‐targeted paramagnetic nanoparticles incorporating fumagillin (Targeted) and the other half were administered the same formulation without the anti‐αvβ3‐integrin ligand (Non‐Targeted). Transverse black‐blood MRI (TR/TE = 380/11 ms) of the abdominal aorta from the diaphragm to the renal arteries was performed with a clinical 1.5 T magnet (NT Intera with Master Gradients, Philips Medical Systems, Best, Netherlands) using a quadrature birdcage neck coil (250 by 250 µm in‐plane resolution and 5 mm slice thickness). Images were collected before and four hours post peripheral injection (ear vein) of 0.5 ml/kg body weight nanoparticles. After baseline scanning and treatment, all rabbits were switched to standard chow and imaged one week later with αvβ3‐targeted paramagnetic nanoparticles (no drug) to reassess angiogenesis in the vaso vasorum. After imaging, animals were sacrificed and αvβ3‐integrin expression on neovasculature within the aortic wall was corroborated by immunohistochemistry (LM609). The percent enhancement in MRI signal (averaged over all transverse slices) was calculated at baseline and one week post treatment using a semi‐automated image segmentation program. Nanoparticle preparation—Paramagnetic perfluorocarbon nanoparticles incorporated a gadolinium lipophilic chelate (30 mole%) and fumagillin (0.2 mol%) into the outer lipid membrane. A vitronectin antagonist (anti‐αvβ3‐integrin) was covalently coupled to a phospholipid and included in the outer surfactant (0.2 mole%) of the targeted nanoparticles. Non‐targeted nanoparticles were produced identically, excluding the αvβ3‐integrin ligand.
Results: T1‐weighted black‐blood images collected before nanoparticle injection showed no gross evidence of plaque development in the aortic walls, i.e. no lumenal stenosis or wall thickening. At baseline, contrast in the vessel wall heterogeneously increased throughout the abdominal aorta with either αvβ3‐targeted or non‐targeted nanoparticles, with the greatest signal enhancement seen near the diaphragm. MRI T1‐weighted signal enhancement was significantly higher with αvβ3‐targeted (16.8 ± 1.6%) vs. non‐targeted nanoparticles (10.9 ± 1.5%) (, † p < 0.05). One week after fumagillin treatment, MRI enhancement was significantly lower in rabbits receiving αvβ3‐targeted (2.6 ± 1.3%) compared to non‐targeted nanoparticles (13.9 ± 4.1%) (, *p < 0.05). Histology revealed less atherosclerotic plaque and lower endothelial αvβ3 expression in the aortic adventitia of rabbits treated with αvβ3‐targeted compared with non‐targeted nanoparticles.
Figure 1.
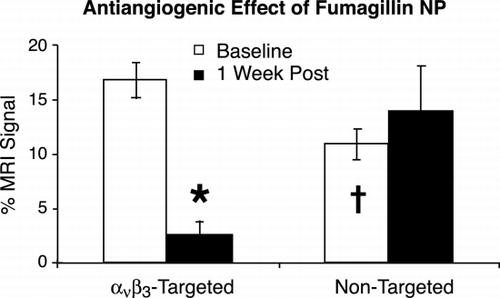
Conclusions: As previously demonstrated, αvβ3‐targeted nanoparticles sensitively detected angiogenesis within the vaso vasorum of atherosclerosic rabbits. At baseline, low level signal enhancement was noted among rabbits given non‐targeted nanoparticles, reflecting entrapment within the hyper‐permeable neovasculature. Simultaneous targeted delivery of fumagillin, confirmed by MRI, significantly decreased the extent of neovasculture as assessed by αvβ3‐integrin molecular imaging and immunohistology one week post treatment. In contradistinction, non‐targeted, passive entrapment of fumagillin nanoparticles did not significantly impact angiogenesis as determined by MRI or microscopy. Antiangiogenic efficacy of fumagillin nanoparticles was dependent upon site‐specific αvβ3‐targeted binding. These results suggest that MR molecular imaging with targeted perfluorocarbon nanoparticles provides a unique tool to detect early disease, to locally deliver effective treatment, and to assess therapeutic response.
163. Functional Vascular Imaging by Selective Excitation and Global Coherent Free Precession (GCFP)
Igor Klem, MD, Wolfgang Rehwald, PhD, John F. Heitner, MD, Anja Wagner, MD, Timothy Albert, MD, Michele A. Parker, Raymond J. Kim, MD, Robert M. Judd, PhD. Duke Cardiovascular Magnetic Resonance Center, Durham, NC, USA.
Introduction: We have developed a new MRI technique (GCFP) which produces cine projection angiograms directly analogous to those of x‐ray angiography non‐invasively and without a contrast agent. () We hypothesized that one application of GCFP would be to examine blood flow throughout an entire vascular tree based on a single acquisition.
Purpose: To test the hypothesis that GCFP filling distance is directly related to true blood flow.
Methods: Six adult mongrel dogs (18–35 kg) were anasthetized, intubated, and mechanically ventilated. We compared GCFP filling distance to true blood flow by selectively exciting the abdominal aorta and visualizing temporal blood flow into the left and right iliac arteries. True blood flow was measured in the study vessel (left iliac) using both an MRI compatible ultrasonic flow‐probe (Transonic Systems, Ithaca) and velocity encoded MRI (venc) expressed as flow volume per minute and flow volume per cardiac cycle respectively. A hydraulic occluder was used to control blood flow in the study vessel. Images were acquired on a 1.5‐Tesla whole‐body MR tomograph (Magnetom Sonata, Siemens, Erlangen) during occlusion, reactive hyperemia, and partial occlusion. Each movie (e.g. ) was acquired in a 15 sec breath hold. Typical imaging parameters of GCFP were: pixel size 0.85 × 0.78 mm, TR 5.76 ms, TE 2.88 ms, Flip angle 45 degrees, slice thickness 3 mm, bandwith 930 Hz/Pixel. GCFP filling distances were measured in cm directly from the images.
Figure 1.
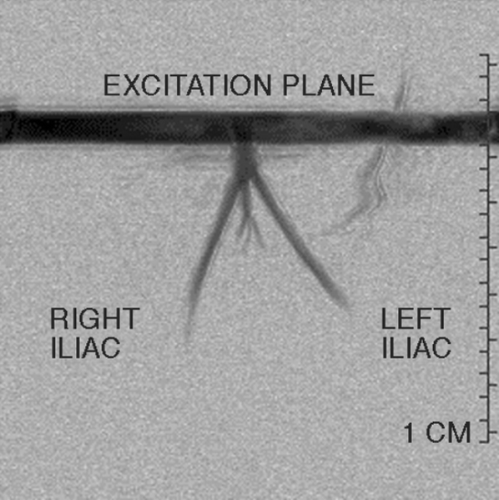
Results: shows GCFP filling distances in the study vessel of all 6 animals. During occlusion, GCFP filling distance in the study vessel (left iliac) fell to 8.2 ± 3.0% of baseline while true blood flow decreased to 6.7 ± 6.9% and 9.6 ± 10.0% based the flow probe and venc, respectively (p = NS for differences). GCFP filling distance in the presence of a partial occlusion fell to 43.5 ± 19.7% of baseline while true flow fell to 43.7 ± 5.1% (flow probe) and 46.3 ± 14.0% (venc). In the control vessel (right iliac), conversely, GCFP filling distances were unaffected (p = NS). Overall, correlation coefficients for GCFP compared to the ultrasonic flow probe and velocity encoded MRI were 0.799 (p < 0.0001) and 0.812 (p < 0.0001) respectively.
Figure 2.
Conclusion: GCFP filling distances relate directly to true blood flow. Unlike any existing non‐invasive technique, GCFP provides functional information in all blood vessels of a given vascular tree simultaneously.