374. Clinical Peripheral Magnetic Resonance Angiography: Comparison of Hybrid Technique Versus Sequential Stepping‐Table Approach
Frederick S. Pereles,1 Jeremy D. Collins, MD,1 James C. Carr, MD,1 Mark D. Morasch, MD,2 Chris J. Francois, MD,1 John Paul Finn, MD.3 1Radiology, Feinberg School of Medicine, Northwestern University, Chicago, IL, USA, 2Vascular Surgery, Feinberg School of Medicine, Northwestern University, Chicago, IL, USA, 3Radiology, UCLA School of Medicine, Los Angeles, CA, USA.
Introduction: Lower extremity contrast enhanced peripheral MR Angiography (pMRA) is used routinely to triage patients with peripheral vascular disease to percutaneous intervention or surgery.A sequential stepping‐table 3‐station technique (bolus‐chase) is routinely used for pMRA, risking either poor enhancement of run‐off vessels or venous contamination.
Purpose: The purpose of our study was to evaluate the efficacy of a “hybrid” dual timing/dual injection pMRA technique with separate preceding calf acquisition and compare it to a conventional bolus‐chase pMRA technique.
Methods: 155 consecutive patients underwent pMRA on a Magnetom Quantum scanner (Siemens Medical Systems, Malvern, PA) using a 3D gradient echo pulse sequence (TR/TE: 3.5/1.2; α: 25°) and dedicated peripheral vascular coil. Angiographic correlation was available in 61 patients. The first 34 patients underwent bolus chase pMRA with a single 2 ml Gad‐DTPA timing run followed by an automated sequential, 3‐station bolus chase, stepping‐table technique. Bolus‐chase infusion was a graduated single infusion of Gad‐DPTA: the first 20 ml at 2 ml/s followed by the remaining 28–40 ml (maximum weight based dose 0.3 mmol/kg) at 0.8 ml/s. The next 121 patients underwent hybrid pMRA with 2 separate axial timing runs centered in the calves and pelvis. Calf single‐station MRA was performed first with the infusion of 20 ml Gad‐DPTA at 2 ml/s. Subsequently, pelvis‐thigh stepping‐table MRA was carried out with a second injection of Gad‐DPTA: 20 ml at 2 ml/s followed by 10–16 ml (maximum weight based total 0.3 mmol/kg) at 0.8 ml/s.
Two independent observers reviewed partition, MIP and volume‐rendered data. Arterial vessels were divided into 29 anatomic segments per patient and the most severe stenosis per segment was graded by 10% increments. Qualitative measures of venous contamination and diagnostic confidence per station were also obtained. Digital subtraction angiograms were assessed separately in a similar fashion for lesion severity by anatomic segment.
Results: Sensitivity and specificity for the hybrid technique at each MR station were as follows: 97% and 98% respectively for pelvis, 93% and 97% for thigh, and 96% and 99% for calf; versus 85% and 92% for pelvis, 87% and 91% for thigh, and 83 and 90% for calf stations for the bolus‐chase technique. Venous contamination in the calves was significantly more severe for bolus‐chase pMRA. Diagnostic quality of the calf vessels was significantly higher with the hybrid technique. All p values above were significant (p < 0.05).
Conclusions: While increasing exam length slightly, the addition of a second timing run and separate calf acquisition significantly reduces venous contamination. This fact coupled with improved spatial resolution and diagnostic image quality make the hybrid approach superior to conventional bolus‐chase, stepping‐table techniques.
375. Developing a Viable CVMRI Practice: Four‐Year Experience in a Hospital Setting
Brenda Lambert, RN,1 Debra Dees, RN,2 Marti Welch, RT,2 Raja Muthupillai,3 Scott D. Flamm, MD.4 1Department of Radiology, St. Lukes Episcopal Hospital, Houston, TX, Houston, TX, USA, 2Department of Radiology, St. Luke's Episcopal Hospital, Houston, TX, Houston, TX, USA, 3Clinical Science, and Radiology, Philips Medical Systems and Baylor College of Medicine, Houston, TX, USA, 4Departments of Cardiology and Radiology, St. Luke's Episcopal Hospital, Houston, TX, Houston, TX, USA.
Introduction: MRI can be used to accurately assess left ventricular (LV) function, quantitate blood flow, assess myocardial viability and ischemia, offers excellent tissue characterization abilities for a broad spectrum of cardiomyopathies (e.g., fatty infiltration in ARVD), can define pericardial thickening, coronary anomalies, and cardiac masses, etc. In addition, MRI is non‐invasive, offers ominplanar tomographic imaging, imposes no radiation burden, and uses non‐nephrotoxic contrast agents. Despite these obvious benefits, developing a viable cardiovascular MRI practice even in a large hospital, can be a slow and challenging process.
Purpose: The purpose of this retrospective study is to identify the key elements of a successful CVMRI practice in a hospital setting (600 bed) over a four‐year period by tracking patient growth, CVMRI services offered, and physician referral patterns.
Methods: MRI Resources—The hospital is equipped with two 1.5T commercial MR imagers (Gyroscan NT/Intera, Philips Medical Systems) that have been routinely upgraded to maintain state‐of‐the‐art capabilities. There are two post‐processing workstations (EasyVision, Philips Medical Systems) for cardiovascular MRI analysis. Human Resources—The CVMRI center staff consists of one FTE clinical nurse, two CVMRI technologists (covering a 10 hour shift per day), a part time secretary, and a full‐time clinical cardiac MR radiologist. Data Analysis—Over a period of four years (1999–2002) we retrospectively analyzed: 1) number of CVMRI patients; 2) CVMRI examination types; and 3) physician referral patterns. We determined the significant catalysts for CVMRI business growth.
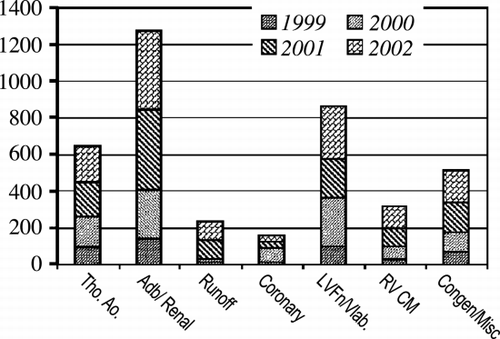
Results: The number of clinical CVMRI patients imaged during the four‐year period grew from 478 patients in 1999 to 1,350 clinical patients in 2002. The year‐to‐year growth with 1999 as the base year is given in Figure . On the average each patient had 1.6 studies/exams, e.g., 2160 exams in 2002. Each year the vascular studies constituted 50% of the total examinations (thoraco‐abdominal aorta, renal, and peripherals), with cardiac studies (LV function/viability, ischemia, RV cardiomyopathy, tumors, and others) constituting the remainder (Figure ). The renal/mesenteric artery, and myocardial viability studies constituted over 40% of the total CVMRI studies in 2002 (∼ 20% each). This coincided with the increasing availability of high‐resolution contrast‐enhanced MRA methods (e.g., parallel imaging) on the vascular front, and methodological improvements in viability imaging (e.g., 3D techniques). From 1999–2003, the initial core referral base of nephrologists and general cardiologists grew to include electrophysiologists (RV dysplasia/pulmonary veins, anamolous coronary arteries), cardiothoracic transplant surgeons (myocardial viability), and vascular surgeons (thoracoabdominal aorta, peripheral vascular imaging). Current trends for 2003 reveal the number of patients studied will exceed the growth projections (> 2000 patients or 3600 exams). The average reimbursement rate was similar to routine neurologic imaging.
Figure 1.
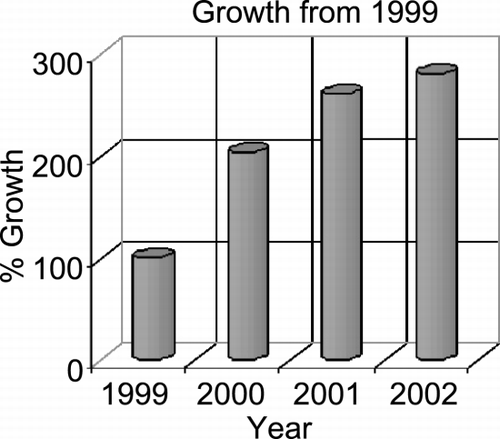
Figure 2.
Conclusions: While the data presented here is specific to the hospital and may not be generalizable, the trends for a successful CVMRI program may be identified. These include:
(a) Vascular pathology evaluation can form a significant portion of the CVMRI business (50% in this study). Therefore, it is necessary to offer a critical assessment of vascular pathologies by combining both anatomic as well as hemodynamic information (e.g., flow).
(b) As a rapidly evolving imaging modality, MRI requires constant adoption of new methodologies that are necessary to attract new/additional referrals. Such adoption requires sustained investment in MRI infra‐structure to maintain a state‐of‐the art facility.
(c) Active education of referring physicians to MR capabilities via intra‐institutional and inter‐institutional conferences (e.g., echo/nuclear conferences) is critical for increasing the visibility of the CVMRI practice within the referral base.
(d) Likely more than other imaging modalities, MR requires constant education for the CVMRI service provider to keep up with most current techniques, and issues associated with the availability of “MR sequences”.
376. Aortic Gadolinium Enhancement is Associated with Myocardial Infarction, Aging and Decreased Aortic Compliance
W. Patricia Ingkanisorn, MD, Glenn Aaron Hirsch, MD, Christopher Kent Dyke, MD, Anthony Homer Aletras, PhD, Peter Kellman, PhD, Andrew Ernest Arai, MD. NHLBI, Laboratory of Cardiac Energetics, National Institutes of Health, Bethesda, MD, USA.
Introduction: It is known that atheroma enhance with gadolinium. We commonly observe aortic enhancement in patients with known coronary artery disease. This finding may represent either fibrosis or atheroma (Figure ). However, we also see abnormalities in patients without myocardial infarction (Figure ).
Figure 1.
Figure 2.
Purpose: We hypothesized that gadolinium‐delayed enhancement of the aorta was a manifestation of underlying vascular disease and would correlate with decreased aortic distensibility.
Methods: Study population—Forty‐six patients were imaged. Seventeen had a history of myocardial infarction. Imaging—Functional imaging was performed with steady state free precession. Delayed enhancement imaging was performed using a 2RR triggered inversion recovery fast gradient echo sequence 20 minutes post‐administration of 0.2 mmol/kg gadolinium‐DTPA on a GE CV/I 1.5T scanner with a 4‐element cardiac phased‐array coil. Analysis—All analysis of the delayed enhancement images was performed after phase sensitive reconstruction. Aortic delayed enhancement was defined by increased signal intensity of the aortic wall relative to the aortic blood. Typically this resulted in a bright rim on aortic cross‐sectional images. Aortic distensibility was determined using cine images (aortic distensibility = aortic areamax–aortic areamin/aortic areamin x pulse pressure).
Results: Thirty‐three of the 46 patients demonstrated enhancement of the aorta. The mean age of the enhancing group was 61 ± 14 years. The mean age of the 11 patients who did not demonstrate any aortic enhancement was 33 ± 9 years (p < 0.00001). All 17 patients with known myocardial infarctions had aortic enhancement. There was a statistically significant difference between the aortic distensibility of the 2 groups with the non‐enhancing group averaging an aortic distensibility index of 0.0038 ± 0.0019 mmHg− 1 and the aortic enhancing group averaging an aortic distensibility index of 0.0018 ± 0.0011 mmHg− 1 (p < 0.0001).
Conclusions: Gadolinium enhancement of the aorta is a finding associated with older age and lower aortic distensibility. The fact that all of the patients with myocardial infarction demonstrated aortic enhancement may be related to the older age population; however, we should also consider the possibility that gadolinium enhancement of the aorta is an early marker for atherosclerotic disease.
377. MR Angiographic Features of Turner Syndrome
Vincent B. Ho, M.D.,1 Vladimir K. Bakalov, M.D.,2 Margaret Cooley, B.A.,2 Carolyn A. Bondy, M.D.2 1Department of Radiology, Uniformed Services University of the Health Sciences, Bethesda, MD, USA, 2Developmental Endocrinology Branch, National Institute of Child Health and Human Development, Bethesda, MD, USA.
Introduction: Turner syndrome (TS), or monosomy X, is associated with aortic coarctation and dissection, and screening of all patients using echocardiography is recommended. X‐ray angiography in affected patients has suggested a wide range of other arterial and venous anomalies, but the true prevalence of such lesions in TS is unknown.
Purpose: To evaluate the spectrum and prevalence of thoracic arterial and venous anomalies in adult TS patients using contrast‐enhanced 3D MR angiography.
Methods: A total of 81 adult TS patients (average age = 37 ± 11 years) and 27 healthy adult female volunteers (average age = 36 ± 10 years) were enrolled in this IRB‐approved study. All subjects were imaged on a 1.5 Tesla MR scanner equipped with high performance gradients and using a torso phased array coil. Imaging included fast gradient echo and T1‐weighted fast spin echo pulse sequences. Breath held contrast‐enhanced 3D MR angiography was performed using a fast 3D spoiled gradient echo pulse sequence and a 0.2 mmol/kg dose of Gd‐chelate contrast media. Post‐contrast fat suppressed spoiled gradient echo images were also obtained. Image interpretation was performed blinded to subject history and physical exam findings.
Results: In TS patients, a variety of arterial anomalies were identified: redundancy of the aortic arch (29/81), coarctation/pseudo‐coarctation of the aorta (10/81), aberrant right subclavian artery (7/81), bovine arch (7/81) and anomalous origin of the left vertebral artery (3/81). No patients had aortic dissection. Venous anomalies in TS subjects included persistent left superior vena cava (10/81) and partial anomalous venous return (10/81). In the healthy volunteers, MR angiography demonstrated bovine arch (6/27) and anomalous origin of the left vertebral artery (3/27) but no other arterial or venous anomalies.
Conclusions: Thoracic arterial and venous anomalies are common in patients with Turner Syndrome. Recognition of these “occult” aortic diseases may be important for proper identification of patients in need of closer cardiovascular monitoring. Contrast‐enhanced 3D MR angiography should be considered in the MR evaluation of TS patients.
378. Accuracy of Quantitative MR Vessel Wall Imaging Applying a Semi‐Automated Gradient Detection Algorithm—A Validation Study
Qian Wang, Matthew D. Robson, Jane M. Francis, Steffen E. Petersen, Stefan Neubauer, Frank Wiesmann. University of Oxford, Department of Cardiovascular Medicine, Oxford, United Kingdom.
Introduction: Magnetic resonance imaging is uniquely suited to study the pathophysiology of arteriosclerosis. So far, MR measurements of vessel dimensions have mainly been done by manual tracing of vessel wall contours. However, data post‐processing is very time‐consuming and has limited accuracy due to difficulties in accurate tracing of the thin vessel wall. Furthermore, to study the dynamics of arteriosclerosis development and to non‐invasively look into the effects of new therapeutic strategies, more reproducible ways of data analysis for quantification are needed.
Purpose: To assess the accuracy and reproducibility of quantitative vascular imaging applying a method based on unwrapping the vessel wall followed by a gradient detection algorithm for data post‐processing.
Methods: All studies were performed on a Siemens Sonata 1.5T clinical MR scanner (Erlangen, Germany). For validation, phantom experiments with tubes of varying size and wall thickness corresponding to human aortic and carotid vessels were performed. Furthermore, MR vascular imaging studies were done in 17 healthy volunteers. A repeat study within 10 days of the first MRI was performed in 9 of these subjects for assessment of inter‐study reproducibility (S1 vs. S2). Intra‐observer and inter‐observer variability were systematically evaluated by repeated MR data analysis of one observer (A1 vs. A2) and by two independent observers (A vs. B), respectively.A dark‐blood double‐inversion turbo spin echo sequence with fat suppression was applied, with proton‐density‐weighted and breath‐hold acquisition for aortic imaging and T2‐weighted acquisition for carotid imaging.
The semi‐automated analysis method was implemented under Matlab (Mathworks, Natick, MA). The implementation performs two computerized steps: 1) “Unwrapping” of the vessel wall using the manually defined center of the vessel. This is performed by mapping the pixel intensities into the polar coordinates of the vessel and using interpolation. 2) Gradient determination using a edge detection filter in the radial direction, which smooths in the angular direction while differentiating in the radial direction. This filtering is optimum with respect to the Canny criteria and is performed in the polar coordinate space.
Results: The semi‐automated edge detection software revealed a clear view of the inner and outer vessel wall boundaries both in the phantoms and in the volunteers studied. Quantitative assessment of a single vessel required around 30 to 40 seconds. There was close agreement between MR‐derived measurements and phantom dimensions (mean difference of 1.1 ± 16.9mm2 for vessel wall cross‐sectional area). Correlation of MR‐derived measurements and true dimensions in all phantoms was high (r = 0.99, true wall area = 1.07*MR derived wall area‐6.0 (mm2)).
Quantification of vessel dimensions was feasible in all 17 healthy volunteers studied. Inner and outer vessel boundaries were correctly assigned by the edge‐detection algorithm, allowing precise edge delineation and vessel wall segmentation (Figure ). Semi‐automated quantification of total cross‐sectional vessel wall area (mean ± SD, 253.6 ± 208.4 mm2) revealed close correlation for repeated data analysis by one observer (A1 vs. A2) and for data analysis by two independent observers (A vs. B) (r = 0.99 each). Furthermore, there was close agreement of MR measurements of observer A (mean difference 7.5 ± 16.7 mm2), and for comparison of observer A and B (mean difference 14.4 ± 24.6 mm2).
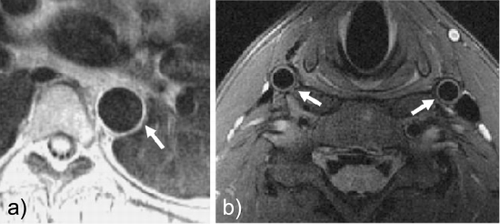
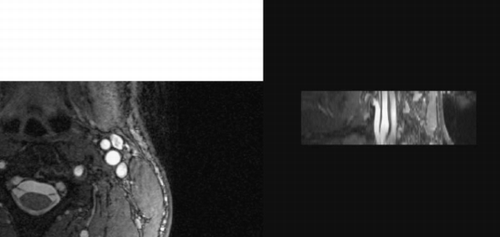
Figure 1. Dark‐blood turbo spin echo MR image of a) thoracic descending aorta and b) both common carotid arteries (images cropped for display purposes).
In the repeat study of 9 volunteers, a high correlation and agreement of vessel dimensions was shown between the two scans (S1 vs. S2)(r = 0.994, S1 = 1.04*S2‐6.5, mean difference 2.6 ± 25.1mm2). Hence, the edge detection method allowed for a low overall intra‐observer and inter‐observer variability and a high inter‐study reproducibility (Table ).
Table 1. Variability of Repeated MR Measurements of Vessel Wall Area in 17 Healthy Volunteers
Conclusion: Semi‐automated analysis methods can provide approaches that benefit from the human understanding of the image and the computer's ability to measure precisely and quickly. Thus, by combining the latest MRI methods and semi‐automated image analysis methods we are now able to reproducibly determine the geometric parameters of blood vessels (Figure ).
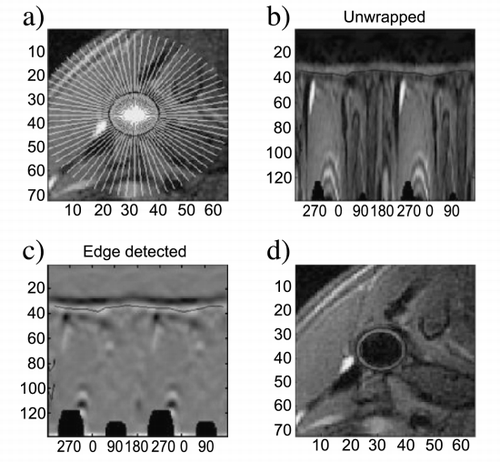
Figure 2. Results of the edge‐detection analysis showing a) reference lines for carotid vessel wall profile, b) “unwrapped” image data, c) results of gradient‐detection for inner (black) and outer (white) wall boundaries, and d) visual display of segmentation result (black lines).
379. Detection of Pulmonary Artery Wall Changes in Patients With Takayasu's Arteritis by Magnetic Resonance Imaging
Marcia Lima de Oliveira Mugnaini, MD, Luciana de Pádua Silva Baptista, MD, Luis Claudio Lemos Correia, MD, Marcello Zapparoli, MD, Fabio Berezowski Rocha, MD, Marly Maria Uellendahl, MD, Rosa Maria Rodrigues Pereira, MD, Cláudio Campi de Castro, MD, PhD, José Rodrigues Parga, MD, PhD, Luiz Francisco Rodrigues de Ávila, MD, PhD, Carlos Eduardo Rochitte, MD, PhD. Cardiovascular Magnetic Resonance Laboratory, Heart Institute‐ InCor ‐ University of São Paulo Medical School, São Paulo, Brazil.
Introduction: Aorta wall changes are well described in individuals with Takayasu´s Arteritis (TA), but the same is not true for the pulmonary artery (PA). Magnetic resonance (MRI) is capable of imaging vessel wall with excellent spacial resolution, but its ability to identify parietal changes is the PA of patients with TA has not been established.
Purpose: 1) To evaluate the ability of MRI to identify vessel wall changes in the pulmonary artery of individuals with TA; 2) To test the hypothesis that wall changes are more frequent than luminal changes; and 3) To quantify parietal thickness and luminal diameter in TA patients.
Methods: We studied 26 TA patients (23 women, mean age of 36 years), and 10 control subjects with no criteria for TA or any other pulmonary disease (4 women, mean age of 64 years). All patients underwent a MRI study performed in a 1.5T system (Signa Lx CV/i, General Eletric Medical Systems, Milwawkee, WI) with a phased array coil. To quantify wall thickness, we acquired thoracic axial slices covering the entire thoracic aorta using a Fast Spin Echo sequence with double inversion recovery preparation pulse to obtain black blood images. The following parameters were used: TE: 42 msec, TR: 2 RR, matrix: 256 × 224, FOV: 34–40, NEX: 1, slice thickness: 6.0, gap: 1.0, ETL: 32, BW: 62.5. For luminal diameter quantification, a breath‐hold contrast‐enhanced 3D MR angiography (MRA) was performed using a 3D Spoiled GRASS sequence with the following parameters: TR/TE: 5.0/1.1msec, Flip angle: 45°, matrix: 256 × 160, FOV: 38, NEX: 1, slice thickness: 3.0mm. The acquisition slab was prescribed in the coronal scout in order to cover the thoracic aorta, its major branches, and the pulmonary artery. A bolus of 0.2 mmol/Kg of gadodiamide (Ominiscan; Nycomed Ireland Ltda,Cork) was administred intravenously by manual injection at a rate of approximately 2 ml/sec, and followed by a 20 ml saline flush. Luminal diameter of PA trunk was measured at one centimeter prior to bifurcation and of PA branches at the largest diameter. Wall thickness of PA trunk and branches were measured at the maximum thickness by visual analysis. Measurements were done by 2 independent observers in a offline workstation, using a comercial software tool.
Parietal thickness and luminal diameter were compared between control and TA groups by unpaired Student’s t test. Based on the means of the control group ± 1 standard deviation, we defined wall thickening as values > 2.1 mm and normal values for luminal diameters as 20–30 mm and 15–25 mm for PA trunk and branches, respectively. The prevalence of parietal or luminal changes as above defined were compared between control and TA groups by Fisher's exact test.
Results: TA patients presented a significantly greater PA trunk and branches wall thickness than control subjects (Table ). In contrast, luminal diameter did not differ significantly (Table ). The TA group showed wall thickening more frequently than the control group (73% vs. 20%, p < 0.01). However, the proportion of patients with abnormal luminal diameter was similar between TA and control groups (27% vs. 20%, p = NS).
Conclusions: 1) MRI is an useful tool to identify parietal changes in the pulmonary artery of patients with Takayasu's Arteritis; 2) Pulmonary artery parietal changes are more frequent than luminal changes, suggesting that parietal changes are a better criteria for the diagnosis of pulmonary artery involvement in Takayasu's Arteritis.
380. Renal Artery Stenosis in Chronic Heart Failure as Determined by Magnetic Resonance Imaging
Ramesh de Silva,1 Klaus Witte,1 Justin Ghosh,1 Nikolay P. Nikitin,1 Sunil Bhandari,2 Anthony Nicholson,3 Andrew L. Clark,1 John GF Cleland.1 1Academic Cardiology, University of Hull, Hull, United Kingdom, 2Department of Nephrology, Hull, United Kingdom, 3Department of Radiology, Leeds, United Kingdom.
Introduction: Renal dysfunction (RD) is common in patients with chronic heart failure (CHF) and is independently associated with a poor prognosis. The causes of RD in CHF are multi‐factorial. One important cause is renal artery stenosis (RAS), most commonly secondary to atherosclerosis. It is possible that RAS due to atherosclerosis plays a significant role in the pathophysiology and progression of CHF in some patients. It is also possible that optimal pharmacological management of heart failure patients may be complicated in the presence of significant RAS, mainly due to limitations on the use of angiotensin converting enzyme (ACE) inhibitors. However, few studies have been published on the prevalence and associations of renovascular disease in CHF. Information regarding the use of ACE inhibitors in the presence of RAS is also scarce.
Purpose: To assess the prevalence of and factors associated with RAS in patients with CHF, and to assess the frequency and dosage of ACE inhibitor use in such patients, many of whom have renal dysfunction.
Methods: 120 consecutive patients referred to a community heart failure programme with symptoms and signs of CHF were identified. 85 (70%) patients had renal dysfunction defined as a creatinine clearance (CrCl) < 60ml/min calculated by the Cockcroft‐Gault equation [(140‐age) x weight (kg)/(Creat (µmol/L) x 0.81) x 0.85 if female]. For the purpose of analysing the use of ACE inhibitors, doses were expressed as the percentage of the maximum recommended daily dose. Patients were assessed by magnetic resonance angiography (MRA) of the renal arteries using a 1.5 Tesla Signa CVi General Electric scanner and non‐nephrotoxic gadodiamide (Nycomed Amersham, UK). Images were reported by a co‐author (AN) blinded to the clinical details of the patient.
Results: 91 (76%) were male. The average age was 70 (± 12) years. 82 (69%) patients had RAS of some degree. Of these, 65 (54%) had a stenosis of > 50% of which 35 (29%) were bilateral and 36 (30%) had a stenosis of > 70% of which 19 (16%) were bilateral. An important incidental finding was that of 14 (12%) previously undetected abdominal aortic aneurysms requiring further assessment. The findings in patients with and without significant RAS are presented in the (Table ). There was no significant difference in the use or dosage of ACE inhibitors at presentation between the two groups (n = 50 in both groups and 69% vs 68% of max. recommended daily dosage respectively). After a mean follow up of 13 months, patients with significant RAS were taking lower doses of ACE inhibitors (72% vs 81% of max. recommended daily dose, p = NS), had a lower dose change from baseline (+ 4% vs + 11% of max. recommended daily dose, p = NS) and more had discontinued ACE inhibitor treatment (7 vs 1, p = 0.05) compared to patients without significant RAS. 5 of the 7 patients who discontinued ACE inhibitors had RAS > 70%, and one had bilateral RAS > 70%.
Table 1. Differences in the Presence or Absence of RAS >50%
Conclusions: Gadolinium enhanced MRA is both a safe and effective technique for the assessment of patients with renal dysfunction and heart failure. It may also detect other important vascular disease. RAS is common in this patient group and significantly contributes to renal dysfunction in patients with heart failure. A deterioration in renal function in CHF patients is at times ascribed to the use of ACE inhibitors. We found no difference in both the frequency and dosage of ACE inhibitor use at initial presentation in the presence or absence of RAS. However, patients with significant RAS were more likely to discontinue ACE inhibitors and were on lower doses compared to patients without significant RAS. The risks and benefits of renal angioplasty in such cases have yet to be determined.
381. Mediastinic Fat Deposition in Male Subjects with Excess Visceral Fat: A New Cardiovascular Risk Factor?
Anna Maria Sironi, MD,1 Amalia Gastaldelli,1 Vincenzo Positano,1 Brunella Favilli,1 Petra Keilberg,1 Demetrio Ciociaro,1 Eleuterio Ferrannini,2 Massimo Lombardi.1 1MRI Lab, Institute of Clinical Physiology CNR‐CREAS, Pisa, Italy, 2Institute of Clinical Physiology CNR‐CREAS, Pisa, Italy.
Introduction: Regional fat distribution, in particular visceral fat (VF) accumulation, is a risk factor for metabolic and cardiovascular abnormalities.
Purpose: To investigate whether abdominal visceral and/or subcutaneous fat accumulation is associated with thoracic mediastinic and/or pericardial fat independently of presence of obesity.
Methods: We studied 25 male subjects without diabetes of which n = 10 subjects had untreated essential hypertension (HT). Controls (CT) and HT subjects were matched for age and BMI (age = 43 ± 3 vs 49 ± 2 yrs, p = ns; BMI = 27 ± 6 vs. 29 ± 8 kg/m,2 p = ns). In all subjects we measured abdominal (VF and subcutaneous, SC) fat and thoracic (mediastinic and pericardial) fat by MRI. Abdominal fat images were acquired using a 1.5 T, Cvi, GEMS scanner using a T‐1 weighted sequence centered around L4–L5. Areas and volumes were calculated using a semiautomatic program. Cardiac images were acquired using a FIESTA sequence to obtain horizontal long axis and parallel short axis projection of the ventricles. Mediastinic and pericardial fat areas were calculated using a semiautomatic program. Cardiac function and ventricular volumes were assessed by semiautomatic planimetry of endocardial borders of each ventricle at both end diastole and systole.
Results: All 25 male subjects had normal cardiac function (left ventricular ejection fraction 65 ± 2 %; end diastolic volume 68 ± 3 ml/m2; end systolic volume 25 + 2 ml/m2). Independently of the degree of obesity, HT subjects had increased visceral fat volume (57 ± 5 vs. 38 ± 4 cm3/kgfat mass, p < 0.008). as well as mediastinic fat area (134 ± 11 vs. 98 ± 8 mm2/kgfat mass, p < 0.02). On the other hand pericardial fat was similar in the two groups (p = ns). Visceral and mediastinic fat accumulation were highly correlated (r = 0.63, p = 0.0007). In the whole group mediastinic fat was directly related to insulin resistance (HOMA, r = 0.65, p < 0.0005), alanine aminotransferase (ALT, r = 0.58, p < 0.005), gamma‐GT (r = 0.42, p < 0.05), systolic and mean blood pressure (r = 0.46 p < 0.02; r = 0.41 p < 0.05 respectively), even when accounting for age, presence of hypertension and degree of obesity.
Conclusions: Mediastinic fat depots, measured by MRI, has to be considered as the same strength as visceral fat as risk factor in the development of the metabolic syndrome. Pericardial fat accumulation does not seem to play a major role. A single MRI examination for cardiovascular function allows to identify further metabolic risks of cardiovascular events.
382. Carotid Wall Imaging at 1.5T and 3T: Systematic SNR Comparison
Masahiro Terashima, MD, PhD,1 Patricia K. Nguyen, MD,1 Vasily L. Yarnykh, PhD,2 Cecil E. Hayes, PhD,2 Ann Shimakawa,3 Jean H. Brittain, PhD,3 Chun Yuan, PhD,2 Michael V. McConnell, MD, MSEE.1 1Cardiovascular Medicine, Stanford University, Stanford, CA, USA, 2Radiology, University of Washington, Seattle, WA, USA, 3GE Medical Systems, Menlo Park, CA, USA.
Introduction: High‐resolution vessel wall imaging allows characterization of atherosclerotic plaque. However, increasing image resolution requires higher SNR or longer scan times. 3T whole‐body MRI systems with high‐speed gradients may provide the additional SNR to improve spatial resolution or reduce scan time, which can be long for a multi‐contrast carotid imaging protocol (Hayes et al., Citation). Therefore, we have adapted our dedicated phased‐array carotid coil design (Nguyen et al., Citation) and our multislice double inversion‐recovery (DIR) black‐blood imaging sequence to 3T (Yarnykh et al., Citation). Here we present our systematic comparison of SNR for 1.5T vs 3T for carotid imaging using multiple contrast weightings and spatial resolutions.
Purpose: To perform detailed SNR comparisons for multi‐contrast carotid imaging at 3T and 1.5T.
Methods: Six healthy subjects (5M, 1F, age 26–43) participated the study. All subjects were given written informed consent approved by Stanford IRB. All subjects were imaged on a GE 1.5T (Signa Twinspeed) and 3.0T (Signa VH/i) whole body systems (GE, Milwaukee, WI) equipped with high‐performance gradients (40mT/m, 150mT/m/msec). We used a customized four‐element phased‐array surface coil on both scanners (Hayes et al., Citation). The protocol consisted of 3 different contrast weighted black‐blood FSE sequences, including T1, T2, and proton density (PD) [TR/TE/echo train: 800/10/10 for T1‐, 2500/50/12 for T2‐, and 2500/9/12 for PD‐weighted scans, FOV = 14–16cm, slice thickness = 2mm]. For the long TR sequences (PD‐and T2‐weighted), the multislice DIR method was used with 4 slices per TR. T1‐weighted images were obtained using single‐slice DIR. Inversion times were adjusted based on the blood T1 (1.5 T: 1200ms, 3T: 1550 ms). Three different matrix sizes (256 × 256, 384 × 384, 512 × 512) were used to achieve increased spatial resolution, as well as 1 and 2 NEX. SNR was measured from the average of left and right sternocleidomastoid muscles as well as from the carotid artery lumens. Statistical comparison between 1.5T and 3T was performed with a paired Student t‐test.
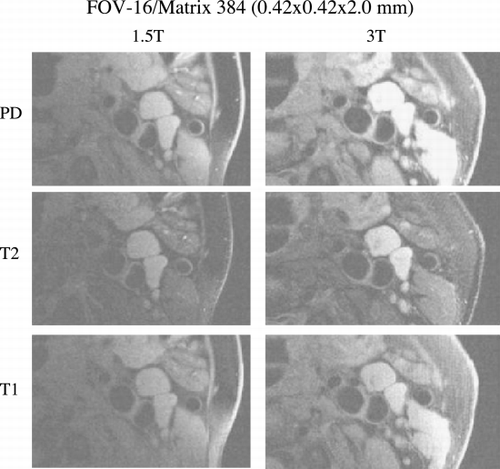
Results: Overall SNR of the carotid imaging sequence increased by 65% at 3T compare with 1.5T (Table ). The average SNR increase was similar for all 3 contrast weightings (PD: 62%, T2: 77%, T1: 54%). Importantly, there was no change in SNR for the vessel lumen (3.3 vs. 3.5, p = ns), demonstrating equally effect blood suppression on both scanners. The (Figure ) shows all 3 contrast weightings in one patient at 1.5T and 3T (with the identical window/level settings for all images), demonstrating the improved SNR at 3T.
Figure 1.
Discussion/Conclusion: We have demonstrated a substantial improvement in SNR at 3T for carotid imaging for 3 different contrast weightings. While not as high as the 2‐fold increase expected for a 2‐fold increase in field strength, it was actually superior to our prior data for coronary MRA, where the overall increase in SNR at 3T was 47% (Yuan et al., Citation). Further optimization and experience with 3T carotid imaging may improve SNR further. In conclusion, multi‐contrast carotid imaging demonstrates substantially greater SNR at 3T. This may translate into improved characterization of carotid plaque, which will need to be demonstrated in patient studies.
383. Steady‐State Cine MRI and Myocardial Delayed Enhancement: Image Quality Comparison Between 1.0T and 1.5T Magnets
Luis A. A. Mendonça, Eng.,M.Sc.,1 Marcelo Souza Hadlich, MD,1 João Luiz Petriz, MD,1 Clerio Azevedo, MD,1 Jorge Moll, MD,1 Carlos Eduardo Rochitte, MD, Ph.D.2 1Cardiac MRI, Rede Labs & D'Or Hospitals, Rio de Janeiro, Brazil, 2Cardiac MRI, Rede Labs & D'Or Hospitals and Heart Institute ‐ InCor ‐ University of São Paulo Medical School, Rio de Janeiro, Brazil.
Introduction: Steady‐state cine MRI (b‐FFE) and myocardial delayed enhancement (MDE) are two important pulse sequences in current cardiovascular magnetic resonance arsenal used to evaluate precisely LV function 1) and viability 2), which have been performed traditionally in 1.5T systems. Recently, these pulse sequences have been made available in 1.0T systems. A direct comparison of image quality in the clinical setting between 1.5T and 1.0T systems would objectively investigate its efficacy in the diagnosis.
Purpose: Investigate the diagnostic quality of 1.0T MRI scanner on the assessment of myocardial function and viability using an 1.5T scanner as standard.
Methods: We acquired 10 cardiac MR examinations in a 1.5T ACS‐NT Powertrack 6000 Philips System and 10 studies in a 1.0T Intera Master Philips System, using both b‐FFE for cine MRI and IR prepped TFE for MDE for all exams. The optimized parameters used in b‐FFE for 1.0T and 1.5T are summarized on , and the optimized parameters used for MDE in 1.0T and 1.5T are shown on .
Table 1. bFFE Pulse Sequence Parameters
Table 2. MDE Pulse Sequence Parameters
Initially, b‐FFE was acquired prior to contrast injection. Then, all patients received 0.4mmol/kg of gadolinium‐based contrast 10–20 minutes prior to the MDE acquisition. All images were analyzed in an EasyVision® workstation and comparison of image quality was done by calculating for MDE: Signal‐to‐Noise Ratio (SNR) of normal and infarcted myocardium and cavity; Contrast‐to‐Noise Ratio (CNR) of infarcted to normal myocardium, cavity to infarted myocardium and cavity to normal myocardium.
For B‐FFE we calculated: SNR of myocardium and cavity and CNR of cavity to myocardium.
SNR was calculated as mean SI (of tissue analyzed)/ background SD.
CNR was calculated as mean SI (of tissue1)—mean SI (of tissue2)/background SD.
Comparison was tested statistically by paired Student t test.
Results: shows a comparison between MDE by 1.0 and 1.5T systems. shows a comparison of a systolic and diastolic frame acquired by 1.0 and 1.5T systems. Tables show the results and the statistics.
Table 3a. MDE 1.0T
Table 3b. MDE 1.5T
Table 3c. bFFE 1.0 and 1.5T SNR and CNR Comparison
Figure 1. Short axis MDE comparison for 1.0 and 1.5T scanners.
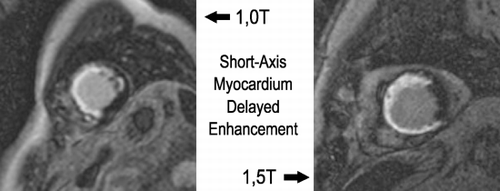
Figure 2. Short axis bFFE systolic and diastolic images comparison for 1.0 and 1.5T scanners.
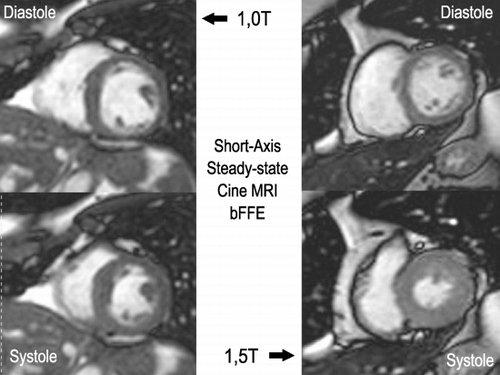
SNR and CNR were higher for 1.5T than for 1.0T systems, however those differences were not statistically significant.
Conclusions: Cine MRI and myocardial viability images acquired by 1.5T and 1.0T systems showed similar image quality measured objectively. Cardiac MR Exam investigating LV function and viability can be performed in a 1.0T system providing images with similar quality to the 1.5T systems.
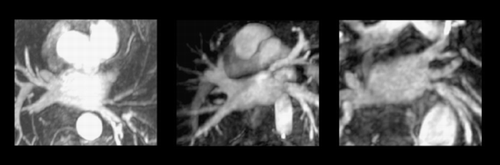
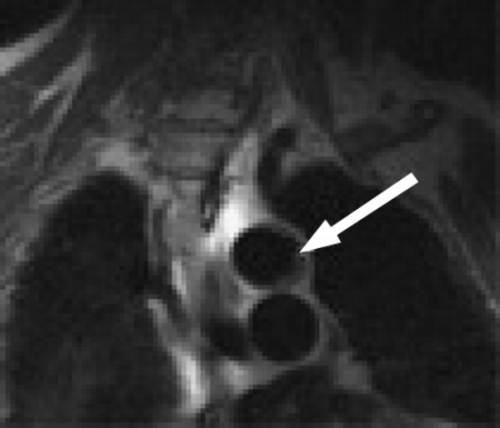
384. Evaluation of Pulmonary Vein Stenosis and Anatomy With MRI After Catheter Ablation of Atrial Fibrilation
Teresa M. de Caralt, MD,1 Santiago Nava, MD,2 LLuis Mont, MD,2 Juan R. Ayuso, MD,1 Carmen Ayuso, MD,1 Marta Sitges, MD.3 1Radiodiagnostic, Hospital Clinic, Barcelona, Spain, 2Cardiac Electrophysiology, Hospital Clinic, Barcelona, Spain, 3Cardiac Ultrasound, Hospital Clinic, Barcelona, Spain.
Introduction: Pulmonary vein stenosis is a known potential complication of electrophysiological ablation procedures for the treatment of atrial fibrillation.
Thrombosis, metaplasia, proliferation and neovascularization, may lead to pulmonary vein stenosis after radiofrequency ablation around or inside the pulmonary vein ostia. Limited information exists concerning pulmonary vein anatomy and no standardized methods for analyzing pulmonary vein anatomy and assessing pulmonary vein stenosis have been described.
Purpose: To evaluate pulmonary vein anatomy and stenosis with MRI after radiofrequency catheter ablation in patients with atrial fibrillation.
Patients and Methods: Thirty patients (20 m/10 f, 51 ± 12 years) with atrial fibrillation underwent radiofrequency ablation in the ostium of 76 pulmonary veins. 20 patients (36 pulmonary vein) with Lasso method and 10 patients (40 pulmonary vein) with Carto method.
Patients underwent gadolinium‐enhanced MR imaging after ablation therapy (range, 50 to 924 days). Using a 1.5T magnet (Signa Horizon cv; GE Medical Systems) with a cardiac phased‐array coil. Magnetic resonance angiograms were obtained with a breath‐hold 3D fast spoiled gradient‐echo imaging sequence in the axial plane. The acquisition time was 19–25 seconds. Maximum intensity projection and multiplanar reformation were performed to reconstruct images of the pulmonary vein.
Results: Left pulmonary vein ostia were oval in shape with the short axis oriented in the anteroposterior dimension.
Variant pulmonary vein anatomy was observed in 26% of patients.
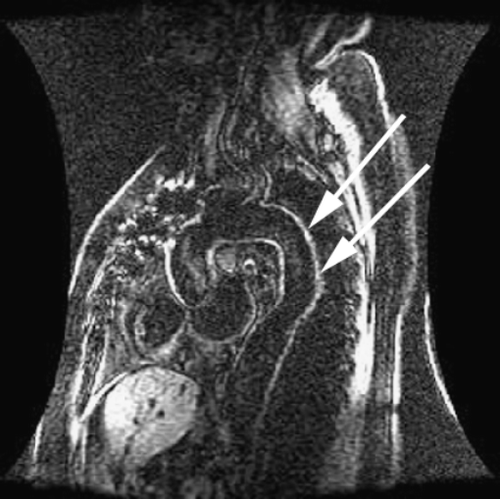
An severe stenosis were detected in 4 veins (5.2%). Three superior left pulmonary vein and one inferior left pulmonary vein (Fig. 1 ).
Figure 1.
All patients were asymptomatic, and none required treatment.
Conclusions: This study demonstrates that 3D MRA is an excellent noninvasive imaging modality to evaluate the PV stenosis and allows identification of anatomic variants.
385. A Pilot Investigation of New Superparamagnetic Iron Oxide (Ferumoxytol) as a Contrast Agent for Cardiovascular MRI
Honglei Zhang,1 Martin R. Prince,1 Shalini G. Chabra,1 Yi Wang,1 Paula Jacobs.2 1Radiology, Weill Medical College of Cornell University, New York, NY, USA, 2Advanced Magnetics, Cambridge, MA, USA.
Introduction: Currently available magnetic resonance (MR) contrast materials with FDA approval that can be used for angiography are gadolinium‐based extra cellular agents which are low‐molecular‐weight compounds that rapidly leak out of the intravascular space. First pass extraction and rapid redistribution into the extracellular space within about 11 minutes limits the window of imaging enhanced vasculature following Gd injection. Newer blood pool agents have longer plasma intravascular half‐life and higher relaxivity. With blood pool agents, the timing of contrast injection is no longer necessary because there is a long imaging window. Superparamagnetic iron oxide colloid ferumoxytol is large enough to avoid leaking out of vessels.
Purpose: To evaluate the imaging potential of ferumoxytol, a new superparamagnetic iron oxide colloid blood pool contrast agent.
Methods: Magnetic resonance (MR) imaging at 1.5 Tesla was performed before and after intravenous injection of ferumoxytol using escalating doses of 0.4, 0.8, 1.2 and 1.6 mg Fe/kg for a total of 4 mg Fe/kg in five subjects imaged with 3D MR Angiography (MRA) of the trifurcation after each dose. In five subjects cardiac cine MRI was performed pre and post 4.0 mg Fe/kg. Image quality was assessed by measuring signal to‐noise ratio (SNR) and contrast‐to‐noise ratio (CNR) in the vascular structures. Pre‐and post‐dose urine and blood tests as well as EKG/vital sign monitoring were performed to evaluate safety and blood samples were collected for T1 relaxivity measurements.
Results: Cumulative doses of 0, 0.4, 1.2, 2.4 and 4 mg Fe/kg yielded mean SNR in the arteries of 10, 16, 39, 57 and 69 respectively indicating that the higher doses produced higher SNR on 3D vascular images. Similarly aorta SNR on 2D time‐of‐flight increased from 11.8 without Fe to 15.4 post Fe (p = 0.004) indicating improved image quality on MRA sequences optimized for use without contrast. At 4mg Fe/kg there was a substantial T1 shortening measured in the blood from 990 ± 573 ms to 80 ± 42 ms (p < 0.0001), corresponding to the increased snr. images of large vascular structures including cardiac chambers, aorta, pulmonary arteries were excellent post ferumoxytol but images of smaller arteries of the trifurcation were difficult to evaluate due to enhancement of the overlapping veins. no serious adverse events occurred ().
Figure 1.
Conclusions: The new superparamagnetic iron oxide colloid ferumoxytol is a promising blood pool agent especially for cardiac, aorta and pulmonary imaging.
386. Screening of Asymptomatic Relatives in Aortic Inherited Diseases. A Comparative Study between Aortic MRI and Transthoracic Echocardiography in a Large Family from Burgundy
Philippe Khau Van Kien, MD,1 Alain Lalande, PhD,2 Nicolas Salve, MD,3 François Brunotte, MD‐PhD,2 Jean‐Eric Wolf, MD, PhD.4 1Laboratoire de Physiopathologie et de Pharmacologie Cardiovasculaire Experimentale, Université de Bourgogne, Dijon Cedex, France, 2Laboratoire de Biophysique, Université de Bourgogne, Dijon Cedex, France, 3Service de cardiologie 2, CHU de Dijon, Dijon Cedex, France, 4Service de Cardiologie 2, CHU de Dijon, Dijon Cedex, France.
Introduction: Thoracic aortic aneurysms (TAA) might be present in asymptomatic relatives of a subject with an aortic disease (Marfan syndrome, Ehlers‐Danlos vascular type, non‐syndromic familial TAA and /or aortic dissection…). The interest of a TAA screening in the families is now well established but to date, no clear consensus has emerged especially for MRI of the aorta.
Purpose: We have performed such a screening with MRI of the aorta, in a large family where 4 cases of aortic dissection were present. Forty asymptomatic relative subjects (sex ratio 1; 20 to 62 years‐old range) were investigated. The results allow us to compare MRI of the aorta with transthoracic echocardiography (TTE) that is well‐defined by a guideline widely used in that kind of screening
Methods:
Thoracic MRI was performed with a 1.5 T magnetic resonance whole body imager (Magnetom Vision, Siemens). Gated Spin‐Echo T1 weighted sequences were obtained in multiple oblique planes parallel and perpendicular to the aortic longitudinal axis. The aortic diameters were measured from inner border to inner borer in the best plane at each level of the thoracic aorta (aortic sinuses, ascending aorta, horizontal aorta, isthmus and descending aorta). We considered the following limit values to assess a dilatation: 40 mm for aortic sinuses, 38 mm for ascending aorta, 35 for horizontal aorta, and 32 for descending aorta.
TTE (Hewllett Packard‐Sonos 2500) well‐known procedure: left decubitus, bi‐dimensional parasternal long axis views of the aortic root, end‐diastole (R wave), measurements perpendicular to the long axis with the leading edge technique at the levels of sinuses and ascending aorta (maximum diameter) and then indexed to the Body Surface Area (BSA cm/m2). We considered, at it is recommended in the guideline the limit values of 2.1cm/m2 for the aortic sinuses and 1.9cm/m2for the ascending aorta that correspond respectively to a specificity of 98% and 97%.
comparison: absolute values of the measurements with MRI and TTE from each subject were statistically matched with a Bland‐Altman test.
Results: MRI and TTE measurements do not differ by more than 3 mm and were well‐correlated at the sinuses level (Spearman test : r = 0.82 ; p < 0.001) as well as these of the ascending aorta (Spearman test: r = 0.75 ; p < 0.001) (see ). TAA at the level of the aortic sinuses were diagnosed when TTE and MRI were both concordant with the limit values considered. There were 3 males with aortic sinuses >2.1cm/m2 or 40 mm recognized by both TTE and MRI and 1 male with a fusiform dilatation of the isthmus recognized only by MRI. Six cases of patent ductus arteriosus in asymptomatic subjects were identified by TTE with Doppler
Figure 1. A. Bland‐Attman plot of the aortic diameters at the level of aortic sinuses measured by MRI versus TTE. B. Bland‐Attman plot of the aortic diameters at the level of ascending aorta measured by MRI versus TTE. (View this art in color at www.dekker.com.)
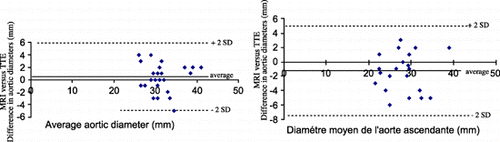
Conclusions: Measurements of the aortic diameter with MRI and TTE are well correlated and the threshold used to define aortic root enlargement with TTE could be applied to MRI. Both methods, MRI and TTE appear to be complementary allowing the exploration of the total aorta, the heart cavity, valves and even patent ductus arteriosus. Screening of asymptomatic subjects in inherited aortic disease is possible without performing Transesophageal Echocardiography that is semi‐invasive, often not well tolerated in asymptomatic subjects and somtimes hampered to explore the totality of the aortic arch.
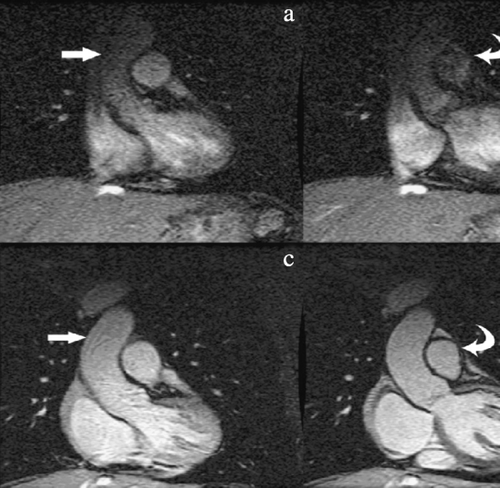
387. Comparison of Spoiled TFE and Balanced TFE coronary MR angiography
Murat Ozgun,1 Andreas Hoffmeier,2 Markus Quante,1 Marc Kouwenhoven,3 René M. Botnar,4 Warren J. Manning,4 Walter Heindel,1 David Maintz.1 1Department of Diagnostic Radiology, University of Münster, Münster, Germany, 2Department of Cardiac and Thoracic Surgery, University of Münster, Münster, Germany, 3Philips Medical Systems, Best, Netherlands, 4Beth Israel Deaconess Medical Center, Boston, MA, USA.
Introduction: Coronary MR angiography represents a promising non‐invasive technique for imaging the coronary arteries. However, the optimal coronary MRA sequence remains to be determined.
Purpose: To compare state of the art coronary MRA sequences with regard to image quality and diagnostic value for the detection of coronary artery disease (CAD).
Methods: Fourteen patients with known CAD were examined with a navigator (NAV) gated and corrected free‐breathing 3D segmented gradient echo (TFE) coronary MRA sequence (TR = 7.1 ms, TE = 1.9, 20 slices, 1,5 mm reconstructed slice thickness, in‐plane resolution = 0.7 × 1mm, scan time = 8 min (50% NAV efficiency) and a balanced TFE sequence (TR = 5.6 ms, TE = 2.8ms, 20 slices, 1.5mm reconstructed slice thickness, in‐plane resolution = 0.99 × 0.99mm, scan time = 7 min (50% NAV efficiency)). Coronary MRA was performed in a double oblique plane along the major axis of the left (5 segments: LM, LAD prox., LAD mid., CX prox., Cx mid.) or right coronary artery system (prox., mid. and distal segment). Subjective image quality (4 point scale) and objective image quality parameters including vessel sharpness, vessel diameter, SNR and CNR were calculated for both sequences. Sensitivity, specificity and accuracy for the detection of stenoses > 50% was determined as defined by the goldstandard X‐ray coronary angiography (XA).
Results: Of 81 possible segments, 49 (TFE) and 57 (BTFE) were included for evaluation. Average subjective image quality was 2.2 for TFE and 1.8 for BTFE. Vessel sharpness was identical for both sequences (37% for both). There was no significant difference in vessel diameter. Average SNR of 17.3 (TFE) and 18.6 (BTFE) was found. CNR was 10.1 for TFE and 10.9 for BTFE. The diagnostic values for the detection of relevant coronary artery stenoses in the evaluated segments were: sensitivity: TFE 91%, BTFE 76%, specificity: TFE 57%, BTFE 85%, and accuracy: TFE 82%, BTFE 79% ( and ).
Figure 1. BTFE: Proximal right coronary artery stenosis.
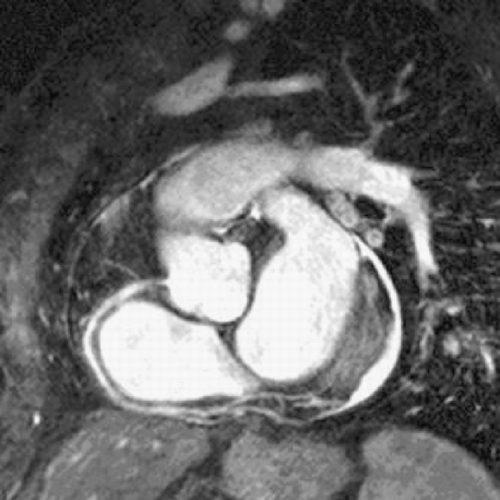
Figure 2. TFE: Proximal right coronary artery stenosis.
Conclusions: Free‐breathing navigator gated and corrected TFE and BTFE 3D coronary MRA show similar subjective and objective image quality and comparable values for the detection of CAD. Further studies are needed due to the relatively small sample size.
388. Pulse Wave Velocity versus Distensibility Measurements in Thoracic Aortic Disease
Dan Devos,1 Julie De Backer,2 Patrick Seghers,3 Koen Verstraete.1 1Radiology, Ghent University Hospital, Gent, Belgium, 2Medical Genetics, Ghent University Hospital, Gent, Belgium, 3Hydraulic Engineering, Ghent University Laboratory of Hydraulics, Gent, Belgium.
Introduction: Dilation of thoracic aorta implies a life‐threatening risk for a patient. MRI is an excellent tool for the evaluation of the thoracic aorta. Different parameters can be measured that describe the status of the aorta.
Purpose: To evaluate how Pulse Wave Velocity (PWV) measurements by Magnetic Resonance Imaging (MRI) compare to Distensibility measurements in the assessment of thoracic aortic disease.
Methods: 25 Marfan patients, 3 patients diagnosed with Ehlers‐Danlos Syndrome (EDS), and 7 patients with Familial Thoracic Aortic Aneurysm (FTAA), referred for assessment of aortic dilation, were scanned on a Siemens Symphony 1.5T MR system. An angiographic examination was followed by through‐plane phase‐contrast images at the level of the aortic valve, ascending aorta, descending aorta, diafragm and low abdominal aorta, each with concurrent non‐invasive measurement of bloodpressure. At the same levels along the aorta high temporal resolution trueFISP images were made for surface area measurement, also with concurrent bloodpressure measurement for each level.
A control group of 15 normal individuals was scanned with the same protocol.
All datasets were postprocessed by the same radiologist. Postprocessing consisted of determining the exact distance between the different aortic levels of the through‐plane phase‐contrast series; the flow curves at these 5 levels were calculated with the Siemens Mean Curve software. Time‐to‐peak and half‐time‐to‐peak were calculated. It was assumed that the pressure pulse passes a certain level in the aorta at half the time‐to‐peak of the flow curve at that level. With time and distance known, a PWV could be calculated for each segment.
High temporal resolution trueFISP images were obtained with a Repetition Time (TR) of 25 milliseconds, providing a temporal resolution of 25 milliseconds. At the level of ascending aorta, descending aorta, thoraco‐abdominal aorta and low abdominal aorta through‐plane surface area of the aorta was measured. These surface areas were subsequently corrected for body surface area, and then used in the calculation of the distensibility.
Results: 17 male and 18 female patients were scanned. Mean age of patients was 34 years.
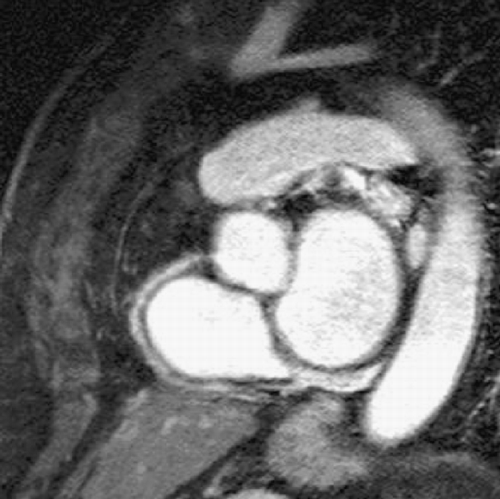
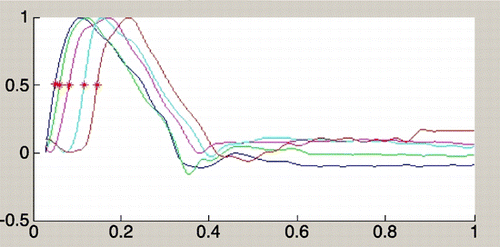
Distensibility for ascending aorta, descending aorta, thoraco‐abdominal aorta and low abdominal aorta was 4.66 , 4.65 , 6.33 and 5.62 respectively in patients, and 5.94 , 5.07 , 7.51 and 6.83 in normal population. shows surface area curve in a Marfan patient. shows surface area curve in a normal person. PWV values were calculated for different segments (one‐level and two‐level segments). The PWV value of the first level (aortic valve to ascending aorta) was not accurate because distance was too small; this resulted in very high values or negative values. The other one‐level PWV values and the two‐level PWV values were used for the statistical analysis. shows flow curves of a Marfan patient (the red asterix indicates half‐time‐to‐peak). shows flow curves of normal person.
Figure 1. (View this art in color at www.dekker.com.)
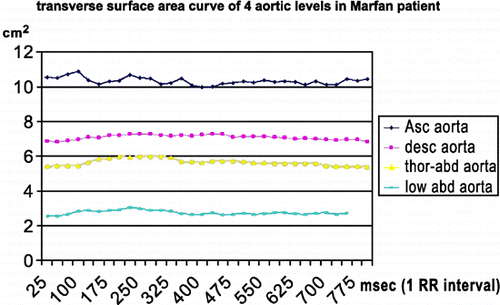
Figure 2. (View this art in color at www.dekker.com.)
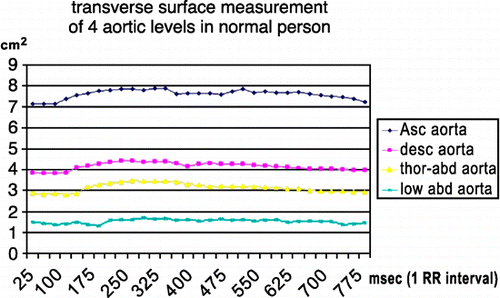
Figure 3. (View this art in color at www.dekker.com.)
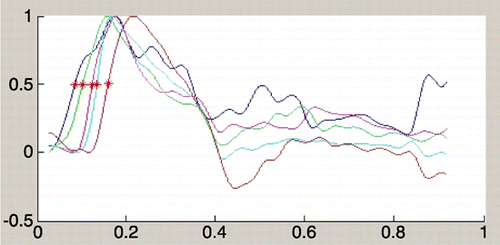
Figure 4. (View this art in color at www.dekker.com.)
In three patients suboptimal flow‐data were collected: one because of technical reason, one due to large metallic lumbothoracic corrective prosthesis and one because of aortic valve prosthesis. One other valve prosthesis did not disturb imaging.
In two patients bloodpressure measurements could not be made because of technical reason. In one patient the metallic lumbothoracic corrective prosthesis also degraded trueFISP images too much for surface area measurement.
Although this extensive examination took about 45 to 60 minutes, it was very well tolerated by the patients.
Conclusion: In this presentation the value of distensibility measurements versus PWV measurement is analysed statistically (ANOVA) for patients with thoracic aortic disease and normal persons.
389. Optimization of Imaging Parameters, SENSE and Coil Comparison for Vulnerable Plaque Imaging in Patients with ACS in a Routine Clinical Practice
Srirama V. Swaminathan, Ph.D.,1 Ian Paterson, MD,2 David L. Owen, RT,2 Anthon R. Fuisz, MD.2 1Clinical Science, Philips Medical Systems, Cleveland, OH, USA, 2Cardiology, Washington Hospital Center, Washington, DC, USA.
Introduction: Recent intravascular ultrasound (IVUS) studies in patients with acute coronary syndromes (ACS) have suggested that vulnerable and ruptured atherosclerotic plaques can be found in the infarct related artery as well as the other two coronary arteries. It is not surprising therefore that a close association exists between clinically significant coronary artery disease (CAD) and plaques in the thoracic aorta as well as the carotid arteries. With high‐resolution (100–300 µm in‐plane) black blood imaging, the arterial wall can be imaged and structural information and plaque composition can be quantified. In literature it is found that most of the plaque imaging has been performed with a specially designed coil configuration, which is commercially not available for routine clinical practice.
Purpose: The objective of this work is multi pronged. First is to optimize the acquisition parameters for the two sets of commercially available coils for vessel wall imaging of the carotid bifurcation. Secondly we would like to compare the performance of the coils in yielding high quality images for plaque quantification for a routine clinical use. Finally we would like to examine the effect of SENSitivity Encoding (SENSE) on image quality by measuring observed SNR and CNR.
Methods and Materials: All the experiments were performed on a Philips 1.5T Intera CV scanner (Philips Medical Systems, The Netherlands) equipped with Master gradients (30 mT/m and 150 T/m/s slew rate). Two sets of 2‐element circular loop surface coils, one with larger diameter (SENSE Flex‐M) and the other with smaller diameter (SENSE Flex‐S), that are commercially available, were used for this study. T1W, T2W and PDW black blood images were obtained on three healthy male volunteers with different neck sizes. Average depth of carotid bifurcation from the surface was 3.5 cm on these subjects. Black blood sequences were all cardiac gated with TE and TR necessary for proper weighting and planned of 2D Time Of Flight (TOF) images. Three slices were planed with slice thickness of 2.5mm and a reconstructed in‐plane resolution of 300µm. The center slice was planned axially on the bifurcation with other two slices on either side. SENSE factors of 2, 1.5 and 1 were used for imaging.
Results: Qualitative and quantitative assessment of the images with different SENSE factors from both the coils was performed. Qualitative assessment was done by two cardiologists in a semi‐blinded fashion. Regions of Interest (ROI) were drawn on T1W, T2W and PDW images () to measure the observed SNR and CNR. shows the percentage increase in CNR of SENSE Flex S coil over SENSE Flex M coil as a function of SENSE factor for T1W images on all three subjects. Similar calculations were done for T2W and PDW images. demonstrates the influence of improper coil placement on image quality. Phantom studies were done to measure B1 profile of the elements of the coil ().
Table 1. Percentage Increase in CNR of Flex S Over Flex M as a Function of SENSE Factor
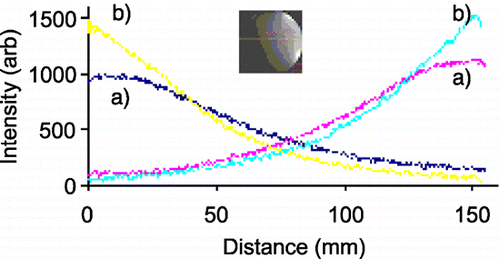
Figure 1. (a) T1, (b) T2 and (c) PD weighted BB images of the carotids are shown here. Images on the left column are from SENSE Flex M coil and the one right are SENSE Flex‐S. (View this art in color at www.dekker.com.)
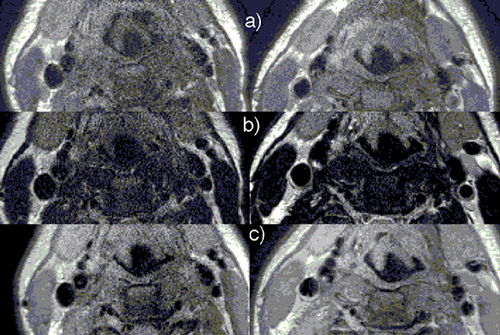
Figure 2. Influence of improper coil placement on image quality is depicted by (a) T1, and (b) T2 weighted BB images of the carotids. (View this art in color at www.dekker.com.)
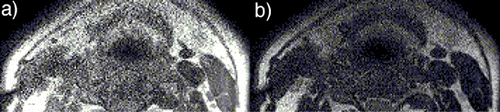
Figure 3. Plot of B1 profile for the two circular loops of (a) SENSE Flex M and (b) SENSE Flex S coils. (View this art in color at www.dekker.com.)
Discussion: SENSE Flex S image quality was comparable or better on all the subjects compared to SENSE Flex M coil. As expected the images with higher SENSE factors yielded lower SNR compared to the lower SENSE factors. CNR also behaved similarly as SNR for different SENSE factors. Due to faster data acquisition with higher SENSE factors, images are less affected by motion artifacts. Our initial experience shows that SENSE Flex S coil is the coil of choice due to better focussed homogeneous B1 field resulting in superior image quality. Coil placement as close to the surface as possible is very essential to achieve the necessary high resolution, SNR and CNR. It would also be useful to have additional elements for signal augmentation.
390. Normal Values for the Human Right and Left Ventricular Volumes and Mass Obtained from Steady State Free Precession Magnetic Resonance Imaging
Alexandra Rauch,1 Daniel Sauer,2 Andrea Freitag,2 Josef Haimerl,2 Ekkehard Sauer,2 Wolfgang Bauer.1 1Cardiology, University Würzburg, Würzburg, Germany, 2Internal Medicine, Hospital Landshut‐Achdorf, Landshut, Germany.
Introduction: Cardiovascular magnetic resonance imaging (CMRI) has demonstrated its ability to measure cardiac volumes, mass, and function so accurately, that it is accepted as the gold standard. In the past, numerous papers have addressed this for the segmented k‐space turbo gradient echo (TGE) sequence. However, recently imaging with steady state free precession sequences (SSFP) has demonstrated that it is superior to TGE imaging since it provides a higher contrast between blood and myocardium at the endocardial border. This implies that parameters depending on this boundary detection, as ventricular volumes, mass, may differ from that of TGE.
Purpose: The aim of our study was to obtain reference values for a large collective for the SSFP imaging technique. The dependence of these data on height, weight, body surface area and gender was analyzed. Additionally independent predictors for cardiac parameters were obtained by a multivariate analysis.
Methods: 100 normal subjects (50 male, mean age 38 ± 14 and 50 female, mean age 41 ± 13) with no known risk factors or previous history of cardiovascular disease were recruited.
MRI studies are done on a 1.5 Tesla scanner ( Sonata; Siemens, Erlangen, Germany). Localizing scans are followed by cine‐acquisition in ventricular long‐axis and horizontal long‐axis planes. Using SSFP short‐axis sections were acquired from the atrioventricular ring to the apex, with 8.0 mm section thickness and 2.0 mm gap.
Analysis was done with the Argus software (Siemens).
All parameters were presented as mean ± standard deviation. The normal range was calculated as 95% confidence interval of the median.
The multivariate analysis predicted the cardiac parameters (EDVLV, ESVLV, LV mass, EDVRV, ESVRV) form independent predictors (height, weight, age, gender).
Cardiac parameters can be calculated by the following formula:The correlation between predicted values obtained from multivariate regression analysis and true values was quantified by linear regression analysis.
A p‐value of < 0.05 was considered statistically significant
Results: shows cardiac parameters for the entire group as well as for the male and female subgroup. The differences between males and females are significant for all right and left ventricular parameters except ejection fraction.
Table 1. LV/RV Values Given as Mean Value ± Standard Deviation and Range
Multivariate analysis of cardiac parameters on gender, age, height and weight reveal as independent predictors for ESVLV and EDVLV height and age, for LV mass weight and gender, for EDVRV and ESVRV height and gender. In general, cardiac parameters correlate significantly with their independent predictors, as shown by the significance value and correlation coefficient ().
Table 2. Predictors of LV/RV Values
Using the regression coefficients of multivariate analysis, cardiac parameters can be calculated by the Eq. 1.
Conclusions: MR imaging utilizing SSFP pulse sequence will gain an important position in the assessment of volumes and function of the heart. Normal reference values of left ventricular dimensions and mass are of importance in the diagnosis and prognosis of patients with heart disease. In the differentiation between normal and pathologic LV parameters, the dependence of LV dimensions on body size should be accounted for.
391. Visualization of Vessel Wall Thickening by 3D TrueFISP Imaging
Daisy Chien, Ph.D., Ed Gill, Louise Thomson, MD, Rola Saouaf, MD, John Friedman, MD, Daniel Berman, MD. Imaging, Cedars‐Sinai Medical Center, Los Angeles, CA, USA.
Intro: The majority of the work on plaque and vessel wall imaging has focused on 2D techniques. 3D imaging offers the advantage of covering a vasculature of interest volumetrically and with near isotropic resolution. 3D time‐of‐flight imaging has been applied but the vessel wall itself is not readily seen with MR angiography sequences as they tend to suppress signal from stationary tissue.
Purpose: The purpose of this study was to investigate the use of 3D TrueFISP to visualize the carotid vessel wall and to detect abnormal vessel wall thickening.
Methods: Imaging was performed using specially made carotid RF coils (Machnet B.V., The Netherlands) that were placed bilaterally adjacent to the carotid arteries. Images were acquired using a 1.5 T scanner (MAGNETOM Sonata, Siemens AG). 3D TrueFISP imaging was optimized by 1) the use of triggered flow velocity measurements to determine the optimal timing for 3D image acquisition and 2) minimizing off‐resonance effects by adjusting the frequency offset. Initial fine‐tuning was first performed in 5 normal volunteers. Thereafter,1) 3D time‐of‐flight (TR/TE: 25/7 ms, voxel size: 0.4 × 0.5 × 1.5 mm, scan time: 2 min 11 sec); 2) 2D dark blood turbo spin echo (TR/TE:R‐R interval/14 ms, triggered to diastole, voxel size: 0.4 × 0.3 × 3 mm, scan time: 43 sec); and 3) the optimized 3D TrueFISP (TR/TE:R‐R interval/2.3 ms, 51 segments, triggered to diastole, voxel size: 0.4 × 0.4 × 2 mm, scan time: 2 min 24 sec) were acquired in 9 volunteers and 3 patients with known carotid artery disease. Image quality was evaluated by visual inspection and signal‐to‐noise measurements were made.
Results: High quality images of the vessel wall were obtained using 3D TrueFISP with optimal timing delay and frequency offset. The SNR (signal‐to‐noise ratio) was 1) 2.8 ± 0.3 for the time‐of‐flight, 2) 3.1 ± 0.5 for the TSE, and 3) 13.3 ± 1.6 for the 3D TrueFISP. In addition to the increase in SNR, 3D TrueFISP gave better delineation of the vessel wall than the 3D time‐of‐flight technique. It also provided thinner multi‐planar reconstructions, better spatial resolution along the slice select direction, and was not affected by partial volume effect as in 2D imaging. Among all the subjects studied, the thickness of the vessel wall measured by electronic caliper ranged from 0.3 mm to 2.7 mm. The 3 patients with known carotid disease demonstrated thickened vessel wall with thickness ranging from 1.7 to 2.7 mm ().
Figure 1. 3D TrueFISP imaging of the carotid artery of a normal volunteer acquired axially and the multi‐planar reconstruction along the direction of the vessel.
Conclusion: This study has demonstrated that despite challenges to 3D imaging of the vessel wall, 3D TrueFISP technique can be optimized to obtain high resolution and high quality images to detect vessel wall thickening in the carotid artery.
392. Is There a Role of Delayed Post Contrast MR Imaging in Detecting Persistence of Disease Activity in Takayasu's Arteritis?
Milind Y. Desai, MD,1 Thomas Foo, PhD,2 David Hellmann, MD FACP,3 João A. C. Lima, MD, MBA,1 David A. Bluemke, MD, PhD.2 1Cardiology, Johns Hopkins Hospital, Baltimore, MD, USA, 2Radiology, Johns Hopkins Hospital, Baltimore, MD, USA, 3Internal Medicine and Rheumatology, Johns Hopkins Bayview Hospital, Baltimore, MD, USA.
Introduction: Takayasu's arteritis (TA) is a rare chronic vasculitic disorder involving the aorta and its branches. There is poor correlation between signs, symptoms, levels of inflammatory markers and disease activity in 50 % of patients with TA. Magnetic resonance (MR) imaging has been utilized successfully to diagnose TA. Delayed MR imaging following contrast injection is a relatively new technique being utilized to assess myocardial viability. However, the inversion times (TI) used for that are in the order of 200 ms, to supress the signal from normal myocardium, but not signal from blood. We hypothesized that delayed post contrast MR imaging might help in assessing disease activity in TA by adjusting the TI to suppress signal from blood and emphasizing the conspicuity of vessel wall enhancement.
Purpose: We report our initial experience with delayed MR imaging of the aortic wall following gadolinium injection in patients with TA.
Methods: Five patients diagnosed with TA (age 27–60 years, 4 females) were imaged using a 1.5T MR scanner (General Electric). Standard electrocardiographic gated T1 weighted axial and oblique black blood images were obtained. Subsequently, 0.2 mmol/kg of gadolinium was infused and delayed images were obtained after 10 minutes. The TI was kept around 75–100 ms to suppress the signal from aortic blood as well as perivascular fat. In the delayed images, contrast to noise ratio (CNR) was calculated as signal intensity of the aortic wall‐signal intensity of the surrounding structure (lumen)/standard deviation of the background noise (air).
Results: Two patients had symptoms suggestive of TA. Three out of 5 patients had abnormally elevated high sensitivity C‐Reactive Protein (range 1.7–9.2 mg/dl) and elevated sedimentation rate (range 20–48 mm/hr) and 2 had normal values. All the 5 patients revealed characteristic thickening of the aortic wall on the pre contrast images. The TI ranged from 75–100 ms in all the patients. However, only the 3 patients with abnormal laboratory values had evidence of delayed hyper‐enhancement (DHE) in the aortic wall ( and ). The CNR ranged from 7.02 to 12.26 in all 5 patients.
Figure 1.
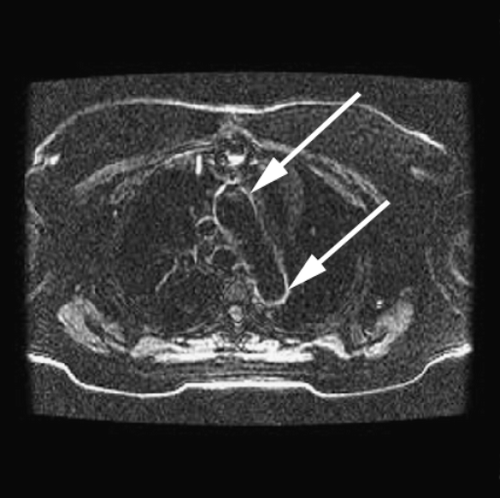
Figure 2.
Conclusion: There seems to be presence of DHE only in the post contrast images of the aortic wall of patients that have laboratory evidence of active TA. Thus, presence of DHE in delayed post contrast images of the aorta might represent persistence of disease activity, however, it is yet to be ascertained fully. If so, this DHE on post contrast MR images would be a novel way (with the potential for becoming an excellent marker) to identify and follow disease activity in TA.
393. Extent of Aortic Atherosclerotic Plaque Detected by Surface and Transesophageal MRI and its Association with Renal Dysfunction
Milind Y. Desai,1 Henning Steen,1 Michael Choi,2 William P. Warren,1 Sandeep Gautam,1 Joao A. C. Lima.1 1Cardiology, Johns Hopkins Hospital, Baltimore, MD, USA, 2Nephrology, Johns Hopkins Hospital, Baltimore, MD, USA.
Introduction: With the advent of sophisticated magnetic resonance imaging (MRI) techniques, quantification of atherosclerotic plaques (AP, ) in the thoracic aorta (TA) has become feasible. Renal dysfunction is now considered to be a coronary risk equivalent. There is growing evidence linking the extent of aortic atherosclerosis and the degree of renal dysfunction. We sought to delineate that association using MRI.
Figure 1.
Purpose: To determine if there is an association between the extent of aortic atherosclerosis detected by surface and transesophageal MRI and renal dysfunction.
Methods: Twenty eight consecutive patients (54 % males, 90 % whites) who were enrolled in a trial evaluating the role of cholesterol lowering therapy on the aortic AP size were studied at baseline. All patients underwent a baseline MRI of the TA in a 1.5 T magnet using a standard surface coil and a transesophageal (TE) coil. The AP was divided into 6 contiguous slices and we obtained 5 T‐1 weighted images of each slice (1 from chest coil, 2 from back coil, 1 from transesophageal coil and 1 combined image). Subsequently, we traced luminal and outer aortic wall boundaries using a region of interest tool and calculated the plaque area (cm2) and volume (cm3) utilizing the Simpson’s formula: [(image 1 area + image 5 area) + 4 × (image 2 area + image 4 area) + 2 × (image 3 area)]/3 + [(image 5 area + image 6 area)/2]. A history of high cholesterol (HC), diabetes mellitus (DM), coronary artery bypass (CABG), hypertension (HTN), smoking and use of nephrotoxic drugs, congestive heart failure (CHF) and baseline serum creatinine were also recorded. Glomerular filtration rate (GFR) (expressed as ml/min/1.73 m2) was calculated using the following formula: 186 × (serum creatinine− 1.154) × (age− 0.203) × 1.212 (if black) × 0.742 (female). The patients were divided into 2 groups: group 1 (GFR > 89) and group 2 (GFR < 90).
Results: The incidence of male gender, DM, HTN, CHF, HC, smoking and nephrotoxic drug use was similar in the 2 groups. The mean age was 63 ± 7 vs. 73 ± 8 years in groups 1 and 2 respectively, p < 0.01). The mean AP area in the TA was found to be 1.3 ± 0.6 cm2 in group 1 (n = 11) vs. 1.9 ± .5 cm2 in group 2 (n = 17, p < 0.01, after correction for age). Similarly, the mean AP volume was found to be 2.4 ± 1 cm3 in group 1 vs. 3.8 ± 1 cm3 in group 2 (p < 0.01, after correction for age). Thus, patients with an abnormal GFR had 37 % increased AP volume compared to patients with a normal GFR, independent of other comorbid conditions.
Conclusion: We conclude that patients with renal dysfunction have a higher plaque burden in the TA, independent of other factors. This can be elucidated very well using a combination of surface and TE MRI. There could be a potential role of lipid lowering in altering the progression of renal dysfunction in patients with known aortic atherosclerosis. Serial MRI examinations may be useful to assess the progression/regression of aortic atherosclerosis.
394. MRI Signal Characteristics of Symptomatic and Asymptomatic Human Carotid Plaques in vivo
Ralf Wassmuth, MD, Rainer Dietz, MD, Matthias G. Friedrich, MD. Franz‐Volhard‐Clinic, Humboldt‐University Berlin, Berlin, Germany.
Introduction: MRI can contribute to plaque characterization, however experience for clinical application in vivo is limited. We describe MR characteristics in carotid plaques related or not related to clinical events.
Purpose: The purpose of the study was to analyze the signal characteristics of symptomatic and asymptomatic carotid plaques in humans.
Method: We consecutively scanned 18 patients (11 male, 48–76 years) with carotid plaques described as partly or predominantly echolucent by ultrasound. The referring physicians graded the patients as symptomatic (n = 6) or asymptomatic (n = 12). Axial images of the carotid bifurcation were acquired in a 1,5 T clinical magnet using a two‐element‐phased‐array surface coil. We obtained corresponding images in proton‐density‐weighting (PDW), T2‐weighting as well as in T1‐weighting (T1‐W) before and after administration of 0.1 mmol/kg Gd‐DTPA with a gated double‐inversion‐recovery black‐blood spin echo sequence. Spatial resolution was 0.3 mm/pixel in plane with a slice thickness of 3 mm. Signal to noise ratios (SNR) and contrast to noise ratios (CNR) were calculated.
Results: Out of 18 patients 14 had severe carotid stenosis, 4 had moderate stenosis. Among the 6 symptomatic stenoses 5 were severe. The symptomatic patients all had homogeneous plaques in PDW images. In PDW, plaque SNR was higher in symptomatic than in asymptomatic patients (38 ± 17 vs. 17 ± 10; p < 0,01). Compared to muscle, CNR was higher in symptomatic than in asymptomatic patients (1,4 ± 0,4 vs. 1,1 ± 0,2; p < 0,05). In symptomatic patients plaques had higher SNR in PDW than in T1‐W (38 ± 17 vs. 24 ± 11 p < 0.05), whereas in asymptomatic patients there was no difference between PDW and T1‐W (17 ± 10 vs. 21 ± 8). Most plaques were predominantly hyperintense in T2 with no difference in SNR between groups. Contrast enhancement was heterogeneous. The mean enhancement did not differ between groups (25% vs. 38%, p = ns).
Conclusion: In a small sample of carotid plaques those related to clinical events were homogeneously hyperintense in PDW images and brighter in PDW than in T1‐W, whereas asymptomatic plaques were of heterogeneous appearance with lower SNR in PDW. Further comparisons with other modalities are required to elucidate the MR appearance of high‐risk plaques.