430. Low Dose Dobutamine Stress 3D Tagged and First‐Pass Contrast‐enhanced Magnetic Resonance Imaging for Regional Detection of Stunned Myocardium
Izlem Izbudak, MD,1 Walter G. O'Dell, PhD,2 Luciano Amado, MD,1 Raymond C. Boston, PhD,3 Dara L. Kraitchman, VMD, PhD.1 1Radiology, Johns Hopkins University, Baltimore, MD, USA, 2Radiology, University of Rochester, Rochester, NY, USA, 3University of Pennsylvania, Kennett Square, PA, USA.
Introduction: The differentiation of reversibly injured, i.e., stunned, myocardium from irreversibly injured myocardium is important for driving clinical therapy.
Purpose: A canine model of transient ischemia was used to investigate the role of low dose dobutamine stress (LDDS) tagged and perfusion MRI for the detection of stunned myocardium and recovery at 1 week.
Methods: Five mongrel dogs underwent a 20 minute coronary artery balloon occlusion followed by reperfusion to create myocardial stunning. Three‐dimensional tagged MRI (fast, breath‐hold, segmented k‐space, ECG‐gated gradient echo acquisition) was performed at rest and during 5 ug/kg/min dobutamine stress at one week before (baseline), ∼ 1 hr after, and one week after transient ischemia (recovery) on a 1.5 T MR scanner. Short‐axis and rotating long‐axis tagged images were obtained spanning the left ventricle. The tag lines detection and tracking and 3D circumferential strain in the midwall were calculated in 12 circumferential segments at 8 anatomic levels using custom software. Myocardial tissue at risk of stunning (S) was identified based on < 0.1 ml/g/min microsphere blood flow during occlusion and compared to remote (R) tissue. Early after reperfusion, 248 S segments and 424 R segments were identified for statistical analysis. A linear regression analysis of strain versus time yielded systolic strain rate (SSR) comparing the same S and R segments at baseline and recovery. First‐pass CE MRI (saturation recovery fast gradient echo EPI hybrid sequence) was performed in the 4–6 short‐axis planes after a 0.05 mmol/kg iv bolus of Gd‐DTPA. TTC staining was performed post‐mortem.
Results: TTC staining demonstrated 100% viable myocardium at euthanasia. Signal intensity time curves of CE MRI were similar between stunned (S) and non‐stunned remote (R) tissue (P = NS). SSR was reduced in stunned tissue in the first hours after ischemia relative to remote at rest (− 0.15 ± 0.12 S vs. − 0.32 ± 0.10 R, P < 0.05). LDDS in the first hours of reperfusion showed improved function in stunned tissue (− 0.30 ± 0.16 LDDS vs − 0.15 ± 0.12 rest, P < 0.05) as well as remote ( − 0.45 ± 0.23 LLDS vs 0.32 ± 0.10 rest, P < 0.05). Moreover, S regions showed complete recovery of function at 1 week at rest (− 0.53 ± 0.23 S vs − 0.44 ± 0.20 R, P = NS). There was no significant change in SSR at rest in R regions from baseline to reperfusion and recovery. LDDS caused significant increase in SSR in all regions at each time point of MR imaging.
Conclusion: LDDS MRI with 3D myocardial tagging can non‐invasively identify dysfunctional myocardium that can be recruited, which is the hallmark of stunned tissue. CE‐MRI did not demonstrate any differences between stunned and non‐stunned tissue. Thus, tagged serial MRI exams may be sufficient to demonstrate stunned tissue and recovery at 1 week.
431. Optimized Quantification of Myocardial Blood Flow and Volume with MR First‐Pass Perfusion Imaging
Thomas A. Goldstein,1 Yun Gao, Ph.D.,1 Wolfgang Elbert, Ph.D.,2 Robert J. Gropler, M.D.,1 Jie Zheng, Ph.D.1 1Radiology, Washington University Medical School, St. Louis, MO, USA, 2Schering AG, Berlin, Germany.
Introduction: Myocardial blood flow (MBF) mapping with MR first‐pass perfusion imaging technique has shown potential clinical applications for diagnosing coronary artery disease, and may foster a better understanding of the role of collateral dependent myocardial blood flow. Accurate determination of MBF remains difficult because methods for calculating lag times and extracting baseline are not reliable.
Purpose: To develop a more accurate method for evaluating first‐pass myocardial perfusion, in particular, for automated calculation of lag time and baseline without any assumptions on the shapes of residue curves.
Methods: Simulation—Input functions and residue functions were simulated using gamma‐variant and Fermi functions respectively. Convolution was performed on the input and residue curves to obtain simulated concentration readings in tissue. Gaussian white noise was added to curves to obtain a CNR of 12:1 in tissue, and 20:1 in input functions. Lag times were randomly chosen for each simulation. In vivo study—A 70% diameter narrowed Teflon ring was introduced into the middle of left circumflex coronary arteries in two dogs. MR imaging were performed on a 1.5 T Siemens Sonata system. First‐pass perfusion images were obtained through dynamic acquisitions of 60 T1‐weighted images with a 2D single‐slice inversion‐recovery prepared trueFISP sequence. A dose of 0.015 mmol/kg of Gadomer‐17 was injected two times, one at rest and one at 10 min after a 4‐min infusion of 0.14 mg/kg/min Dipyridamole. Color microsphere measurements were performed at the same time. At the end of study, Tc‐99 m labeled red blood cells (RBC) were injected into the dogs to measure myocardial blood volume (MBV) at rest. Analysis—Concentration readings were taken from dogs by drawing ROI's in the left ventricle and in the tissue surrounding it. After smoothing data with a Gaussian kernel, deconvolution was performed on the data, and residue functions were calculated. The level of baseline noise was chosen to minimize discrepancies between the observed taken from myocardial tissue and the ideal concentration readings calculated from the input function. Lag times were chosen based on the best shape of calculated residue functions.
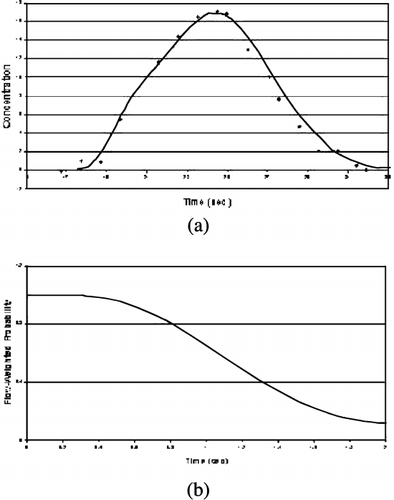
Results: Simulation—With mean transit times of 1.8 seconds, error in lag approximation was negligible (0.0047 ± 0.095 seconds), with a high correlation (.988) between approximated and actual lag time values. Error of Baseline approximation was also relatively small (− 0.4 ± 2% of contrast) with our automated methods. In vivo Experiments—The data fit well to the model (sample fits shown in Figure ). Residue functions obtained from deconvolution exhibit normal characteristics (Figure ). Table and show averages and standard deviations of MBF and MBV measurements in two dogs using MR methods and the “gold standard” measurements taken by microsphere and Tc‐99 m methods, demonstrating the accuracy in the MBF measurement at rest and during the vasodilation stress. It is noted that MBV measured with MRI increased 84% in the normal LAD region, whereas there was only 20% increase in the MBV on the LCx region. This was consistent with other experimental observations reported with moderate stenosis.
Conclusion: This method has been shown to provide accurate measures on MBF and MBV volume, as well as underlying lag times and baselines. In addition, it also has the attribute that it can be optimized to run extremely fast, providing potential for fast and accurate myocardial perfusion mapping in a clinical settings.
432. Characterization of Function Using MRI and Perfusion Reserve Using Microspheres and SPECT in a Canine Model of Single‐Vessel Coronary Artery Disease
Katie S. Lekx, BSc,1 Gerald Wisenberg, MD,2 R. Glenn Wells, PhD,1 Jane Sykes,1 Frank S. Prato, PhD.1 1Diagnostic Imaging, Lawson Health Research Institute, London, ON, Canada, 2Division of Cardiology, University of Western Ontario, London, ON, Canada.
Introduction: Patients who undergo revascularization procedures and have contractile dysfunction with viable myocardium have a better outcome than those patients with contractile dysfunction but without viability in the dysfunctional region. Our group, therefore, sought to develop an animal model of contractile dysfunction with preserved viability to develop a method for accurate delineation of this pathology from infarcted and normal myocardium using a constant infusion of Gd‐DTPA using MRI. However, previous work in our laboratory has shown that a chronic, significant coronary artery stenosis in a dog model does not produce long‐term contractile dysfunction, although partition coefficient measurements were not increased indicating maintained tissue viability.
Purpose: This study sought to characterize the perfusion reserve (PR) in the acute (1 day) and chronic (3 weeks) setting using radioactively‐labeled microspheres with pharmacological hyperemia. As well, weekly measurements of PR using single‐photon emission computed tomography (SPECT), and global myocardial function, using MRI, were acquired in the chronic model of significant coronary artery stenosis.
Methods: Eight and 3 female dogs were used for the acute and chronic studies, respectively. The coronary stenoses were created in the LAD coronary artery and stenosis formation was guided angiographically and adjusted as required to ensure consistent stenosis severity in the 70–80% range in all animals. Coronary hyperemia was induced for the acute studies by using either adenosine (n = 4) or dobutamine (n = 4), and only dobutamine was used for the chronic studies. In the acute studies, perfusion was assessed using microspheres, injected at rest and during stress prior to stenosis formation and during hyperemia immediately following stenosis creation, as well as during a transient occlusion (45 s) to determine the Region at Risk (RAR). In the chronic studies, MR imaging was performed on a Siemens Vision 1.5 T scanner prior to surgical intervention and then weekly following stenosis formation. Cine images were used for assessment of global function. Additionally, perfusion was assessed at rest and during hyperemia weekly during the 3‐week protocol using Tc‐99m‐sestamibi SPECT as well as with radioactively‐labeled microspheres.
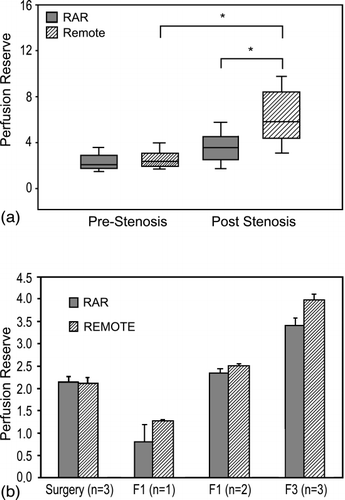
Results: In the acute studies, PR, measured with microspheres, in the at‐risk tissue was reduced significantly compared to the remote tissue during both dobutamine (3.62 vs. 6.22; P < 0.05) and adenosine (2.08 vs. 2.87; P < 0.05) hyperemia. PR results obtained in the acute study, using dobutamine, and in the chronic study are shown in Figure and Figure , respectively. SPECT imaging revealed a greater PR response in the remote tissue than in the RAR tissue throughout the 3‐week experiment (P = NS). Average values ranged between 2.79–3.42 in the remote tissue and 2.67–2.84 in the RAR tissue. The results obtained using microspheres were considerably different than the SPECT results. In the acute studies, PR in the remote and RAR tissue at the time of surgery following stenosis formation was 2.12 ± 0.12 and 2.15 ± 0.12 (P = NS), at 1 week (F1) was 1.28 ± 0.04 and 0.82 ± 0.30 (P < 0.05), at 2 weeks (F2) was 2.50 ± 0.06 and 2.37 ± 0.08 (P < 0.05), and at 3 weeks (F3) was 3.99 ± 0.13 and 3.42 ± 0.17 (P < 0.05), respectively. Global function was not affected throughout the 3‐week protocol, with ejection fraction values ranging between 31.7% (baseline) to 37% (F1 and F3).
Figure 1. a) Perfusion reserve results from the acute studies during dobutamine hyperemia. Perfusion reserve in the remote tissue was significantly higher within 30 min of stenosis formation than in the RAR tissue (P < 0.05). b) Perfusion reserve results obtained using microsphere injections in the chronic study. Other than immediately following stenosis formation at the time of surgery, perfusion reserve was higher in the remote tissue than in the RAR tissue (P < 0.05), however, perfusion reserve increased significantly over the course of the experiment in both tissue regions.
Conclusions: Although PR was attenuated acutely in this model, there was no significant attenuation chronically despite maintenance of stenosis severity as determined by x‐ray angiography. The lack of sustained reduction in PR may, in part, explain the lack of development of sustained contractile dysfunction. Further studies are on‐going to determine regional contractile behaviour, using MRI, and to determine regional differences in glucose metabolism, using PET.
433. Regional Variation of the Onset of Strain Relaxation in Early Diastole
Han Wen, Ph.D.,1 Caroline H. Cheng.2 1Nhlbi, National Institutes of Health, Bethesda, MD, USA, 2Princeton University, Princeton, NJ, USA.
Introduction: Electrical repolarization of the ventricles after contraction is believed to start from the outer apical surface and propagate toward the inner basal surface (Guyton and Hall, Citation). The timing of strain relaxation has been shown to vary circumferentially in the left ventricle (Zwanenburg et al., Citation). In this study, the time to onset of strain relaxation was measured in long axis slices in canine hearts. The global sequence of strain relaxation was found to be different from the electrical event.
Purpose: The purpose of this study is to quantify the sequence of timing of the onset of strain relaxation in the whole heart.
Methods: Beagles (n = 13) were anaesthetized and ventilated at 25 breaths/min. Right atrial pacing was realized with a MR compatible catheter via the femoral vein. Pacing and ventilation were synchronized to remove respiratory motion artifacts.
Scans were performed on a 1.5 T clinical scanner (Sonata, Siemens). In long‐axis slices, myocardial wall motion during the diastolic period was mapped with DENSE tissue tracking (Aletras et al., Citation). The imaging parameters were: matrix size = 128 × 96, FOV = 190 × 190 mm2, true temporal resolution 6.2 ∼ 10 ms.
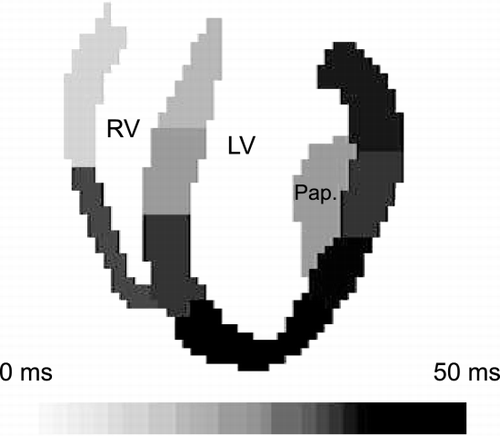
The long‐axis slice contained the right and left ventricles and the lateral papillary column of the LV. They were segmented into ten areas as shown in Figure above.
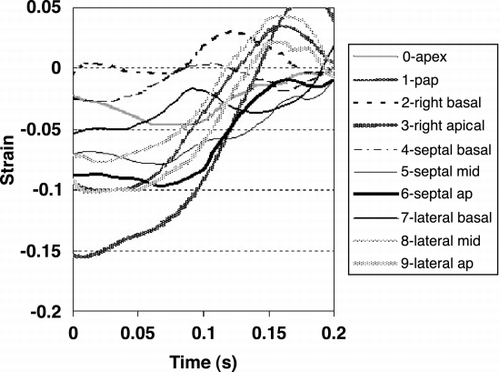
The longitudinal strain as a function of time was calculated for each area in order to determine the time of the onset of strain relaxation. Figure contains the time strain curves from a dog heart.
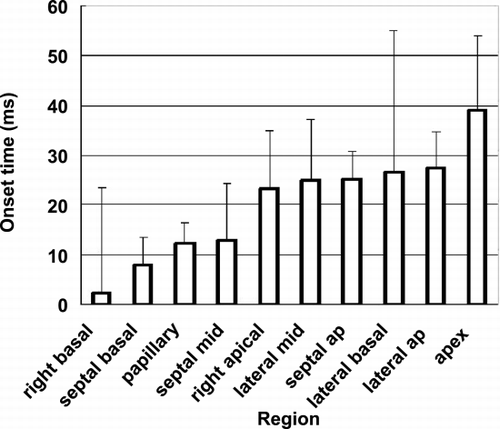
Results: Figure is a chart of the onset of strain relaxation and standard deviations in the ten areas. The timing sequence is graphically represented in Figure . Generally, strain relaxation first occurred in the base of the right ventricle and the base of the septum, and reached the apex after 35 ms of delay. Another feature is that strain relaxation in the lateral papillary muscle occurred significantly earlier than the adjacent lateral wall of the LV.
Conclusions: The sequence of the onset of strain relaxation in the ventricles is nearly the opposite of electrical repolarization. Strain relaxation starts from the right basal region of the heart and ends at the apex. This discrepancy has two possible reasons: heterogeneous delay in the electro–mechanical coupling of the myocardium and different mechanical loading conditions in different areas. Stress measurement will be needed to resolve the contribution of the two factors.
434. Abnormal T1 Changes in Stunned Myocardium Following Manganese Administration
Sandra Pujadas, MD, Gabriele A. Krombach, MD, Maythem Saeed, DVM, PhD, Charles B. Higgins, MD, Mike F. Wendland, PhD. Radiology, University of California San Francisco, San Francisco, CA, USA.
Introduction: Manganese (MnCl2) ions distribute into viable myocardial cells through voltage‐operated calcium channels and remain for several hours. Therefore, the accumulation of manganese may indicate calcium channel activity. MnCl2 is also is observable on magnetic resonance imaging (MRI) as R1 (1/T1) increase. Delta R1 is proportional to manganese concentration, providing a potential method to quantified Ca2 + channel activity.
Purpose: The purpose of this study was to determine whether stunned myocardium exhibits reduced manganese uptake (reduced T1 enhancement).
Materials and methods: Twenty four rats were divided into three groups and subjected to three 10 min episodes of LAD occlusion (group 3), a single 10 min occlusion (group 2) and a control group without occlusion (group 1).
Inversion‐recovery echo‐planar MRI was used to measure regional R1 (1/T1) values of the heart and chamber blood before and at 5 min intervals after administering 0.25 mmol/kg MnCl2. Delta R1 was calculated as Delta R1 = R1 postcontrast‐R1 precontrast.
Results: Both normal and stunned myocardium showed persistent steady level after MnCl2 administration, indicating manganese accumulation, whereas blood showed a rapid clearance. After manganese injection, delta R1 of non‐ischemic myocardium was significantly (p ≤ 0.025) greater than of stunned myocardium (2.18 ± 0.22 vs 1.39 ± 0.17, 2.04 ± 0.29 vs 0.85 ± 0.06, respectively for group 2 and group 3) indicating reduced MnCl2 ion uptake in the stunned region. Interestingly, non‐ischemic myocardium of stunned preparations exhibited greater MnCl2 ion uptake than normal control hearts (2.29 ± 0.19, 2.08 ± 0.24, respectively for group 2 and 3, vs 1.57 ± 0.20).
Conclusions:
Calcium channel activity (as indicated by MnCl2 uptake) may be reduced in the stunned myocardium
The reduced activity enables MnCl2‐enhanced visualization of the dysfunctional zone as a hypo‐enhanced zone on MRI
Remote myocardium shows higher manganese uptake than normal myocardium, consistent with hyperdynamic function of this region during the first hours post‐ischemic insult
435. Sodium Concentrations in the Human Heart Measured with 23Na MRI
Ronald Ouwerkerk, Ph.D. Radiology, Johns Hopkins University, Baltimore, MD, USA.
Introduction: An imaging technique that can not only detect myocardial infarction (MI) in the human heart, but also provide information related to metabolism would be a useful addition to a comprehensive MR exam of patients with MI (Constantinides et al., [Citation2001]; Sandstede JJ et al., [Citation2001]). Sodium (23Na) Magnetic Resonance (MR) imaging can be used to detect elevated Tissue Sodium Concentration (TSC) in related to loss of cellular integrity or inhibition of the Na+/K+ pump function as a result of energy depletion.
Purpose: To accurately measure TSC in infracted regions in the human heart with 23Na MRI the image intensity should be uniquely depend on the tissue sodium concentration and not on local RF coil sensitivity, or relaxation parameters. We developed and validated an ultra‐short TE twisted projection imaging (TPI) sequence (Boada et al., [Citation1997]), with adiabatic half passage (AHP) excitation, to measure sodium concentrations with RF coils with an inhomogeneous B1 field and used this to measure TSC in the human heart.
Methods: Proton (1H) and 23Na MRI were performed with a broadband GE 1.5 T (Rev 5.8) Signa scanner (General Electric, Milwaukee, WI), a GE carbon (13C) preamplifier module, and a custom‐built 25 × 25 cm square three turn surface coil tuned to the 23Na frequency of 16.9 MHz. Three 15 ml tubes with 100 mM NaCl in 2% agarose gel doped with CuSO4 were built into the coil as coil sensitivity references for quantification. A 23Na TPI MRI pulse sequence (Boada et al., [Citation1997]) was programmed with a 400 µs tanh/tan modulated 90° AHP excitation pulse (Garwood and Ke, [Citation1991]), replacing the hard pulse. All 23Na TPI was performed with TR/TE = 100/0.2 ms, 90° flip angles (2 kW broadband amplifier at maximum power), 6 averages for each of 1240 projections, 12.4 min scan time, and an effective resolution of 0.2 ml isotropic voxel size. Data were reformatted and Fourier transformed to form a 64 × 64 × 64 point three‐dimensional (3D) image with an isotropic 22 cm FOV. 1H MR images were registered to match the 23Na images (see ).
Figure 1. Registered axial 1H MRI fast spin echo images (images A and C, TR = IR‐R interval at 62 bpm, echo train length 8, effective TE 17 ms), and axial slices from a 3D 23Na TPI data set of the heart (images B and D, TR/TE = 100/0.17 ms, AHP excitation) of two healthy human volunteers. The 3D 23Na image data were interpolated so that image B and D match the spatial position of image A and C.
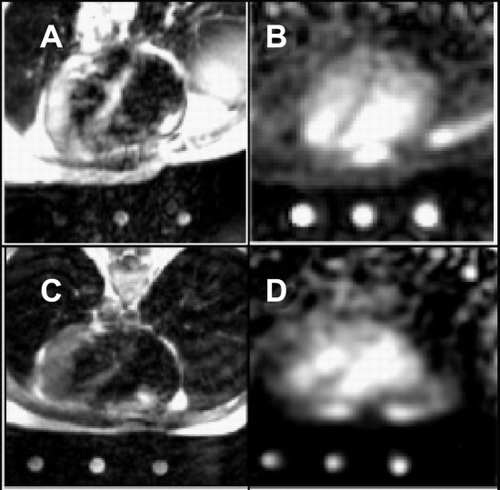
Results: The TSC in ten normal volunteers (age range 24–49, mean 39 ± 8) with a surface coil at 1.5 T. TSC was 40 ± 7, 45 ± 11, 77 ± 15 and 20 ± 6 µMol/g, respectively, in left ventricular wall, septum, blood, and adipose tissue consistent with prior invasive measurements on biopsy and autopsy specimens (ICRP, [Citation1975]).
Conclusions: With this AHP–TPI approach described, we hope to evaluate changes in absolute myocardial TSC in patients with heart disease. The + method is certainly also applicable to other organ/disease systems where surface coils offer the most practical approach to 23Na MRI in a clinical research scanner.
Acknowledgment: This work was funded by NIH grant 1R01‐HL61695.
436. Effects of Normal Aging on LV Responses to Dobutamine
Paul Hees, PhD,1 Jerome Fleg, MD,2 Edward Shapiro, MD.1 1Cardiology, Johns Hopkins University, Baltimore, MD, USA, 2National Heart, Lung, and Blood Institute, National Institutes of Health, Bethesda, MD, USA.
Introduction: Early LV diastolic filling slows markedly with advancing age. This decline is often attributed to slower relaxation. Yet, recent data (Yamakado, [Citation1997]) suggest that the course of LV pressure fall is not influenced by normal aging. The recoil of LV torsion in diastole (recoil rate), assessed using CMRI, provides a valuable, non‐invasive, preload‐independent surrogate for tau, a measure of relaxation. To determine whether age induced changes in filling can be ascribed to changes in relaxation, we determined the responsiveness of both relaxation and filling to beta adrenergic stimulation in young versus elderly adults. Differences between the young and elderly with respect to chronotropic and inotropic responses to beta stimulation were also evaluated.
Methods: 41 normal participants in the Baltimore Longitudinal Study of Aging, median age = 50 yr, were divided into a young group (Y, mean age ± SD = 38 ± 9 yr) and an older group (O, 68 ± 11 yr). Early diastolic filling was evaluated by Doppler echo‐based peak E wave velocity (E, cm/s). Myocardial relaxation was measured by tagged short‐axis cardiac cine MRI‐based recoil rate at baseline and at 3 progressive dobutamine infusion dosages (5, 10, and 20 mcg/kg/min). Relaxation was evaluated from tagged short‐axis cine CMRI‐based recoil rate [% max torsion/ms‐it should be noted that, while recoil rate expressed in degrees/ms is also related to relaxation, this index is preload dependent and therefore not appropriate as a surrogate for tau (Dong, [Citation2001])]. The chronotropic response to dobutamine was observed. The inotropic response was determined as contractility index (CI, systolic BP/end‐systolic LV cavity diameter). Repeated measures ANOVA was used to compare dose responses in Y vs O.
Results: As expected, in the patient group as a whole, there were dose dependent increases in recoil rate by MRI; E wave and CI by echo, and heart rate. Whereas the dobutamine effect on recoil rate was indistinguishable between Y and O, the response of LV filling was different, with E increasing in Y but not O (p < 0.001). The dobutamine effect on heart rate was similar between young and old, but CI increased more in Y than O (p < 0.0001).
Conclusions: Recoil rate, measured as %/ms, yields similar results to those reported using direct micromanometer catheter measures of tau. LV filling reserve is diminished with age, despite preserved responses of myocardial relaxation. These findings suggest, therefore, that age‐related filling differences may reflect altered LA–LV pressure gradient, perhaps due to changes in LA pressure, rather than the rate of LV pressure fall. These findings further suggest that normal aging is accompanied by a blunted inotropic, but not chronotropic, response to steady‐state exogenous β stimulation, and raise the possibility that distinct β1 receptor subtypes modulate these inotropic vs chronotropic responses.
437. Characterization of Regional Left Ventricular Function After Acute Myocardial Infarction Using Systolic and Diastolic Strain Rates Measured by Tagged Magnetic Resonance Imaging
Clerio F. Azevedo,1 Luciano C. Amado, MD,1 Dara L. Kraitchman, VMD, PhD,2 Bernhard L. Gerber, MD, PhD,1 Nael F. Osman, PhD,2 Carlos E. Rochitte, MD,1 Thor Edvardsen, MD, PhD,1 Joao A. C. Lima, MD.1 1Cardiology, Johns Hopkins Hospital, Baltimore, MD, USA, 2Radiology, Johns Hopkins Hospital, Baltimore, MD, USA.
Introduction: Myocardial tagged MRI is currently the non‐invasive gold standard method for regional systolic functional assessment. Myocardial injury after AMI is known to be a regional and heterogeneous process that affects not only systolic, but also diastolic function.
Purpose: Using tagged MRI, we evaluated both regional systolic and, for the first time, regional diastolic function in areas with different degrees of myocardial injury after reperfused AMI and assessed the hypothesis that both measures combined would allow us to better characterize and distinguish these regions.
Methods: Fourteen dogs underwent 90‐min coronary artery occlusion followed by reperfusion. Five short‐axis slices were acquired for each dog within the first 24 h of reperfusion using 3 different MRI techniques. Tagged MRI was used for regional functional assessment. The presence of microvascular obstruction was determined from first‐pass perfusion images and delayed–enhancement (DE) imaging was used for AMI delineation. Regional blood flow < 50% of remote by radioactive microspheres during coronary artery occlusion was used to define risk region. Each slice was divided in 6 segments that were classified into 4 categories: extensive AMI (DE > 50% area, n = 95), subendocardial AMI (DE < 50% area, n = 82), risk region (n = 80) and remote area (n = 163). For each segment, circumferential systolic strain (Ecc), systolic strain rate (SSr) and early diastolic strain rate (DSr) were calculated.
Results: Peak Ecc and peak SSr could be measured in 391 (93%) of 420 segments, and peak DSr could be calculated in 339 (81%) of all 420 segments. Both extensive and subendocardial AMI segments had decreased Ecc (− 2.5 ± 0.5% and − 6.0 ± 0.6% versus − 13.1 ± 0.5%, P < 0.001), SSr (− 0.11 ± 0.10 s− 1 and − 0.82 ± 0.12 s− 1 versus − 2.15 ± 0.08 s− 1, P < 0.001) and DSr (1.26 ± 0.09 s− 1 and 1.50 ± 0.08 s− 1 versus 2.99 ± 0.10 s− 1, P < 0.001) compared to remote. Moreover, extensive myocardial infarction segments displayed even more depressed Ecc and SSr than segments with subendocardial infarction (P < 0.01). In contrast, risk region segments only exhibited diastolic impairment (DSr = 1.62 ± 0.09 s− 1, P < 0.001 versus remote), but not systolic dysfunction (Ecc = − 12.1 ± 0.6% and SSr = − 2.05 ± 0.12 s− 1, NS versus remote). Among AMI segments, the presence of microvascular obstruction was related to decreased systolic (–2.5 ± 0.5% versus − 5.7 ± 0.6% for Ecc, P = 0.01 and − 0.07 ± 0.10 s− 1 versus − 0.79 ± 0.12 s− 1 for SSr, P = 0.02) and diastolic (1.19 ± 0.09 s− 1 versus 1.54 ± 0.08 s− 1, P = 0.01) regional function, even after controlling for infarct extension. Interobserver and intraobserver variabilities (bias ± 2SD) for Ecc (− 0.1 ± 6.6% and − 0.5 ± 5.3%, respectively), SSr (− 0.12 ± 1.21 s− 1 and − 0.04 ± 1.18 s− 1, respectively) and DSr (0.10 ± 1.13 s− 1 and 0.13 ± 1.04 s− 1, respectively) were quite consistent.
Conclusions: This study demonstrates that regional diastolic function can be quantified by strain rate analysis using tagged magnetic resonance imaging. Moreover, the combination of regional diastolic function assessment with the already widely used regional systolic evaluation, provides for superior characterization and distinction of regions with different degrees of myocardial injury after AMI.
438. Whole‐Heart Coronary MRA Using High SENSE Factors
Oliver M. Weber, PhD, Alastair J. Martin, PhD, Charles B. Higgins, MD. Department of Radiology, University of California, San Francisco, San Francisco, CA, USA.
Introduction: Whole‐heart coronary magnetic resonance angiography (MRA) has been shown to be a valuable alternative to a series of individual volumes, each one targeting a different coronary artery in a separate scan (Weber et al., [Citation2003]). In a scan time comparable to the time needed for two targeted volume scans, all the coronary vessels were imaged with similar image quality, but improved coronary coverage and with easier setup. However, with resulting scan times of more than ten minutes, the method is susceptible to patient motion and respiratory drift. Use of higher reduction factors in combination with parallel imaging techniques (such as sensitivity encoding, SENSE) can considerably reduce scan times. Due to the high number of slices and the considerable slab thickness, the whole‐heart approach seems especially well suited for higher SENSE factors by using 2D‐SENSE (combining parallel imaging in phase‐encoding and slice‐selective directions).
Purpose: The goal of this work was to explore 2D‐SENSE with high acceleration factors in whole‐heart coronary MRA.
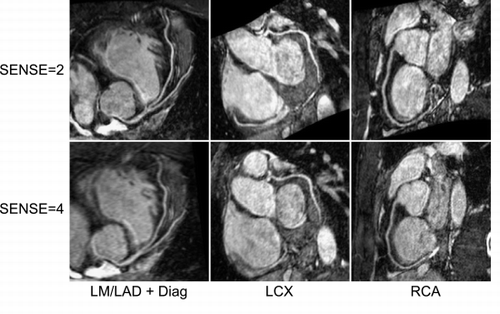
Methods: Experiments were performed on a 1.5 T Intera I/T system (Philips Medical Systems, Best, the Netherlands) with a 5‐element cardiac synergy coil. Six normal volunteers (all male; mean age, 33.2 ± 3.2 years) were enrolled in the study. A steady‐state free precession (SSFP) sequence was used to acquire 50 heartphases of a four‐chamber view during a single breathhold. On this cine data set, the optimal diastolic acquisition window for subsequent high‐resolution coronary scans was visually determined. Two magnetization‐prepared (T2‐preparation pulse, fat saturation pulse), free‐breathing, SSFP whole‐heart acquisitions were performed: 1) An axial volume, consisting of 140 slices, slice thickness 0.75 mm, SENSE = 2 in phase‐encoding (anterior–posterior) direction (Weber et al., [Citation2003]); and 2) a sagittal volume, consisting of 140 slices, slice thickness 1.0 mm, SENSE = 2 in phase‐encoding (anterior–posterior) direction, and SENSE = 2 in slice‐selective (left–right) direction, resulting in a total 2D‐SENSE factor of 4. The increased slice thickness was chosen to compensate for signal‐to‐noise‐losses due to larger degree of undersampling. Further imaging parameters were TR, 5.3 ms; TE, 2.6 ms; TFE factor, 25; acquisition window, 132 ms; in‐plane resolution, 1 × 1 mm2.
Resulting data sets were reformatted along the left main (LM)/left anterior descending (LAD), the left circumflex (LCX), and the right coronary artery (RCA). Vessel length, vessel sharpness, and vessel diameter were determined in the previously described SoapBubble tool (Etienne et al., [Citation2002]). Signal‐to‐noise ratios (SNR) were determined in the ascending aorta. The two approaches were compared using a Wilcoxon matched‐pairs signed‐ranks test with a significance level of 5%.
Results: Imaging was successful in all subjects. The sagittal (SENSE = 4) approach resulted in slightly, but not significantly smaller mean visible vessel length (LM/LAD, − 12%; LCX, − 18%; RCA, − 4%). Similarly, mean vessel sharpness was slightly, but only for RCA significantly, reduced (LM/LAD, − 8%; LCX, − 3%; RCA, − 8%, p = 0.05), and was > 0.40 for all vessels. Vessel diameter was virtually unchanged (± 0.1 mm), whereas SNR was non‐significantly increased by 10%. Mean acquisition time was significantly reduced by 52% (SENSE = 4, 6:23 ± 1:06 min; SENSE = 2, 13:23 ± 2:43 min), with a mean navigator efficiency of 52% ().
Conclusions: A coronary MRA approach has been shown that allows whole‐heart coverage in less than 7 minutes. It requires thus virtually identical acquisition duration as a conventional targeted approach covering only a single vessel. The thick volume is ideally suited for SENSE‐acceleration in slice‐selective direction, which allows the use of 2D‐SENSE to further shorten acquisition time without severe penalty in SNR. Minor reduction in through‐plane resolution might be responsible for a small decrease in vessel sharpness and visible vessel length, as well as a slight increase in SNR. Overall, both approaches provided similarly good image quality.
439. Intracellular Sodium MRI in Chronic Myocardial Infarction
Maurits A. Jansen, PhD, Marcel G. J. Nederhoff, MSc, Cees J. A. van Echteld, PhD. Cardio‐MR Laboratory, Heart Lung Center Utrecht, University Medical Center, Utrecht, Netherlands.
Introduction: The very early rise in intracellular sodium (Na+i) during ischemia makes it a very sensitive indicator of ischemia. Reperfusion of viable myocardium causes an immediate decrease in Na+i, which makes Na+i also a very sensitive indicator of myocardial viability. Following acute ischemia and reperfusion, increased total sodium magnetic resonance (MR) image intensity was shown to be associated with non‐viable tissue (Kim et al., [Citation1997]). For proper interpretation and differentiation between acute infarcts, chronic infarcts and edema, imaging of both intra‐ and extracellular Na+ is essential. Recently, we have shown that 23Na–MR chemical shift imaging (i.e., imaging of intra‐ and extracellular sodium) is superior to total sodium imaging in identifying the affected zone during acute zero and low flow conditions (Jansen and van Echteld, [Citation2002]; Van Emous et al., [Citation2001]).
Purpose: The purpose of this study was to test the value of intra‐ and extracellular sodium imaging in a rat model of chronic myocardial infarction.
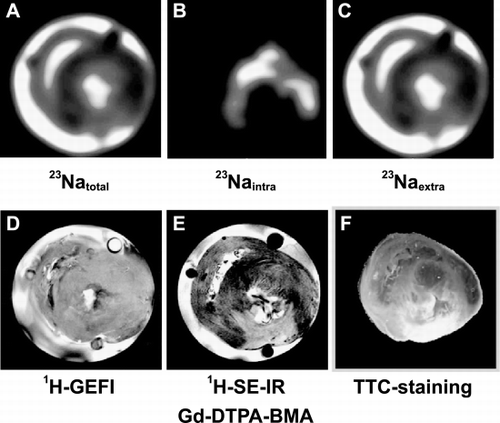
Methods: Rats were subjected to left anterior descending coronary artery (LAD)‐ligation (n = 4) or sham operation (n = 4). Three weeks after ligation, when scar formation is complete, the heart was excised and perfused according to Langendorff at 37°C and 76 mmHg while stimulated at 5 Hz. MR‐images were acquired using a Bruker AVANCE 400 spectrometer. 1H‐Gradient echo images were acquired to serve as anatomical references. To separate the intra‐ and extracellular sodium resonance, the shift reagent TmDOTP5 − (3.5 mM) was included in the perfusate. Acquisition‐weighted 23Na chemical shift imaging (CSI) (16 × 16, FOV 20 × 20 cm, slice thickness 5 mm, nominal voxel size 7.8 µl, time/scan: 4 min) was performed. When 23Na‐measurements were completed, Gadolinium–DTPA–BMA (1.3 mM) was included in the perfusate and TmDOTP5 − was removed. After 10 min a 1H spin echo inversion recovery image was acquired. At the end of the protocol, hearts were cut into slices and stained with 1% triphenyltetrazolium chloride.
Results: Total, intracellular and extracellular 23Na–CS‐images of an isolated rat heart 3 weeks after LAD‐ligation are shown in panels A, B and C, respectively. Signal‐to‐noise was high enough to distinguish intracellular Na+ in normal myocardium of sham rats. Extracellular 23Na‐image intensity of the infarcted area (expressed as percentage of buffer intensity) was significantly increased compared to the surrounding tissue, 53 ± 10% vs. 39 ± 6.6%, respectively, probably because of increased extracellular space in scar tissue compared to healthy myocardium. Intracellular 23Na‐images of MI‐hearts showed decreased intensity in the infarcted area compared to the surrounding tissue: 1.2 ± 0.1 vs. 0.7 ± 0.07% (P < 0.05), respectively. Non‐infarcted areas showed intra‐ and extracellular 23Na‐intensities comparable to sham hearts. The 1H‐gradient echo image of the MI heart (panel D) does not show any abnormalities, but the Gadolinium‐image (panel E) clearly shows a region with enhanced signal. The unstained area on the TTC‐image (panel F) corresponds well with the area with enhanced signal intensity on the Gadolinium‐image as well as the area with lack of signal on the intracellular 23Na image ().
Conclusion: These data demonstrate that intracellular 23Na‐imaging can be used to distinguish viable from scar tissue in infarcted rat hearts and is a promising new tool for assessment of myocardial viability.
440. Enhanced MRI Interface for Vascular Interventions
Daniel R. Elgort,1 Matt Mendez,2 Wacker K. Wacker,2 Jonathan S. Lewin,2 Jeffrey L. Duerk.2 1Biomedical Engineering, Case Western Reserve University, Cleveland, OH, USA, 2Department of Radiology, University Hospitals of Cleveland and Case Western Reserve University, Cleveland, OH, USA.
Introduction: The interface on most MR scanners is not well suited for interventional procedures. Current interventional MR designs provide the physician with either real‐time 2D images, which often make it difficult to determine the position of the catheter within the overall vascular tree, or a 3D roadmap, which is acquired prior to the intervention and quickly becomes out of date due to patient movement. The interface on most MR scanners also makes changing sequence parameters during the procedure a cumbersome process. The goal of this study was to develop and test an interventional user interface that allows real‐time guidance of the catheter position with both real time imaging that is adapted to the catheter position as well as graphical representation of its position in an angiogram to facilitate an anatomical overview. Further, this interface allows the interventionalist to adjust imaging parameters during the procedure simply by controlling the speed of the catheter; no interaction with a keyboard or mouse is required.
Purpose: To create an effective MR interface that permits physician‐directed interventional vascular procedures. To facilitate MR‐guided cardiovascular interventions, the interface must clearly display real‐time 2D images that follow an interventional device, 3D image volumes that indicate the catheter or other device's location within the vascular anatomy, and cross‐sectional images of the vessel wall. The interface must also eliminate the need to pause in order to alter pulse sequence parameters during interventions.
Methods: Two image data windows were incorporated into the scanner's (1.5 T Siemens Sonata) standard user interface. The first displays 2D images that follow the position and orientation of the catheter; it updates at 3 Hz. The second displays a 3D angiogram that can be freely rotated during the intervention with an overlay that updates once per second to show the current location of the catheter within the anatomy (). These displays are made possible by using an active catheter tracking system that determines the position and orientation of the catheter prior to the acquisition of each image frame.
Figure 1. Screenshot of interventional interface. (View this art in color at www.dekker.com.)
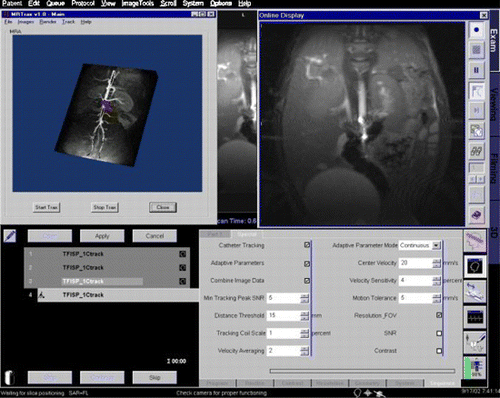
Imaging parameters are adjusted automatically during the procedure via ICE/IDEA code that relates changes in catheter speed to real‐time changes in image FOV, resolution, or other scan parameters. One mode automatically switches to a cross‐sectional view of the vessel wall when the catheter is stationary. Tracking data from multiple time points are used to calculate the catheter's speed. The system is configurable, including which image parameters are to be adjusted, via the standard user interface. The interface uses only standard system hardware with the exception of two small, tracking markers that are affixed to the catheter tip. To evaluate the utility of this interface, vessel phantoms and eight in‐vivo porcine imaging experiments (approved by our institutions IACUC) were performed in which a catheter was advanced through the pig's abdominal aorta to the renal arteries.
Results: The software was able to consistently and accurately localize the catheter. Real‐time images were placed within 2 mm of the fiducial markers 98% of the time while 3D MIP reference map accurately reflected the catheter position within the vasculature. Interventionalists were able to change image resolution and FOV in real‐time by controlling the catheter's insertion speed. The system allowed exact stent deployments in the renal arteries of two pigs.
Conclusions: This interface facilitates interventional procedures by providing access to real‐time image data and by automatically adjusting imaging parameters in response to changes in the catheter's position, orientation and insertion speed. Though individual components of this system may not be entirely novel, the level of integration between them represents a significant advance in achieving a truly dedicated cardiovascular interventional MRI system.
441. Quantitative Assessment of Myocardial Perfusion by MR Imaging of D2O‐Uptake and by High‐Resolution, Voxel‐by‐Voxel Analysis of Gd Inflow
Ulrich K. M. Decking,1 Han Wen,2 Vinay Pai,2 Eric Bennet,2 Joni Taylor,2 Robert S. Balaban.2 1Cardiovascular Physiology, Heinrich‐Heine‐University, Duesseldorf, Germany, 2Lab. Cardiac Energetics, NHLBI, NIH, Bethesda, MD, USA.
Introduction: At higher spatial resolution, local heterogeneities in myocardial perfusion become apparent, e.g. in microsphere (MS) flow measurements. When assessing local perfusion by MR imaging, contrast‐enhanced (Gd) MRI offers spatial resolution, but the Gd‐inflow induced changes do not lend themselves to flow quantification. Due to the high membrane permeability for H2O and the rapid exchange of H2O and D2O, D2O might be an ideal marker of local flow. However, the changes in proton signal upon D2O infusion will be limited.
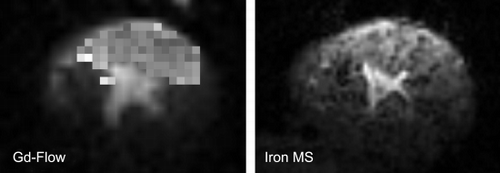
Purpose: We have quantitatively assessed myocardial perfusion based on D2O‐induced changes in image intensity, combined with a high resolution, contrast‐enhanced analysis of spatial flow distribution. This was compared to the spatial heterogeneity of MS deposition imaged by in vivo MR of iron oxide microspheres.
Methods: In anaesthetized open‐chest beagle dogs, coronary sinus catheterization enabled the determination of D2O extraction. For MR imaging, in a clinical 1.5 T scanner (Sonata, Siemens) a surface coil was employed to enhance sensitivity. Atrial pacing (120 bpm) and ventilation (60 min− 1) were phase‐locked for accurate voxel localization throughout time. The decrease in local H2O content during left atrial D2O infusion (100 mL/min D2O‐tyrode solution, pH 7.4) was imaged using a Turbo–Flash sequence at a 23 mm3 voxel size in a single slice. For first‐pass contrast‐enhanced MRI (Gd‐DTPA, 0.15 mmol/kg), a saturation recovery TFL sequence was employed. Following left atrial iron oxide and fluorescent MS (IMS and FMS) application (106/kg), IMS deposition was imaged by a T2*—weighted 2D GRE sequence.
Results: Infusion of D2O‐tyrode into the left atrium (100 ml/min for 40 s), resulted in a steady arterial D2O concentration of 9.1 ± 1.5% (n = 14), indicating a cardiac output of 1.13 ± 0.17 L/min. D2O extraction was initially complete (> 98%) and decreased slowly, being on average 84% within the first 30 s (n = 6). Averaging 20 time points reduced the measurement error < 1%. The signal intensity decreased during 30 s D2O by 4.8 ± 1.6% (n = 6), corresponding to an average myocardial perfusion of 1.21 ± 0.48 ml/min/g. Myocardial blood flow as assessed by FMS was virtually identical (1.2 ± 0.5 ml/min/g) and no systematic bias was seen in a Bland‐Altman plot. First‐pass inflow of Gd more than doubled the myocardial MRI signal within 5 s (+ 120 ± 28%, n = 6), the maximum slope being 35 ± 10%/s. This rise was well correlated to the local flow as assessed by D2O uptake (r2 = 0.82, n = 6). When analyzing 85 voxels/heart, the signal increase varied little between voxels. When taking the basal signal‐to‐noise into account, the coefficient of variation of the maximum slope of these voxels was 21% (at 8 µL). This is small compared to the spatial CV reported for microspheres at much lower resolution (e.g. 33% at 300 µL). Following application of iron oxide MS, clusters of IMS and IMS streaks were seen by in vivo MRI and confirmed ex vivo thereafter. This IMS deposition pattern did not reflect the Gd‐perfusion images obtained in the same hearts ()
Conclusions: 1. MRI of D2O uptake is well suited for a quantitative determination of myocardial perfusion in vivo at 2 mm slice thickness. 2. First pass contrast‐enhanced imaging of myocardial perfusion in a clinical scanner is feasible even at a spatial resolution of 8 µL. 3. Within a myocardial slice, the spatial distribution of plasma flow appears to be much more homogeneous than expected from microsphere deposition patterns and previous measurements. The latter finding may indicate a dissociation of plasma and erythrocyte flow at the arteriolar and capillary level.
442. Automated Quantitative Myocardial Infarct Sizing: In Vivo and Ex Vivo Correlation with Histopathology
Li‐Yueh Hsu, Alex Natanzon, Anthony H. Aletras, Peter Kellman, Andrew E. Arai. National Institutes of Health, Bethesda, MD, USA.
Introduction: Delayed enhancement MRI is useful for detecting myocardial infarction (MI). Human traces of MI size are influenced by display window and level. Computerized algorithms can objectify measurements and minimize operator influences.
Purpose: To validate a new computer algorithm for measuring MI size on delayed enhancement MRI using comparisons with histopathology and human measurements.
Methods: The infarct‐sizing algorithm first analyzed the pixel intensity bimodal distribution from the images after manual segmentation of the epicardium and endocardium. Pixels darker than a threshold determined from the Gaussian distribution of normal myocardial signal intensities (mean + 2SD) were excluded from further analysis. This left aggregates of bright pixels that included infarct, imperfectly excluded pixels of epicardial fat, randomly bright pixels, and artifacts. Next, for each aggregated potential infarct region, selected image features were extracted and classified to remove false positive regions. Finally, a 50% maximum intensity threshold from the brightest infarct region was used to account for partial volume errors. Images of triphenyltetrazolium chloride (TTC) stained myocardium were also segmented automatically. Comparisons with human traces and computerized simple thresholding were also done.
For validation, 10 mongrel dogs were imaged in‐vivo and ex‐vivo approximately 20–30 minutes following administration of Gd‐DTPA (0.2 mmol/kg). MI was induced by a 90 minute LAD occlusion followed by reperfusion. Using Phase Sensitive Inversion Recovery, the spatial resolution of the infarct images was: 1.1 × 1.8 × 8.0 mm in‐vivo and 0.6 × 0.6 × 4.0 mm ex‐vivo. Infarct size was measured as a percentage of left ventricular area.
Results: For validating the new algorithm, automatically determined MI size matched well between TTC and ex‐vivo MRI (y = 0.90x–0.01, R2 = 0.94) and also between TTC and in‐vivo MRI (y = 1.06x + 0.02, R2 = 0.93).However, a simple fixed threshold using mean + 2SD intensity of normal myocardium overestimated MI size.
As a reference, human measurements of MI size for TTC and ex‐vivo MRI matched well (y = 0.98x–0.03, R2 = 0.94). However, human measurements overestimated MI size when in‐vivo MRI was compared with TTC (y = 1.25x + 0.00, R2 = 0.96).
The new algorithm and human MI size measurements matched well for TTC (y = 1.00x–0.01, R2 = 0.99) and ex‐vivo MRI (y = 0.91x–0.01, R2 = 0.98). For in‐vivo MRI, human overestimated MI size (y = 0.83x + 0.01, R2 = 0.96) when compared to the algorithm.
Conclusion: The new algorithm accurately determined MI size on both in‐vivo and ex‐vivo MRI. However, the human observer tended to over‐estimate infarct size on in‐vivo MRI but not on ex‐vivo images, which have 12x smaller pixel volume and reduced partial volume effect.
443. Magnetic Resonance Angiography Detects In‐Stent Thrombosis and Thrombolysis
Min Su Hyon, MD, PhD,1 Hideaki Kaneda, MD,1 Fumiaki Ikeno, MD,1 Krishna Nayak, PhD,2 Alan C. Yeung, MD,1 Michael V. McConnell, MD, MSEE.1 1Cardiovascular Medicine, Stanford University, Stanford, CA, USA, 2Electrical Engineering, Stanford University, Stanford, CA, USA.
Background: In‐stent thrombosis is a rare but life‐threatening complication. Noninvasive visualization of in‐stent thrombus and its response to therapy would be beneficial. We evaluated MR angiography (MRA) sequences for in‐vivo detection of in‐stent thrombosis and for monitoring of thrombolysis in a rabbit model.
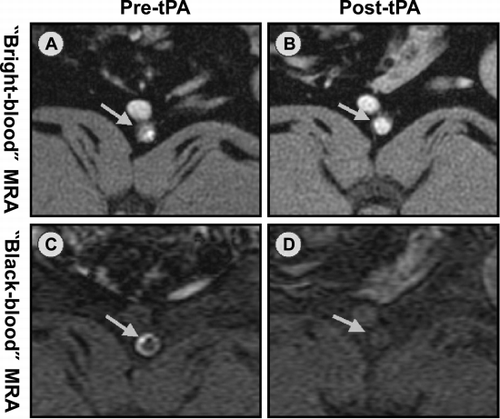
Methods: MRI studies were performed 1–4 days after stent placement in 16 New Zealand White rabbits. Minimal‐artifact copper stents (3.5–4.0 mm × 6–14 mm) were placed in the infra‐renal aorta. The stented aorta was imaged at 1.5 T MRI system (GE, Milwaukee, WI) using: 1) a real‐time MRA sequence (20 cm FOV, 1.1 × 1.1 × 5 mm, 12–30 f/s), 2) a “bright‐blood” coronary MRA sequence (16 cm FOV, 20 interleaves, 0.58 × 0.58 × 3 mm, TR = 1000 ms, TE = 7 ms, flip angle = 60°) and 3) a T1‐weighted 3D “black‐blood” SPGR sequence (N = 3) with saturation slabs (TR 41 ms, TE 4 ms, flip angle = 40°, 10 cm FOV, 0.4 × 0.8 × 1.5 mm). In 2 animals, thrombolysis using tPA (2 mg/kg) was performed under monitoring with MRA. After final imaging the animals were euthanized for confirmation of the thrombi.
Results: All animals developed in‐stent thrombosis detected by MRI at 1–4 days after stenting. Histology confirmed the thrombi. With thrombolysis, there was a substantial decrease in thrombus burden seen at 1–3 hours. Recurrent thrombosis was seen at 24 hours. For the “bright‐blood” MRA sequence, the thrombus appeared as luminal irregularities (). For the “black‐blood” MRA sequence, thrombus appeared as a more extensive ring along the stent as well as extending into the lumen (). A marked decrease in in‐stent thrombosis was demonstrated with both bright‐and black‐blood MRA sequences ().
Conclusions: MRA can detect in‐stent thrombosis and thrombolysis using a minimal‐artifact stent. This is a promising noninvasive approach for studying arterial thrombosis and its response to treatment.
444. Accelerated Tagging for Reproducible HARPing of Stress Data
Salome Ryf,1 Juerg Schwitter,2 Peter Boesiger.1 1Institute for Biomedical Engineering, Zuerich, Switzerland, 2Division of Cardiology, University Hospital, Zuerich, Switzerland.
Introduction: Myocardial tagging is an established method to quantify myocardial motion of healthy and diseased hearts. With HARP (Osman et al., [Citation1999]) a fast and powerful tool has been introduced to evaluate tagging data. HARP tagging was successfully applied in animals to detect ischemia during stress (Kraitchman et al., [Citation2003]). To transfer this into humans, a fast tagging‐imaging technique was developed allowing for short breath‐hold while data quality should allow for semi‐automatic HARP‐analysis.
Purpose: Fast tagging imaging‐techniques were compared with a conventional approach and reproducibility was evaluated under rest and stress conditions.
Materials and Methods: Tagging measurements—The measurements were performed in eight healthy volunteers (three female, age: 28 ± 4 years) on a 1.5 T scanner (Philips Medical Systems, Best, Netherlands). CSPAMM (Fischer et al., [Citation1993]) line tagging was applied in two directions with a tag‐line distance of 8 mm. As a reference, a conventional EPI‐sequence (FOV: 380 mm, RFOV 80%, matrix:128 × 39, EPI‐factor:13) was performed for imaging (Stuber et al., [Citation1999]), which required a breath‐hold of 16 RR‐intervals (4 for EPI‐preparation + 12 for imaging). For the fast measurements, a TFEPI‐sequence (EPI–factor 9, TFE‐factor 4, matrix 128 × 36) was used (Spiegel et al., [Citation1998]), leading to two breath‐holds of 4 RR intervals (preparation and imaging). To avoid possible tag‐line imperfections, a modified TFEPI sequence was used in six subjects. For this scan, a dummy image was acquired during the first RR‐interval to achieve a better steady‐state magnetization leading to a breath‐hold of 5 RR‐intervals. At rest, 18–20 cine frames were acquired with all three sequences at a mid‐ventricular slice. The temporal resolution was 35 ms for the EPI‐scan, 33–38 ms for TFEPI and modTFEPI. After ergometer‐stress, images were acquired with the modified TFEPI‐scan at a heart‐rate of slightly more than 100/min eleven frames were acquired with a temporal resolution of 33–38 ms. All measurements were performed twice to assess reproducibility. HARP evaluation—HARP‐tracking was performed for three ring‐structures placed on the sub‐endocardium, the sub‐epicardium and the mid‐myocardium. The points were selected according to (Schwitter et al., [Citation2000]). The scans were evaluated for inter‐ and intra‐observer reproducibility.
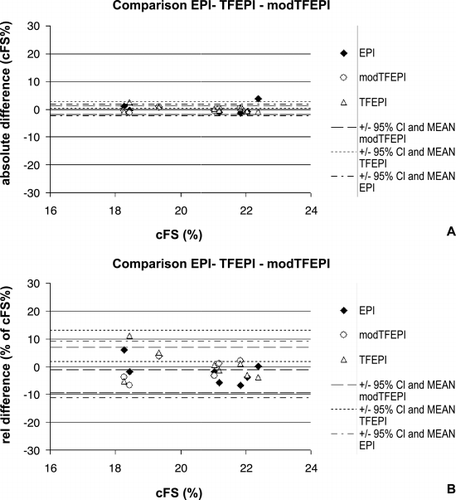
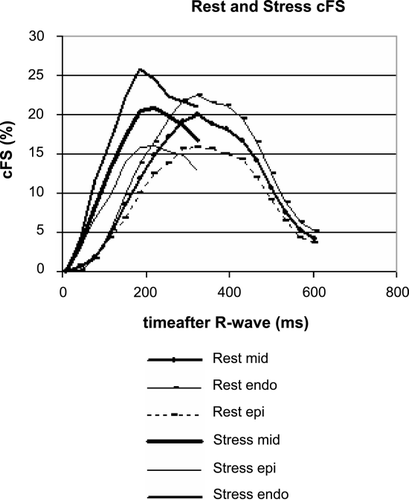
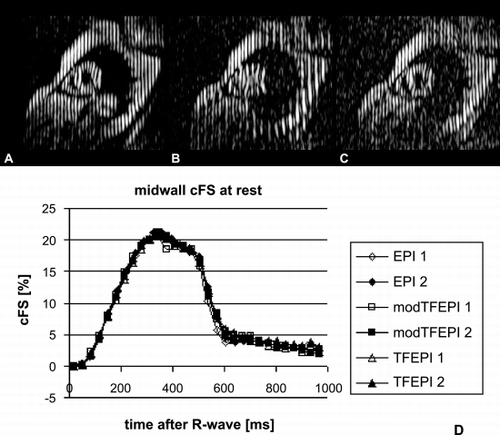
Results: In comparison to the standard of reference (EPI) the fast techniques (TFEPI) showed no significant differences in circumferential fiber shortening (cFS) at the midwall (, ). The agreement in an individual study is shown in . Best reproducibility was achieved with the modified TFEPI scan (). With this scan differences between two consecutive stress studies was small with –0.74% and 0.55% for the same intra‐ and inter‐observer analysis (twelve data‐sets in eight volunteers). However variability of single measurements was high (see 95% CI in ). This HARP analysis provides cFs at different myocardial layers (). shows higher rate of shortening during stress while maximum shortening remains unchanged.
Table 1. The TFEPI and modTFEPI show negligible differences compared to the reference method EPI ranging from − 0.06% to − 0.46%
Table 2. Reproducibility was best for modTFEPI with lowest 95% CI
Figure 1. CSPAMM images acquired with EPI (A), TFEPI (B) and modified TFEPI (C) and corresponding midwall cFS‐time curves (D).
Conclusion: The proposed fast tagging sequences are of sufficient quality for a reproducible and reliable quantification of mid‐wall cFs by HARP. The short acquisition may explain slightly better reproducibility of the modified TFEPI compared to the EPI scan at rest.Breath‐hold times of 3 seconds or less allow for analysis of mechanics in different myocardial layers during stress. For detection of ischemia a regional assessment of cFS is needed which requires further refinement of the technique.
445. Mechanical Restraint Improves Border Zone Function in a Model of Acute Myocardial Infarction
James J. Pilla, Aaron S. Blom, John Affuso, Victor A. Ferrari, Joseph H. Gorman, III, Robert C. Gorman, Michael A. Acker. University of Pennsylvania, Philadelphia, PA, USA.
Introduction: Acute myocardial infarction (MI), if untreated, is characterized by LV dilatation and dysfunction.Mechanical restraint has been postulated to limit post‐MI remodeling and to affect a degree of reverse remodeling.
Purpose: The objective of this study was to investigate a passive mechanical restraint and examine infarct border zone (BZ) function post‐MI.
Methods: MI was created in eight Dorset sheep by ligating the LAD diagonal arteries. Following ligation, MRI compatible markers were placed at the border of the infarct. At one‐week post‐infarct, the animals were randomized to cardiac support device (CSD, Acorn Cardiovascular) or control. Tissue‐tagged MR imaging was performed on both groups at one‐week and three‐months post‐MI. The images were analyzed to determine BZ function by examining the non‐infarcted region adjacent to the markers.
Results: At three‐months post‐MI BZ maximum principal strain and displacement were greater in the CSD group compared to the control (1.134 ± 0.0075 vs. 1.074 ± 0.0107 and 1.594 ± 0.734 mm vs. 1.284 ± 0.899 mm, respectively, both p < 0.05). In addition, there was decreased myocardial thinning of the CSD BZ when compared to the control (11.6 ± 0.55 mm vs. 9.1 ± 0.016 mm, p < 0.05). Comparing one‐week to three months, the controls had no change in maximum principal strain while the CSD group demonstrated a significant improvement in BZ strain (Control: 1.072 ± 0.006 vs. 1.074 ± 0.01 p = 0.885, CSD: 1.095 ± 0.007 vs. 1.134 ± 0.0075, p < 0.05).
Conclusions: The results of this study demonstrate that mechanical restraint post‐MI results in an improvement in BZ function. These findings may be attributed to an “off loading” of myocardial wall stress by the CSD which may result in a stimulus for reverse remodeling of the BZ.
446. The Detailed Motion of Coronary Arteries and It's Modeling
Ryuichi Yoneyama, M.D. Ph.D.,1 Ehud J. Schmidt,2 Motoya Hayase.1 1Cardiology, Massachusetts General Hospital, Boston, MA, USA, 2GE Medical Systems ASL, Boston, MA, USA.
Introduction: During cardiac cycle, each coronary artery moves in different fashions. Understanding of the characteristics of these motions is important, as they are the main cause of difficulties of coronary artery imaging by MRI. Using MR tracking catheter, detailed analysis of 3D motions of the coronary artery are performed. This analysis may provide a model to correct motion artifacts both in prospective and retrospective way.
Purpose: To reveal characteristics of the 3D motion of each coronary artery of different part.
Methods: MR tracking catheters (135 cm length, 1.5–2.3 mm diameter), consisting of three tracking coils spaced 2.5 mm apart are placed into the right coronary artery (RCA), the left anterior descending coronary artery (LAD) and the left circumflex coronary artery (LCX) of 5 swine under the guidance of X‐ray fluoroscopy. ECG‐gated 3D motional data were acquired during 20–30 s breath holds at 3 different position of each coronary artery by the three tracking coils in a 1.5 T GE CV/i MRI scanner (GE Medical Systems, WI, USA). The data were analyzed using Mathlab(The MathWorks, Inc. MI, USA). The analysis involved averaging over cardiac beats having same R–R intervals. The characteristics of both 3D translational and rotational motion were revealed.
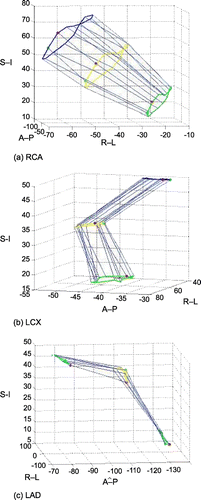
Results: Of all three vessels, RCA moved most and was followed by LCX and LAD. The velocity curves of all three vessels showed the relatively steady phase at the end systolic and mid diastolic (), which were appropriate for ECG‐gating. This result was corresponding to that of 2D analysis of human coronary arteries (Lu et al., [Citation2001]). RCA moved in a twisted trajectory, while LCX moved more circular fashion. LAD, which was bedded on the septum, moved almost parallel to the artery itself ().
Figure 1. The velocity of the distel point (5 cm away from the osteum) of RCA. Shaded area represents the phase of relatively slow velocity. (View this art in color at www.dekker.com.)
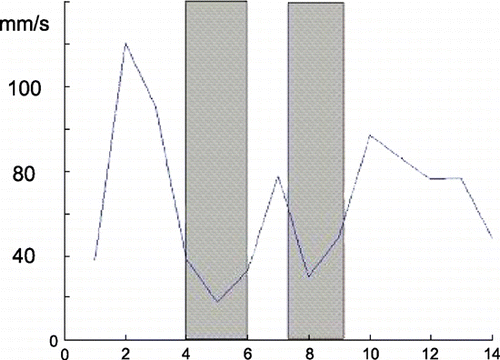
Figure 2. Trajectory of three vessels. (a) RCA, (b) LCX, (c) LAD. Blue, yellow and green circle represents the motion of the coil at 2.5 cm, 5.0 cm and 7.5 cm away from the aortic root respectively. Red dots represents the first phase of cardiac cycle and green one the last. (View this art in color at www.dekker.com.)
Conclusions: The characteristics of the 3D motion of each coronary artery of different part were revealed.
447. Quantitation of Atherosclerosis in a Minipig Model with MRI and Dynamic Contours
Örjan Smedby, Dr. Med. Sci.,1 Mattias Ragnehed, M. Sc.,1 Anders Knutsson, M. D.,1 Leif Jacobsson, Dr. Med. Sci.,2 Ximing Yuan, Dr. Med. Sci.,3 Rolf Andersson, Dr. Med. Sci.2 1Department of Radiology, Linköping Univ., Linköping, Sweden, 2Department of Pharmacology, Linköping Univ., Linköping, Sweden, 3Department of Pathology, Linköping Univ., Linköping, Sweden.
Introduction: Animal models are widely used in atherosclerosis research. One of the models most closely resembling human atherosclerosis is the cholesterol‐fed minipig. If the same individual can be studied on several occasions with an in vivo method, the number of animals needed for a given statistical power will be smaller. MRI is a promising technique for such studies.
Purpose: The aim of this study was to test the feasibility of obtaining quantitative measures of atherosclerosis in cholesterol‐fed minipigs by measuring the mean wall thickness in MR images with modern image analysis methods.
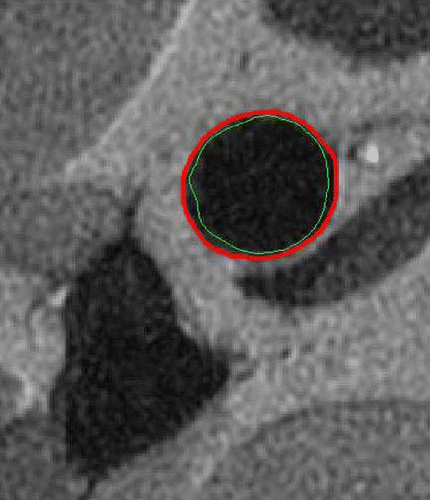
Methods: Fourteen minipigs, nine of which had received atherogenic diet, were examined in a 1.5 T scanner (GE Signa) using a torso coil. Two sequences were applied to examine the abdominal aorta: proton‐density‐weighted spin‐echo (PDW) and 2D inflow angiography (TOF). With each sequence, 48 axial slices were acquired with a slice thickness of 3 mm and an in‐plane voxel size of 0.2 mm. The inner boundary of the aortic wall was identified in the TOF images, and the outer boundary in the PDW images, in both cases using a Gradient Vector Flow “snakes” algorithm, where dynamic contours are deformed by image forces determined by edge information in the image and by internal forces reflecting the shape of the “snake.” The operator made a coarse initialization of the contour and interacted with the semiautomatic algorithm when needed. An example of the two resulting snakes superimposed on the PDW image is seen below. From the cross‐sectional area and the circumference of the cross section or the aorta, the mean wall thickness was calculated for each slice. After the examination, the animals were sacrificed, the aorta was sectioned in the transaxial direction, and microscopic estimates of the cross‐sectional area and mean wall thickness were obtained each 18 mm.
Results: The mean wall thickness measured with MRI was 0.73 mm, and post‐mortem, 0.82 mm. The 95% limits of agreement (according to Bland & Altman) were –0.16 mm and –0.02 mm. Both with MRI and with histopathology, wall thickness values were significantly smaller with increasing distance from the aortic bifurcation (both p < 0.01; linear regression) ().
Conclusions: With the proposed image analysis method, MRI measurements of aortic wall thickness are feasible in a minipig model of atherosclerosis. Although the same anatomic pattern was found with both methods, the MRI values were systematically lower than corresponding post‐mortem measurements. It remains to explain this finding, as well as to assess the utility of the method in atherosclerosis research.
448. MRI of Targeted Catheter‐Based Implantation of Myogenic Precursor Cells into Infarcted Left Ventricular Myocardium
Jerome Garot,1 Thierry Unterseeh,1 Stephane Champagne,1 Emmanuel Teiger,1 Benedicte Chazaud,2 Romain Gherardi,2 Luc Hittinger,1 Pascal Gueret,1 Alain Rahmouni.3 1Cardiology, Henri Mondor University Hospital, Creteil, France, 2Pathology, Henri Mondor University Hospital, Creteil, France, 3Radiology, Henri Mondor University Hospital, Creteil, France.
Introduction: In vivo noninvasive imaging of targeted catheter‐based implantation of myogenic precursor cells (MPC) into infarcted left ventricular (LV) myocardium is unavailable.
Purpose: To test the hypothesis that cardiac MRI is an effective tool for in vivo imaging of MPC previously loaded with iron oxide nanoparticles and implanted into normal and infarcted myocardium in the pig.
Methods: The study was conducted in 7 farm pigs (4 with anterior myocardial infarction), in which autologous MPC were injected through a percutaneous catheter allowing for LV electromechanical mapping and guided transendocardial micro‐injections into normal and infarcted myocardium. Cardiac magnetic resonance imaging (MRI) was used to detect implanted MPC previously loaded with iron oxide nanoparticles. MRI data were compared with LV electromechanical mapping and cross‐registered pathology (hematoxylin eosine and TTC stain).
Results: All 9 injections into normal and 12 injections into locally damaged myocardium were detected on T2‐weighted spin echo and inversion‐recovery true‐fisp MRI (low signal areas) with good anatomical concordance with sites of implantation on electromechanical maps. All sites of injection were confirmed on pathology that showed in all infarct animals iron‐loaded MPC at the center and periphery of the infarct as expected from MRI.
Conclusions: Targeted catheter‐based implantation of iron‐loaded myogenic precursor cells into locally infarcted LV myocardium is accurate and can be reliably demonstrated in vivo by cardiac MRI. The ability to identify noninvasively intramyocardial cell implantation may be determinant for future experimental studies designed to analyze subsequent effects of such therapy on detailed segmental LV function.
449. Improving Correlation Between Diaphragm Motion and Bulk Cardiac Motion Using a RaMP Approach
Vinay M. Pai,1 Maryann Mikhail,2 Leon Axel,1 Han Wen.3 1Radiology, New York University School of Medicine, New York, NY, USA, 2New York University School of Medicine, New York, NY, USA, 3Laboratory of Cardiac Energetics, National Heart, Lung and Blood Institute, National Institutes of Health, Bethesda, MD, USA.
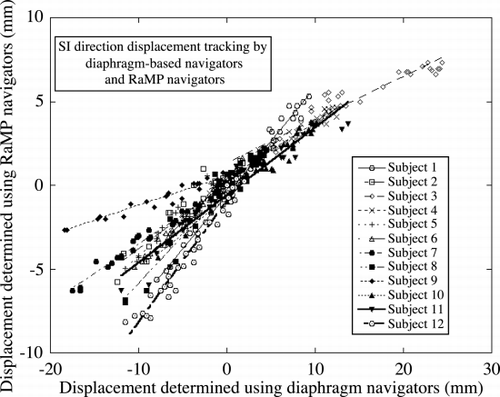
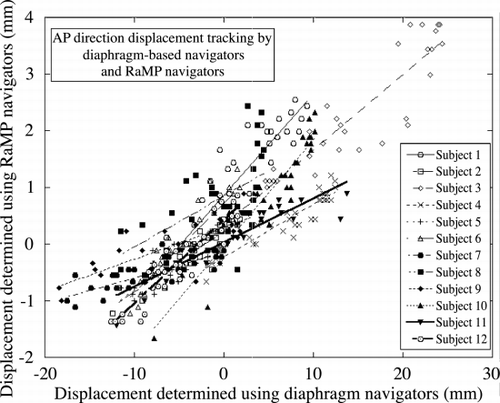
Introduction: Diaphragm‐based navigators are techniques that enable nonbreathhold cardiac imaging. In this approach, the motion of the diaphragm is tracked, and subsequently a scaling factor, typically 0.6, is applied to this motion to estimate the global translation of the heart in the superior‐inferior (SI) direction (Wang et al., [Citation1995]). However, recent studies have suggested considerable variations in the scaling factor between individuals (Nagel et al., [Citation1999]; Nehrke et al., [Citation2001]), which would necessitate determining these factors for each patient. Recently, Rapid–Motion–Perception (RaMP) has been presented as an alternative navigator approach, in which the fast‐flowing blood volume in the heart is tracked during the cardiac cycle (Pai et al., [Citation2003]). The profile of this blood volume can be obtained by a complex difference analysis of one‐dimensional flow‐sensitized data through the application of velocity‐encoding bipolar gradients during the navigator. In this abstract, we present an approach where the RaMP navigators were played in conjunction with the diaphragm‐based navigators, and used to determine the motion scaling factors. Imaging scans played in conjunction with the navigators were used to determine the efficacy of using RaMP navigators to determine these factors.
Purpose: To develop a method for enabling patient‐specific correlation between the diaphragm motion and the bulk motion of the heart, for navigator‐guided cardiac imaging.
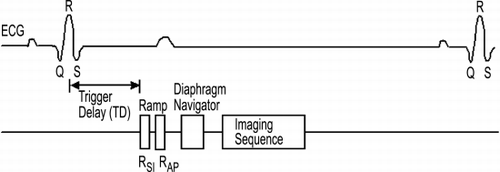
Methods: As shown in , the MR sequence consisted of an ECG‐gated combination of RaMP navigators (R) and diaphragm‐based 90–180 navigators (D), followed by the imaging scan (I). The sequence implementation on a Siemens Sonata 1.5 T scanner used the following parameters for the various sections (R/D/I): TR: 8/25/3.8 ms, TE: 3.5/15/1.4 ms, flip angle: 10/90–180/30, FOV: 340 × 340 mm and matrix of 256 × 128. The imaging scan acquired n (= phase‐encode resolution/number of repetitions) lines of k‐space during each cardiac interval. The experiment was performed over 32 repetitions, yielding 4 lines of image data for each navigator data point. Since the RaMP signal is a function of the blood velocity, the delay (TD) between the R‐wave and the RaMP application was set to mid‐systole. Twelve healthy subjects (7 males, 5 females) were scanned within institutional human subject research guidelines.
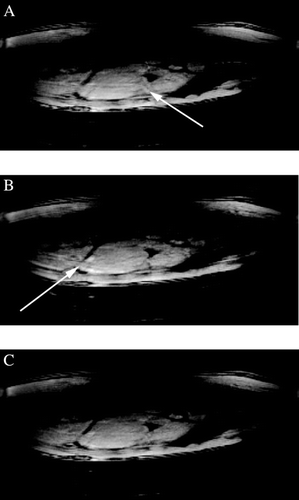
Results: Motion in both SI and anterior–posterior (AP) directions were tracked under free‐breathing conditions for 32 cardiac cycles. The navigator data were analyzed as previously described (Nagel et al., [Citation1999]). shows the correlation between the SI displacement determined by the RaMP navigators and that by the diaphragm‐based navigator. shows the corresponding correlation plots for the displacement in the AP direction. The correlation between the diaphragm and the heart motion can be seen to be variable across the volunteer population considered. There is a wider range of variation in the SI direction, and lesser in the AP direction, probably due to the relatively lesser motion in the AP direction. The displacement correlation ranged between 0.17 and 0.72 (mean: 0.44, SD: 0.15) in the SI direction, and 0.05 and 0.19 (mean: 0.12, SD: 0.05) in the AP direction. shows the images (A:uncorrected, B:corrected with 0.61(SI) and 0.12 (AP) scaling, and C:corrected with RaMP‐based scaling) obtained for a representative volunteer. The imaging scan shows improvement in the image quality by use of the RaMP‐derived scaling factors. The arrows indicate blurring at the base and the apex, which are minimized in Figure .
Figure 4. Reduction of image artifacts. A: Uncorrected, B: Corrected using diaphragm‐based scaling factors, C: Corrected using RaMP‐based scaling factors.
Conclusions: RaMP navigators may be useful for improving the correlation between the diaphragm motion and the bulk motion of the heart for diaphragm‐based navigators.
450. Clinical Research in MRI: A Nursing Perspective
Debra Dees, RN,1 Brenda Lambert, RN,2 Raja Muthupillai,3 Scott D. Flamm, MD.4 1Radiology, St. Lukes Episcopal Hospital, Houston, TX, USA, 2Radiology, St. Lukes Episcopal Hospital, Houston, TX, Houston, TX, USA, 3Clinical Science, and Radiology, Philips Medical Systems and Baylor College of Medicine, Houston, TX, USA, 4Cardiology and Radiology, St. Lukes Episcopal Hospital, Houston, TX, USA.
Introduction: Three main trends are promoting the use of MRI as an important tool for basic and clinical cardiovascular research. First, developments in MRI have made it the modality of choice in some areas as a result of its high accuracy and reproducibility (Longmore et al., [Citation1985]; Rehr et al., [Citation1985]). For example, it has been shown that in a direct comparison of cardiac MRI with echocardiography for reproducibility, the sample size for 2D echo would be 505 patients and only 14 patients using cardiac MRI, to achieve the same p‐value (0.05), and statistical power (80 percent) (Bellenger et al., [Citation2000]). This has tremendous impact on designing cost and time effective drug trials. Secondly, with on‐going advances in molecular and gene biology in recent years, there is an increasing need for non‐invasive imaging modalities such as MRI to evaluate the efficacy of potential therapies at systemic levels, e.g, the effect of angiogenic growth factors on myocardial perfusion. In addition, as an immature, evolving imaging modality, new contrast agents are continually developed to further exploit the myriad contrast mechanisms through which MRI signal may be manipulated.
Purpose: To describe the key components for developing an active research environment that can support multiple human trials and multi‐center studies based on four years of experience as a CVMRI research nurse in a hospital (600 bed) setting.
Key Components of a CVMRI Clinical Research Center
A: Resources:
Physical Resources: Protected research time on the magnet; state‐of‐the art MRI scanner; peripheral equipments such as power injectors, infusion pumps, and monitoring devices; post‐processing workstations; and network access for data transfer.
Personnel Resources: CVMRI technologists (2 per shift), trained research nurses (1 for every five multi‐center trials), one FTE secretary, active and proven leadership.
Patient population: An active CVMRI clinical service that caters to a broad spectra of referring physicians with a diverse patient population.
B: Before Trial Initiation:
Ethics committee Approval: Clinical research is carried out in facilities with the approval of the Institutional Review Board (IRB).
Ensure that study protocol can be followed: Validate the ability to perform study.
Form a process check‐list: A check list of the temporal sequence of activities from patient recruitment to final paperwork.
C: During the Clinical Trial:
Patient recruitment: Strict adherence to the inclusion/exclusion criteria and full informed consent from patient.
Strict Adherence to Protocol: Strict adherence to the study protocol from initial lab work to follow up.
Meticulous Documentation: Completion of appropriate documentation, case report forms (CRFs), AE or SAE reporting forms, drug inventory forms, etc.
Maintaining drug inventory: Appropriate storage of drugs, and maintaining an up‐to‐date drug inventory as required by the trial.
Monitoring and Auditing: Keeping accurate records for study monitors and auditors.
Conclusions: The participation in drug trials is an exciting, rewarding process that improves recognition of the institution, and also may be economically advantageous to the institution. In our experience, the key factors for a viable CVMRI clinical research environment includes: (a) Appropriate infra‐structure that has access to a broad spectrum of patients; (b) Strict adherence to IRB and study protocol; and (c) Meticulous documentation and follow up.
451. Peak‐Combination HARP: A Method to Correct for Phase Errors in HARP
Salome Ryf, Jeffrey Tsao, Anja Stuessi, Peter Boesiger. Institute for Biomedical Engineering, Zuerich, Switzerland.
Introduction: Myocardial tagging is useful for motion assessment of the heart in health and disease. HARmonic Phase (HARP) (Osman et al., [Citation1999]) is a powerful technique to evaluate tagging images and to quantify myocardial motion. HARP extracts one of the first harmonic peaks in k‐space produced by SPAMM (Axel et al., [Citation1989]) or CSPAMM (Fischer et al., [Citation1993]). Using the displacement‐encoded phase contrast, any point on the myocardium can be tracked. However, the phase information of MR images is susceptible to nonidealities, such as B0 inhomogeneity, chemical shift, flow, etc. These effects are accentuated with longer readouts and at higher magnetic fields. Thus, the phase of HARP images can be adulterated, leading to incorrect tracking of the myocardium. In this work, we propose to correct this problem by using both the positive and negative first harmonic peaks. In the images from the two peaks, the HARP phase (i.e. from tagging) have opposite signs, while the additional phase arising from nonidealities have the same sign. Thus, by phase subtraction of the two, the HARP phase is added while the spurious phase is eliminated.
Purpose: To introduce a method (peak‐combination HARP) for minimizing phase errors in HARP evaluation.
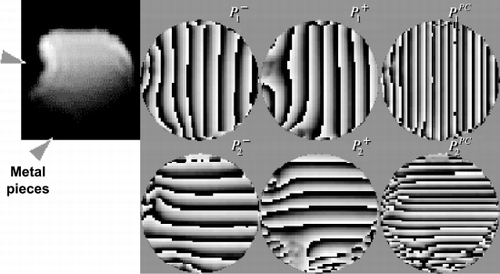
Methods: Tagging measurements—CSPAMM images with a tag‐line distance of 8 mm were acquired on a 1.5 T Scanner (Intera, Philips Medical Systems, Best, Netherlands). The tag lines were applied in two directions and separate images were acquired for each tagging direction. CSPAMM images were acquired with a conventional EPI sequence (EPI‐factor: 13, FOV: 380 mm, matrix: 128 × 39) and with a FastHARP sequence (Kraitchman et al., [Citation2003]) (single‐shot EPI, FOV: 380 mm, matrix: 32 × 33). Twenty cine frames with a temporal resolution of 35 ms were acquired. Phantom and in vivo measurements were performed. For the phantom measurements, two small metal pieces were attached to a bottle phantom (T1: 1000 ms) to produce an inhomogeneous B0 field. HARP evaluation—The HARP evaluation was performed conventionally with different selections of the peaks and with peak‐combination HARP. CSPAMM image for tag direction 1 (without motion):where k1 = spatial frequency of tag lines;φ1 = phase at (x,y) = (0,0); β(x,y) = additional phase originating from nonidealities such as B0 inhomogeneity. Extraction of positive and negative peaks in k‐space:
phase: P1± = ± (k1x + φ1) + β(x,y) Peak combination (* denotes complex conjugate):
Note that β(x,y) is eliminated in P1PC. The same procedure is applied to tag direction 2.
Results: shows HARP images of a bottle phantom. P1,2± are the HARP images of the negative and positive peak, P1,2PC are the peak‐combination HARP images. shows HARP tracking of a mid‐ventricular ring in end‐systole. The tracked points were selected in an end‐diastolic frame.
Figure 2. HARP evaluation with: ΔP1,2+; □P1,2−; ⋄P1,2PC. (View this art in color at www.dekker.com.)
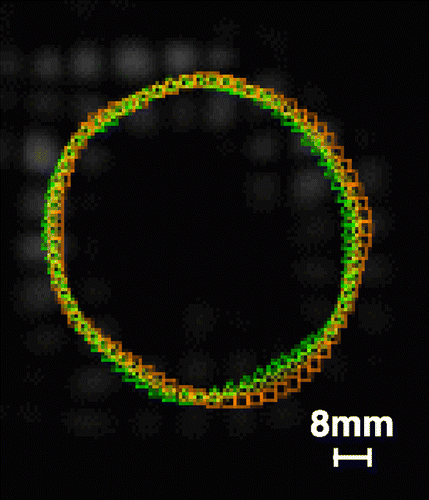
Conclusions: Nonidealities such as B0 inhomogeneity can lead to distortion of the image phase, which causes shifts in opposite directions in P1,2− and P1,2+ (), resulting in incorrect tracking and motion analysis in HARP (). With peak‐combination HARP, the additional phase β(x,y) is eliminated (), thus improving the accuracy in HARP evaluation (). In summary, HARP is a powerful tool to quantify myocardial motion, but it is susceptible to nonidealities such as B0 inhomogeneity. As HARP may be applied clinically for detecting abnormal wall motion, it is critical to eliminate any spurious phase that may affect motion analysis. We have shown that peak‐combination HARP is an effective means to overcome such phase errors.
452. Quantitation of the Total Heart Volume Variation in Man During the Cardiac Cycle
Marcus Carlsson,1 Peter Cain,1 Catarina Holmqvist,2 Hakan Arheden.1 1Clinical Physiology, Lund, Sweden, 2Department of Radiology, Lund, Sweden.
Introduction: Variations in total heart volume (defined as the structures within the pericardial sac, i.e. atria, ventricles and the roots of the great vessels) during a cardiac cycle affect efficiency of cardiac pumping. Changes in total heart volume result in a pendular motion that does not contribute to cardiac pumping.
Purpose: The aims of this study were to quantitate variations in the total heart volume (THV) throughout the cardiac cycle in healthy volunteers and to identify the location of these volume variations.
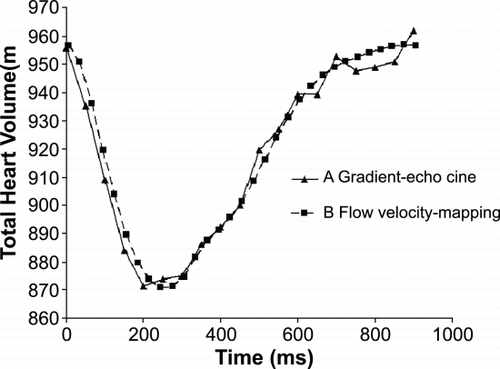
Methods: Eight healthy volunteers were examined by magnetic resonance imaging. Changes in total cardiac volume throughout the cardiac cycle were calculated using: (A) gradient‐echo cine images to measure the total heart volume using planimetry and (B) velocity‐encoded cine sequences to quantify flow in all vessels leading to and from the heart. Two observers evaluated all subjects by method (A) and 4 subjects by method (B) to test the interobserver variability. The change in THV was calculated from the differences in absolute flow and compared to the THV‐change obtained from planimetry. By separating cardiac inflow and outflow according to the left and right sides of the heart, the difference in contribution to the THV‐change could be calculated. The length of the heart was measured in three long‐axis planes at end‐systole and end‐diastole to investigate if the volume variations could be found in these planes.
Results: The THV changes were 8.2 ± 0.8% (SEM) measured by method (A) and 8.8 ± 1.0% by method (B). The results in one subject can be seen in . The THV‐change measured by method (B) is set to begin at the THV measured by method (A) for comparison. The agreement between the methods was good as well as the interobserver variability in method (A) (ICC = 0.98) and method (B) (ICC > 0.99). The predominant volume change was seen at the largest diameter of the heart (at the region of the AV‐plane movement) and the THV‐variation was larger on the left‐hand side (61 ± 2%). There was minimal shortening of the heart (0.9 ± 0.5%) in the long axis plane (from apex to base) and the apex was essentially stationary.
Conclusions: This study has shown the magnitude and phase of total heart volume change during the cardiac cycle in healthy adults in the supine position under resting conditions. The total heart volume variation amounted to 9% resulting from discordance between blood leaving (24% of total heart volume) and entering (15% of total heart volume) the heart during ventricular systole. The smallest volume during the cardiac cycle coincides with endsystole. The decreased volume is recovered during diastole. This mechanism may represent a dampening buffer, conserving energy in hearts of larger species and at lower heart rates.
453. Coronary Magnetic Resonance Angiography Depiction of Coronary Stenosis in a Swine Model of Chronic Ischemia
Susan B. Yeon, MD, Kraig V. Kissinger, BS, RT, Pierre Voisine, MD, Audrey Rosinberg, MD, Roger J. Laham, MD, René M. Botnar, PhD, Warren J. Manning, MD. Cardiovascular Division, Beth Israel Deaconess Medical Center, Boston, MA, USA.
Introduction: In the ameroid constrictor model of chronic myocardial ischemia, documentation of coronary artery stenosis generally requires x‐ray coronary angiography. Development of a non‐invasive method to visualize coronary artery stenoses would facilitate serial follow‐up.
Purpose: The purpose of this study was to examine the utility of coronary magnetic resonance angiography (MRA) to non‐invasively characterize coronary artery stenosis in this model.
Methods: Chronic myocardial ischemia was achieved by placing a plastic ameroid constrictor around a proximal segment of the left circumflex artery system in the Yorkshire pig (n = 3). Coronary magnetic resonance angiography (MRA) was performed on a 1.5 T Gyroscan ACS‐NT MR system (Philips Medical Systems, Best, NL) equipped with a 5‐element cardiac synergy receiver coil using vector ECG. ECG‐triggered T2 prepulse and fat saturated 3D SSFP (TE = 3.0 ms, TR = 6.0 ms, NSA = 1) coronary MRA of the proximal to mid left coronary artery was performed with animals continuously ventilated under general anesthesia. Diaphragmatic navigator gating without tracking was used to compensate for respiratory motion (5 mm gating window). Twenty slices with a 3‐mm thickness (interpolated to 1.5 mm) were acquired in late diastole (acquisition window 50 ms) with a 270 mm field‐of‐view and a 270 × 270 matrix (in‐plane resolution 1.0 × 1.0 mm). Total scan time was approximately 5 minutes. X‐ray coronary angiography with multiple selective injections of the left coronary system in various projections was performed on the same day as the coronary MRA.
Results: Coronary MRA demonstrated the proximal to mid left circumflex system with signal loss in the region of the ameroid constrictor and vessel stenosis within the constrictor (). The figure demonstrates a reformatted image from the MRA (A) and an image from the corresponding x‐ray angiograms (B). Each image demonstrates a long left circumflex (LCX) stenosis (arrowhead) within the ameroid constrictor.
Conclusions: These findings demonstrate the feasibility of coronary MRA for demonstration of coronary stenosis in the ameroid constrictor model of chronic ischemia. This approach would permit serial noninvasive follow‐up for studies of pathophysiology and treatment in this model.
454. Visualization of Single Myoblasts by High‐Resolution Magnetic Resonance Imaging on a 1.5 T Clinical Scanner
Zhuoli Zhang, M.D., Ph.D.,1 Ewout Jan van den Bos, M.D., Ph.D,2 Robert Jan van Geuns, M.D., Ph.D.,3 Marcel de Jong Popijus, B.Eng,2 Babak Mousavi, Ph.D.,2 Piotr Alfred Wielopolski, Ph.D.11Radiology, Erasmus Medical Center, Rotterdam, Netherlands, 2Experimental Cardiology‐Thorax Centrum, Erasmus Medical Center, Rotterdam, Netherlands, 3Cardiology, Erasmus Medical Center, Rotterdam, Netherlands.
Introduction: Introducing cells (myoblasts) that can remodel dysfunctional myocardium is of great interest. Nonetheless, non‐invasive monitoring of the myoblasts biodistribution in tissue is required for further validation. MRI offers both near‐cellular (25–50 µm) resolutions and whole‐body imaging capability. To distinguish the introduced myoblasts from surrounding myocardium, myoblasts must be labeled with an intracellular probe to provide high contrast against its surroundings to allow depiction and monitoring with MRI.
Advances in tracer technology now facilitate labeling of myoblasts intracellularly with approved iron‐based MRI contrast agents. One of these contrast agents, Endorem (Guerbet S.A., Paris, France), a Superparamagnetic Iron Oxide reagent (SPIO) has a mean size diameter of 78 nm. Good labeling efficiency has been achieved using transfection agents to increase the uptake of these SPIOs, not affecting cell function and division).
Purpose:
To validate a method for efficient labeling of myoblasts using SPIOs (Endorem) and liposome complexes
To demonstrate single cell detection on a conventional 1.5 T clinical scanner.
Methods: Pig skeletal myoblasts were isolated and cultured. To facilitate SPIOs uptake two suspensions (30 µl lipofectamine 2000 in 0.5 ml of Opti‐MEM and 100 µg of iron in 0.5 ml of Opti‐MEM) were mixed. After 20 minutes, the resulting suspension was added to dishes containing the myoblasts and incubated for 24 hours. Two experiments were performed: 1) cell detection with MRI and fluorescence microscopy using DAPI staining; 2) evaluation of SPIO toxicity using JC‐1 staining (detection of apoptosis and cell death). Prussian blue staining was used to confirm SPIO uptake by myoblasts. Cytologic studies were performed with electron microscopy and DAPI staining. The images obtained were compared with those acquired by MRI.
For MRI, the labeled myoblasts were collected and fixed. 4 cell suspensions were prepared containing 225, 550, 820 and 1100 myoblasts, respectively. A monolayer of 10 µl of each cell suspension was sandwiched between gelatin (3%, w/v) and placed in 1 cm culture inserts. To enhance cell visibility and shorten imaging time, the gelatin was mixed with Gd‐DTPA (1:200 solution in PBS, T1 ∼ 65 ms). Culture inserts with unlabeled myoblasts were used as controls. High‐resolution MR imaging was performed on the culture inserts on a General Electric 1.5 T Signa CVi scanner (Milwaukee, USA) with the standard clinical imaging gradient set (40 mT/m and SR150). A 3D SPGR sequence (TR/TE/flip angle/BW = 108/15.4 ms/60°/7.81 Khz) and a round surface coil (diameter 1.5 cm) were used; 3 hours scantime.
Results: Lipofectamine labeling resulted in 100% labeled myoblasts with rapid SPIO uptake (). Electron microscopy showed encasement of SPIOs within membrane‐bound organelles (). Apoptosis and cell death in both SPIO labeled and unlabeled myoblast groups was not detected in 10 days, confirming non toxic effects to cell life. Cell proliferation was neither affected since cell counts were similar for both labeled and unlabeled myoblast groups.
Figure 1. Prussian blue stain shows SPIOs as intracytoplasmic particles. To aid SPIO uptake by myoblasts, lipofectamine 2000 was used, demonstrating 100% label efficiency. (View this art in color at www.dekker.com.)
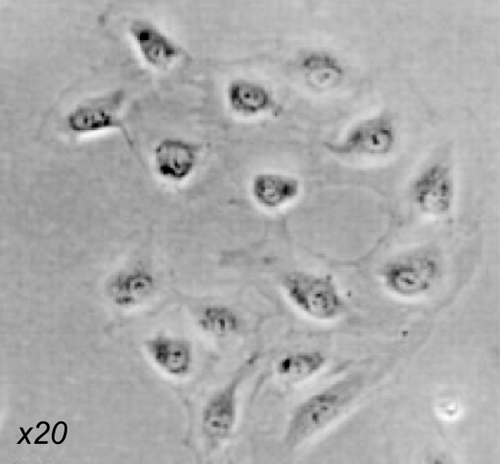
Figure 2. High magnification electron microscopy image (X10000) shows a conglomeration of SPIOs within membrane‐bound organelles (arrow). (View this art in color at www.dekker.com.)
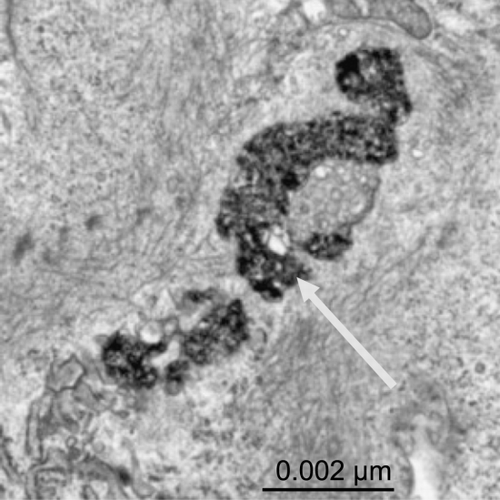
Myoblasts were scanned with MRI up to a maximum resolution of 20 × 26 × 50 µm3 voxels with the available clinical imaging gradient set. Single myoblasts were detected as signal voids (susceptibility induced signal loss) in the surrounding gel (). Lower resolutions also permitted single myoblast detection, signal voids created by the SPIOs were much larger than the cell itself (∼ 50X ∼ 30–70 µm). All 4 cell suspensions demonstrated labeled cells with a volume distribution in the monolayer of 11 µl ± 2.1 µl. Unlabeled cells could not be detected in any of the control samples.
Figure 3. Slice obtained from the 3D SPGR acquisition of the SPIO labeled cell suspension with 225 cells (0.0225 × 10³/µl concentration). Cells appear as signal voids from susceptibility induced signal dephasing from SPIOs in membrane‐bound organelles. Imaging parameters: TR = 108.00 ms; TE = 15.36 ms (partial echo); Flip = 60°; FOV = 1.0 × 1.0 cm2; Matrix = 512 × 384; NEX = 8.0; scan time = 3 hours. Scanned resolution = 20 × 26 × 200 µm3. Reconstruction resolution = 20 × 20 × 100 µm3. (View this art in color at www.dekker.com.)
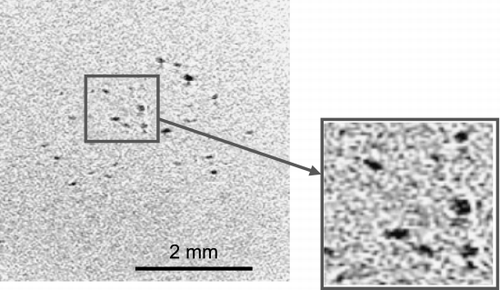
Conclusions: 100% SPIO labeling efficiency was achieved without disadvantages to cell function and division. Clinical MRI units may be used for detecting SPIO labeled cells at high resolution and may provide a feasible tool for tracking myoblast engraftment in vivo.
455. Three‐Dimensional Breath‐Hold Coronary MRA: A Comparison Between 1.5 T and 3.0 T
Xiaoming Bi, B.S.,1 Vibhas S. Deshpande, Ph.D,2 Orlando Simonetti, Ph.D,2 Gerhard Laub, Ph.D,2 Debiao Li, Ph.D.1 1Department of Radiology and Biomedical Engineering, Northwestern University, Chicago, IL, USA, 2Siemens Medical Solutions, Erlangen, Germany.
Introduction: Recently, whole body 3.0 T scanners were approved for clinical use and a preliminary study showed promising results for coronary MRA at 3.0 T (Stuber et al., [Citation2002]). In theory, imaging at 3.0 T should double the signal‐to‐noise ratio (SNR) compared to 1.5 T. However, B0 field inhomogeneities tend to be more severe at higher field strength and dielectric effects may induce B1 heterogeneity and degrade image quality (Noeske et al., [Citation2000]).
Purpose: The purpose of this study was to compare the SNR and contrast‐to‐noise ratio (CNR) of coronary MRA at 3.0 T to the results from 1.5 T using a 3D, breath‐hold steady‐state free precession (SSFP) sequence.
Methods: Five healthy volunteers were scanned at both 1.5 T (Sonata) and 3.0 T (Trio) Siemens scanners. Both the left anterior descending coronary artery (LAD) and right coronary artery (RCA) were imaged for each study using the whole body coil as the receiver. For comparison, another set of images was also acquired at 1.5 T using two, 6‐channel cardiac phased array coils as the receiver. One additional comparative study was done when a phased array cardiac coil became available for our 3.0 T imaging system at the end of this study.
Coronary artery images were acquired using a segmented 3D, cardiac gated, breath‐hold, SSFP sequence. Imaging parameters included: TR/TE = 4.1/1.7 msec, flip angle = 70°, readout bandwidth = 810 Hz/pixel, FOV = 237 × 380 mm2, 31–45 lines/segment, matrix size = (122–179) × 512, slab thickness = 18 mm, number of partitions = 6 (12 after sinc‐interpolation). Total imaging time for acquiring one slab was 24 cardiac cycles. Synthesizer frequency was adjusted when necessary to reduce obvious off‐resonance artifacts (Deshpande et al., [Citation2003]).
Coronary artery SNR and CNR were measured and data were presented as mean ± standard deviation. Comparisons between different data sets were performed using a paired t‐test.
Results: shows LAD images from two healthy volunteers. Using the whole body coils, the coronary SNR and CNR at 3.0 T (24.2 ± 5.6/14.2 ± 4.0) are significantly higher than those at 1.5 T (10.0 ± 32.9/4.4 ± 1.8) (SNR: P < 0.001; CNR: P < 0.001). No significant differences in SNR and CNR were observed between 3.0 T images using the body coil and those acquired at 1.5 T (24.4 ± 9.5/12.3 ± 7.4) using the phased array coil. For the study using the phased array coil at 3.0 T, SNR (40.9), CNR (15.4) and coronary artery delineation are markedly improved as compared to those of 1.5 T (SNR/CNR: 28.2/10.2).
Conclusions: We demonstrated that imaging at 3.0 T markedly improved coronary SNR and CNR compared to 1.5 T. Good quality coronary artery images were obtained using the 3D breath‐hold TrueFISP technique with both scanners. The SNR and CNR at 3.0 T with the whole body coil was approximately the same as those at 1.5 T with the phased array coil. Further improvements are expected with cardiac phase‐array coil at 3.0 T. This study shows coronary MRA at 3.0 T is very promising, which warrants further technical improvements and evaluation.
Note that the coronary SNR and CNR image at 3.0 T with the body coil (c) are approximately the same as those at 1.5 T with the phased array coil (a) but markedly higher than those at 1.5 T with the body coil (b). Images from another volunteer using cardiac phased array coil are shown for 1.5 T (d) and 3.0 T (e).
456. MR Guided Intramyocardial Injection Using an MRI Compatible Catheter
Gabriele A. Krombach, MD,1 Joachim E. Pfeffer,1 Silvia Kinzel, DVM,2 Rolf W. Günther, MD,1 Arno Buecker, MD.1 1Radiology, University Hospital, Technical University Aachen, Aachen, Germany, 2Experimental Veterian Medicine, University Hospital, Technical University Aachen, Aachen, Germany.
Introduction: Local delivery of substances into the myocardium has recently been introduced for treatment of ischemically injured myocardium to accomplish: 1) high local concentration, 2) restrict delivery to the pathologic regions and 3) minimize potential systemic adverse effects. In patients delivery of substances has been achieved either during bypass surgery, or using a mini‐thoracotomy. This approach is invasive and requires general anesthesia. MRI guided percutaneous catheter based intramyocardial injection of substances represents a miminal invasive approach and has recently been shown to be feasible in the heart.
Purpose: The purposes of this study were to 1) introduce a technique for real time guidance of percutaneous intramyocardial injection based on passive catheter visualization, 2) compare decrease of T1 values in the myocardium obtained with different concentrations of Gd‐DTPA and 3) monitor enhancement of myocardium after local injection as a function of time.
Methods: 4 pigs (w, 45 kg body weight) were included into the current study. Experiments were performed on a 1.5 T system (ACS NT, Philips, Best, The Netherlands). For image‐guidance, a radial steady state free precession sequence (TR 3.2 ms, TE 1.4 ms, 45° flip angle, 80 radials, 8 mm slice thickness) was employed. Data were reconstructed to a 1282 matrix yielding a frame rate of 10 frames/sec using view sharing. A 3 mm long stainless steal needle, mounted on a 5 F catheter, was introduced via the carotid artery. The catheter was advanced to the left ventricle under MR guidance and 2 ml of 10% (0.05 mmol/ml) and 20% (0.1 mmol/ml) Gd‐DTPA injected into the wall of the left ventricle. Look‐Locker images were acquired after injections (180° prepulse, followed by segmented FFE‐images with an interval of 30 ms).
Results: Catheter guidance for intramyocardial injection of Gd‐DTPA solutions and visualization of distribution of the contrast was feasible using radial SSFP in all animals. Regional changes in T1 values were significantly different for different concentrations (0.05 mmol/ml Gd‐DTPA: 455 ± 6 ms; 0.1 mmol/ml Gd‐DTPA: 235 ± 10; p < 0.001). T1 values increased significantly (p < 0.05) to 710 ± 50 ms for 0.05 mmol/ml Gd‐DTPA and 450 ± 17 ms for 0.1 ml/mmol Gd‐DTPA 30 min after injection but remained significantly lower than that of remote myocardium (885 ± 9 ms) (). The size of the enhanced region increased from 13 ± 2 mm2 to 30 ± 3 mm2 at 30 min (p < 0.05).
Conclusions: Intramyocardial injection of extracellular MR contrast medium at concentrations of 0.05 or 0.1 mmol/ml decreases T1‐values over 30 min, sufficiently for visual depiction of solution distribution. Concentration of 0.05 or 0.1 mmol/ml should be choosen with respect to the sequence used. This technique may be used for determining the extent of primary distribution of intramyocardially delivered solutions.
457. Peri‐Infarct Edema and Myocardial Stunning are of Comparable Size and are More Extensive than the Necrotic Zone
Anthony H. Aletras, Ph.D., Alex Natanzon, B.Sc., Li‐Yueh Hsu, Ph.D., Gauri S. Tilak, M.P.H., Andrew E. Arai, M.D. Lce‐nhlbi, National Institutes of Health, Bethesda, MD, USA.
Introduction: Shortly after myocardial infarction (MI), the functional deficit is more extensive than the necrotic zone, perhaps as a result of myocardial stunning and tethering.Recent studies indicate that T2‐Weighted (T2W) images can detect edema associated with acute MI. We hypothesized that high‐resolution DENSE (Displacement ENcoding with Stimulated Echoes) could map intramural strain for direct comparisons with 2‐D delayed hyper‐enhancement imaging (DHE) and high signal‐to‐noise ratio T2W images.
Purpose: To determine, in acute MI, the extent of hypokinesis relative to the size of the necrotic zone on DHE viability imaging and relative to the size of the edematous region on T2‐weighted imaging (T2W).
Methods: Eleven mongrel dogs were imaged 2 days after a 90‐minute LAD occlusion followed by reperfusion. Functional MRI with DENSE was performed at 1 × 1 mm resolution. Similar resolution data were acquired with T2W and DHE. Hypokinetic myocardium was defined as areas with less than 10% circumferential shortening (CS) or radial thickening (RT), while the remote zone was the remaining LV wall. T2W and DHE areas were automatically measured based on 50% of the peak enhanced myocardial signal intensities (half‐height threshold). All areas are reported as percent LV. Results are mean ± SEM.
Results: Infarct size by DHE encompassed 24 ± 5% of LV. Edema by T2W images was measured at 48 ± 7% of LV (p < 0.001 vs DHE). DENSE circumferential shortening and radial thickening hypokinetic zones were found in 53 ± 7 and 56 ± 7% of LV respectively; both significantly different than DHE (p < 0.001). The hypokinetic zones on DENSE circumferential shortening and radial thickening maps were not significantly different in size than the zone of edema on T2W images (p = 0.416 and p = 0.175, respectively) ().
Conclusions: In 2‐day old reperfused myocardial infarctions, the necrotic zone was significantly smaller than both the zone of edema and the area of hypokinesis as determined by high‐resolution DENSE MRI. Peri‐infarct edema corresponds closely with myocardial stunning 2 days post‐MI.
458. Ventricular Torsion Differs Among Mouse, Rat and Human Species, but Twist Is Conserved
Wei Liu,1 Marvin Ashford,2 Junjie Chen,1 J. Stacy Allen,2 Shiow J. Lin,2 Mary Watkins,2 Todd Williams,2 Samuel A. Wickline,2 Xin Yu.2 1Department of Biomedical Engineering, Washington University, St. Louis, MO, USA, 2Cardiovascular MR Laboratories, Washington University, St. Louis, MO, USA.
Introduction: The advent of molecular age has brought about the wide use of rodent models, especially mice, as popular surrogates of human cardiac diseases. However, the question of whether mice, rats, and humans manifest similar patterns of ventricular wall motion has not been fully evaluated, which if true would enhance the interpretation of the heart contractile mechanism. While similarities in myofiber architecture suggests that the fundamental patterns of wall motion, i.e., twist and torsion (twist per unit length), may be the same, quantitative parameters may differ as a result of the considerable differences in size and contractile protein isoforms.
Purpose: We used MR tagging as a noninvasive approach to compare the left ventricular (LV) twists and torsions in mice, rats and humans.
Methods: Healthy human volunteers (11.6 ± 2.7 years old, n = 6) were scanned on a 1.5 T Philips scanner. C57BL/6 mice (1.8 ± 0.3 months old, n = 7) and Fisher 344 rats (23.5 ± 1.2 months old, n = 6) underwent MR tagging on a 4.7 T Varian magnet. Regular cine images were acquired with ECG‐triggered gradient echo sequence. Tagging sequence used SPAMM1331 applied twice immediately after the ECG trigger, yielding a two‐dimensional tag grid in imaging plane. The tagged images have the following parameters: repetition time, R–R interval; echo time, 3–4 ms; field of view, 33 cm × 33 cm for humans, 6.5 cm × 6.5 cm for rats and 4 cm × 4 cm for mice; matrix size, 128 × 128 for humans, 256 × 256 for rats and mice; tag resolution, 8 mm for humans, 0.9 mm for rats and 0.6 mm for mice; slice thickness, 7–8 mm for humans,1.5 mm for rats and 1 mm for mice.
Three short‐axis tagged images were acquired at basal, midventricular and apical levels. One long‐axis cine image was also acquired in the horizontal four‐chamber view (humans and mice only). Images were analyzed with in‐house developed MATLAB‐based software. Myocardial twist was computed relative to the center of ventricular cavity using 2D homogenous strain analysis. Net twist angle was defined as the difference between the ventricular twist at apical and basal slices. Torsion was defined as the net twist angle normalized by the slice separation. Longitudinal shortening was calculated as the relative change in LV length at systole.
Results: Despite the large differences in their body weight (26.0 ± 1.0 g for mice, 429.0 ± 39.5 g for rats and 41.2 ± 10.7 kg for humans), the ejection fractions are similar in mice (61.3 ± 8.12%), rats (67.3 ± 6.56%) and humans (60.8 ± 6.39%, p = NS). The net ventricular twist is also equivalent among mice, rats and humans (12.8 ± 2.0°, 14.5 ± 0.9° and 13.2 ± 2.2°, p = NS) as shown in . However, because of the considerable difference in LV length (7.3 ± 0.6 mm for mice, 12.8 ± 1.0 mm for rats and 82.6 ± 11.3 mm for humans), torsion is significantly larger in mice and rats as compared with humans: 31.5 ± 4.7°/cm for mice, 23.1 ± 2.7°/cm for rats and 3.6 ± 0.7°/cm for humans (p < 0.0001). indicates that torsion is linearly proportional to 1/LV length (R = 0.98). The longitudinal shortening in humans is significantly larger than in mice (0.24 ± 0.03 vs 0.13 ± 0.01, p < 0.001, ). The relatively larger longitudinal shortening in humans may have compensated for the significantly smaller torsion to yield similar ejection fraction as compared to mice and rats.
Conclusions: Patterns of ventricular twist, but not torsion, are conserved across different species, which supports the hypothesis that ventricular twist is a fundamental mechanism of ventricular function. Accordingly, for cross‐species comparisons, regional twist may provide the most direct correlate of fundamental contractile mechanics. The fact that ventricular torsion is inversely proportional to the length of the ventricle may yield smaller values for torsion in larger species. However, the enhancement of longitudinal contraction in larger species may compensate for the smaller torsion.
459. High Resolution Imaging of Myocardial Infarction at 1.5 T and 3.0 T: Is it Possible to Track SPIO Labeled Cells?
Piotr A. Wielopolski, Ph.D.,1 Ewout J. van den Bos, M.D.,2 Zhuoli Zhang, M.D., Ph.D.,1 Amber Moelker, M.D.,2 Robert J. van Geuns, M.D., Ph.D.3 1Radiology, Erasmus Medical Center, Rotterdam, Netherlands, 2Experimental Cardiology‐Thorax Centrum, Erasmus Medical Center, Rotterdam, Netherlands, 3Cardiology, Erasmus Medical Center, Rotterdam, Netherlands.
Introduction: Delivery and tracking of cells in‐vivo with MRI has a great potential. One particular application, the introduction of bone marrow cells to restore damaged or dysfunctional myocardium to functionality has been proposed and validated to certain extent. Nonetheless, tracking these cells in vivo to correlate cell presence with positive outcomes in cardiac function is difficult non‐invasively and without the use appropriate markers that are safe, visible, durable and non‐genomic. Superparamagnetic Iron Oxide particles (SPIOs) have appeared as potential cell tracers for MRI. Accumulated SPIOs in organelles inside the cells can cause a strong local disruption of the magnetic field homogeneity with a concomitant loss in MR signal, which makes labeled cells appear black. This effect can be as large as 50 times the size of the organelle, making the cells visible even with imaging voxel sizes that are far larger than a single cell. Single cell imaging of SPIO labeled pig and human myoblasts in culture has proven possible in our 1.5 T and 3.0 T clinical scanners at resolutions down to 20 × 20 × 50 µm3 voxels.
Purpose: To explore pig excised heart specimens using high‐resolution 1.5 T and 3.0 T MRI to detect SPIO labeled bone marrow cells introduced after intracoronary injection to the feeding coronary artery of a previously infarcted region.
Methods: Myocardial infarctions were created in seven pigs (weight 20–25 kg) by balloon occlusion of the left circumflex coronary artery for 2 hours followed by reperfusion. MRI was performed a week later on a GE 1.5 T Signa CVi scanner (General Electric Medical Systems, Milwaukee, USA) with the standard clinical imaging gradient set (40 mT/m and SR150) and a phased array torso coil. A routine protocol was followed: cine FIESTA, T2*W GRE and delayed contrast enhanced IR‐GRE scans. After the imaging session, SPIO labeled pig bone marrow cells where injected in the circumflex coronary artery in one pig. Two pigs received non‐labeled cells and in four pigs only medium was injected. After four weeks the imaging protocol was repeated. The animal was sacrificed and the heart excised and scanned at higher resolution using the same phased array torso array. The hearts were then sliced into 1.4 cm thick sections and one section containing infarcted myocardium was placed in formaldehide and scanned at much high resolution. Imaging was performed using the 1.5 T or the 3.0 T scanner with a 2 cm diameter loop coil for signal reception (the same imaging gradient sets in both). 3D SPGR sequences were chosen with a mildly T1W imaging parameters to provide good signal‐to‐noise in the infarcted region (still containing some of the 0.1 mmol/Kg Gd‐DTPA injected 5 minutes prior to sacrificing the animal). Scan parameters were adjusted to suit different resolutions. For 60 × 60 × 100 µm3 voxels, imaging parameters were TR/TE/flip angle = 34.0 ms/11.0 ms/24/(at 1.5 T) and TR/TE/flip angle/ = 23.0 ms/7.2 ms/20°( at 3 T). Histology was performed accordingly.
Results: Infarcted regions in all hearts inspected (control pigs and those pigs that received unlabeled and labeled bone marrow cells) demonstrated regions of low signal intensity. In healthy myocardium, signal was homogeneous. The conspicuity of the low signal intensity was increased as smaller voxel sizes were achieved (), depicting a pattern that could be interpreted as labeled cells. Histology confirmed the presence of iron after prussian blue staining. The low signal intensity was associated to hemosiderin and collagen fibers.
Figure 1. Myocardial infarction in a pig model at 3T. A 100 µm slice with an in‐plane resolution of 60 µm × 60 µm collected at 3.0 Tesla from an infarction on a baseline pig without labeled myoblasts injected. The darker signal intensities detected in the infarcted myocardium reveal blood byproduct accumulation (hemosiderin). Hemosiderin causes signal loss from increased susceptibility effects similarly as SPIOs do, therefore, it is difficult to distinguish one from the other. Healthy myocardium shows with uniform signal intensity.
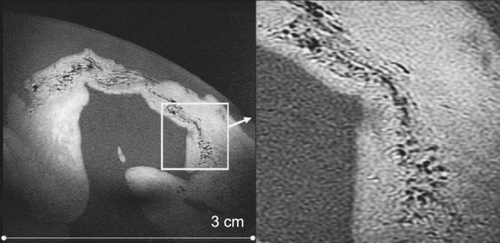
Conclusions: Tracking SPIO labeled cells can prove difficult. The low signal intensity patterns that appear at high resolution scanning can be easily confused with that generated by SPIO labeled cells. A different infarct model may be necessary to demonstrate the fate of labeled cells for myocardial regeneration.
460. In Vivo Characterisation of Aortic Stenosis in the Mouse Using High‐Resolution MRI
Jürgen E. Schneider, PhD,1 Craig A. Lygate, PhD,1 Paul J. Cassidy, PhD,2 Kieran Clarke, PhD,2 Stefan Neubauer, MD,FRCP.1 1Cardiovascular Medicine, Oxford University, Oxford, United Kingdom, 2Physiology, Oxford University, Oxford, United Kingdom.
Introduction: Transverse aortic constriction (TAC) in the mouse is a commonly used surgical model of cardiac hypertrophy and subsequent failure; however, there is considerable variability in the extent of hypertrophy.
Purpose: To determine whether variability in the constriction might account for this, we aimed to develop a non‐invasive MRI technique to allow visualisation of the stenotic aorta.
Methods: C57Bl/6 male mice (20–25 g) were anaesthetised with isoflurane, intubated, and a trans‐sternal thoracotomy was performed. The transverse aorta was constricted with a 7/0 polypropylene suture tied around a 27 G needle. Left ventricular hypertrophy was monitored by echocardiography, and a subset of “good” and “poor” responders were selected on this basis for further MRI examination (n = 5). High‐resolution, ECG‐triggered and respiration‐gated MRI was performed on an MR‐system that comprised an 11.7 T vertical magnet with a shielded gradient system (548 mT/m, rise time 160 µs) (Magnex Scientific, Oxon, UK), a Bruker Avance console (Bruker Medical, Ettlingen, Germany) and a 40 mm quadrature driven birdcage coil (Rapid Biomedical, Würzburg, Germany). Raw data were acquired using a segmented 3D GE sequence (4 mm slab thickness, FOV 25.6 × 25.6 × 6 mm, matrix size of 384 × 384 × 32, a = 15°, TE = 2 ms, TR = 2 RR intervals, i.e. 240–300 ms, NAE = 2) and isotropically zerofilled by a factor of two before FFT. 3D reconstruction of the aortic arch was done using Amira™ 2.3.
Results: shows data from a control mouse (a–c), from a “good” (d–f) and a “poor” responder (g–i), respectively. In the left column (a,d,g) MR images through the aortic arch are shown with a voxel size in of 33 × 33 × 94 µm. The arrow in the bright blood MR images () indicates blood flow around the band. The middle column (b,e,h) shows a 3D reconstruction and the right column (c,f,i) the orthogonal intersection of the respective arch. The massive reduction in the cross‐sectional area after a proper banding is clearly visible ( compared to ) whereas illustrates additional lumina for the blood flow that will likely reduce the degree of banding, and thus the hypertrophic response.
Figure 1. (View this art in color at www.dekker.com.)
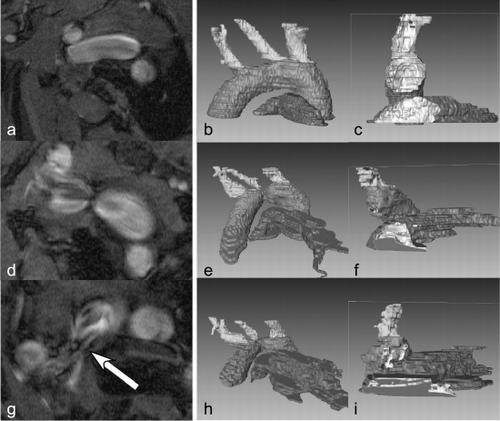
Conclusions: Variability in the cross‐sectional area of the stenosis after TAC in mice may explain the variability in hypertrophic response. Our technique to visualize aortic stenosis using MRI will be of particular value in genetically modified mice, where a poor hypertrophic response to TAC might otherwise be taken as evidence for an effect of the modified gene. Work is in progress to quantify the cross‐sectional area and correlate it to cardiac functional parameters. We suggest that, when using the banding model, experimental groups should be stratified for aortic cross‐sectional area.
461. Multi‐Slice Real‐Time MRI with Adaptive Projection Modes for Interventional Cardiovascular Procedures with Active Devices
Michael A. Guttman,1 Amish Raval,2 Alexander J. Dick, MD,3 Venkatesh K. Raman,2 Cengizhan Ozturk, PhD,2 Lederman Robert,2 Elliot McVeigh.1 1Laboratory of Cardiac Energetics, NIH/NHLBI, Bethesda, MD, USA, 2Cardiac Interventional Program, NIH/NHLBI, Bethesda, MD, USA, 3Division of Cardiology, Sunnybrook & Women's College Health Sciences Centre, Toronto, ON, Canada.
Introduction: Real‐time MRI is a promising modality for providing guidance during cardiovascular interventional or other minimally invasive procedures. Images can be produced at a rate of several frames per second, with a fraction of a second latency. Soft tissue contrast is often superior to other medical imaging modalities and many imaging parameters can be interactively modified under software control during scanning. Interventional devices can incorporate receiver coils for high signal‐to‐noise (SNR) imaging near the device or to track the position of the device. Images reconstructed from device signal may be differently colored to highlight device location. Multiple thin‐slice images in any orientation may be acquired sequentially to assist device navigation around tortuous structures. Device‐only projection imaging has been used to visualize the length of an active device which may have exited thin‐slice imaging planes. However, navigating the device back to a target in the imaging slice may be difficult. We introduce an environment where device‐only projection images are merged with a multi‐slice color‐highlighted 3D rendering for complete view of device and imaging slices in real‐time.
Purpose: This work describes an MRI environment under development for use in interventional procedures. It utilizes many of the imaging features described above and incorporates a new imaging and display technique designed specifically for the navigation of active interventional devices, such as a guiding catheters with a receiver coils along the length or an injection device with a single small coil near the tip.
Methods: Real‐time pulse sequence and reconstruction workstation were modified for continuous multi‐slice acquisition with 3D rendering, interactive selection of device‐only projection mode on any slice, and color highlighting of device channels. An adaptive device‐only “projection navigation” (PRONAV) image was added, which is a device‐only projection image oriented parallel to the viewing screen. The PRONAV acquisition orientation is updated continuously as the user rotates the rendering. The PRONAV is blended with the multi‐slice rendering for translucent effect. Examples are shown navigating an intracardiac injection device to a tissue target in anesthetized swine.
Results: Rendering one short‐axis and one long‐axis slice intersecting at a target point (e.g. infarct border) provided adequate views of target and surrounding anatomy without cluttering the rendering. Cardiac function was observable in the individually displayed images. Color‐highlighting improved delineation of device position. The device would frequently exit the imaging plane during manipulation. Enabling device‐only projection for one of the slices gave indication of device extent and orientation. PRONAV displayed with one of the rendered slices gave excellent feedback about device orientation with respect to the imaging slice when rotating the rendering. This mode made it more apparent which direction the catheter must be torqued and pushed/pulled to steer the device tip toward target tissue in the imaging plane. shows a simple example with a guiding catheter, highlighted in green, through which an injection device was inserted, highlighted in red (Boston Scientific). A thin‐slice short‐axis image is shown in the left column; a 3D rendering containing the short‐axis slice and PRONAV image are in the right column. The top row shows the injection device outside the short‐axis plane. The practitioner pulls back the catheter to position the injection device in the short‐axis plane, as seen in the bottom row.
Figure 1. (View this art in color at www.dekker.com.)
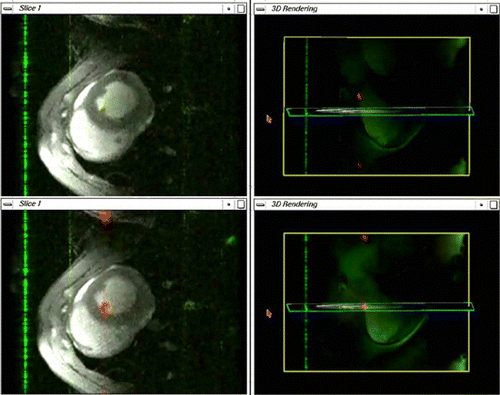
Conclusions: Adaptive device‐only projection imaging facilitates the navigation of an active interventional device using a strategic combination of thin‐slice and projection imaging. This may benefit interventional procedures involving manipulation of active devices.
462. Comparison of High Field Magnetic Resonance Imaging at 1,5 T and 3 T for Coronary Artery MRA
Henning Steen,1 Joao A. C. Lima, MD,1 Evangelos Giannitsis, MD,2 Hugo A. Katus, MD,3 Matthias Stuber, PhD.4 1Cardiology, Johns Hopkins Hospital, Baltimore, MD, USA, 2Cardiology, Universitätsklinik, Klinik III, Heidelberg, Germany, 3Cardiology, Universitätsklinikum, Klinik III, Heidelberg, Germany, 4Radiology, Johns Hopkins Hospital, Baltimore, MD, USA.
Introduction: The vast majority of cardiac MRI examinations are currently performed at 1.5 T. However, 3 T MRI systems have recently been approved for human use by the FDA. To study the performance of contemporary coronary MRA methods at high field‐strength, we compared objective and subjective parameters for coronary MRA image quality at both 1.5 T and 3 T.
Methods: Twelve healthy adult subjects were scanned within one week on both a 1.5 and 3 T commercial whole body scanner (Philips 1.5 T Intera/3 T Intera) equipped with a five (1,5 T) and six (3 T) element phased array surface coil for signal reception. Free breathing navigator (positioned on the right hemi‐ diaphragm (1.5 T) or the heart ‐liver interface (3 T)) and vector ECG gated, fat suppressed (spectrally selective) T2 prep (TE = 50 ms) coronary MRA (3D segmented k‐space gradient echo; TR = 8.2 ms; TE = 2.4 ms, FOV = 360; 512 matrix, 20 slices a 1.5 mm, alpha = 30° (1.5 T), alpha = 30° (3 T)) with a voxel size of 0.7 × 1.0 × 3 mm and data acquisition in late diastole (82 ms acq. window) were obtained on both systems. Linear volume shimming in the region of interest was performed on both systems. Objectively, vessel sharpness or vessel delineation (= first‐order derivative at the vessel border) of the proximal and mid parts of LAD (5 cm segment) and RCA (8 cm segment) and their vessel diameters were analyzed semi‐automatically using a previously described ‘Soap‐Bubble’ analysis tool. Subjectively, fat saturation‐ and image quality as well as motion artefacts were assessed via consensus reading and divided from 1 = poor image quality, to 4 = excellent image quality. Heart rate and navigator efficiency were extracted from the scanning data. All statistical comparisons were made using a two‐tailed paired Student's t‐test.
Results: In all subjects, navigator gated and corrected coronary MRA of the left and right coronary arterial system could be successfully obtained with high visual contrast on both systems. Consistent with the improved visual vessel delineation at 3 T (, dotted arrow), vessel sharpness of the RCA and LAD were significantly improved at 3 T (RCA: 63.24 ± 0.24 vs. 40.77 ± 0.04; LAD: 42.19 ± 0.08 vs. 33.25 ± 0,04; both p lower 0.05). The RCA and LAD diameter comparison showed no significant difference (RCA 1,5 T = 2,85 ± 0,24 mm vs. 2,94 ± 0,26 at the 3 T; LAD at 1,5 T = 2,96 ± 0,27 vs. 2,81 ± 0,25 at 3 T). Fat saturation quality (1,5 T = 3,5 ± 0,6 vs 2,4 ± 0,7 at 3 T), image quality (1,5 T = 3,3 ± 0,6 vs 3 ± 0,8 at 3 T), navigator efficiency (1,5 T = 51 ± 11% vs 56 ± 13% at 3 T) and motion artifacts (1,5 T = 3,8 ± 0,27 vs 2,8 ± 0,5 at 3 T) were not significantly different (P = NS). Only the heart rate was significantly lower at 3 T (1,5 T = 70 ± 4% vs 63 ± 3,3, p lower 0,05).
Figure 1. Left and right coronary arterial system obtained at 1.5 T (A, C) and 3 T (B, D) in the same subjects. Note the improved visual vessel delineation with more anatomical detail information (dashed arrows) obtained at the higher field‐strength. In E, an example right coronary system obtained at 3 T is displayed.
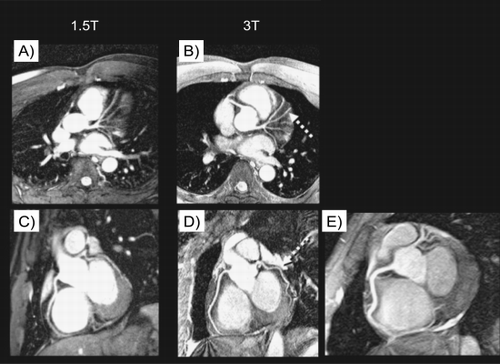
Discussion and Conclusions: In this study, a direct side‐by‐side comparison of coronary MRA image data collected at two different field‐strengths (1.5 T and 3 T) was performed in the same subjects. Using contemporary endogenous contrast enhancement for coronary MRA in conjunction with free‐breathing navigator gated and corrected image data collection, the use of 3 T results in an objectively improved vessel delineation or vessel sharpness when compared to 1.5 T. Even though statistically not significant, a tendency for a reduced fat suppression quality was observed at 3 T. Hereby, the use of higher‐order shimming may be helpful and will have to be investigated for high‐field coronary MRA. Most importantly, navigator performance was not affected by using the higher magnetic field strength. However, consistent with earlier observations (Refs Stefan), a slightly but significantly reduced heart rate was observed at 3 T.
463. Quantitative Evaluation of Aortic Atherosclerotic Plaque Components in ApoE Knockout Mice Using High‐Resolution Ex Vivo Magnetic Resonance Microscopy
Martina A. McAteer, PhD, Jürgen E. Schneider, PhD, Keith M. Channon, MD FRCP, Stefan Neubauer, MD FRCP, Robin P. Choudhury, DM MRCP. Department of Cardiovascular Medicine, Wellcome Trust Centre for Human Genetics, University of Oxford, United Kingdom.
Introduction: Atherosclerotic plaque composition, in particular, a large lipid‐rich core and a thin fibrous cap, appears to be a major determinant of plaque vulnerability to rupture, a key event in myocardial infarction and cardiac death. Thus, there is a need for accurate imaging strategies that can characterise these plaque components.
Purpose: To evaluate the ability of ex vivo high resolution magnetic resonance microscopy (MRM) to identify and quantify individual components of mouse atherosclerotic plaque.
Methods: Five apolipoprotein E‐/‐ mice were fed a high fat diet for 20 weeks. Hearts and aortas were perfused with paraformaldehyde, removed en bloc and instilled with Fomblin, a liquid hydrocarbon. Ex vivo MRM was performed using an 11.7 T vertical magnet and a 13 mm probe. Four echoes were acquired and added using a 3D multi‐echo spin echo sequence (TR/TE = 1000/7.9 ms; number of averaged experiments (NAE) = 2; experimental time 7 h). Final pixel size of the images was 23 × 23 × 31 µm after isotropic zerofilling. Following imaging, the hearts were paraffin‐embedded and serial sections (5 µm thick) of the aortic root were obtained. MR images were matched with the corresponding histopathology aortic root sections (n = 15) and examined for total plaque, cellular cap and lipid‐rich areas.
Results: The cellular‐rich cap, present on the luminal edge of the plaques in the aortic root (, yellow arrows), was clearly identified as a bright signal area on MR images. Cellular cap and also total plaque areas for MRM vs light microscopy (LM) were 0.15 ± 0.04 vs 0.10 ± 0.03 mm2 and 0.72 ± 0.12 vs 0.62 ± 0.13 mm2 respectively (mean ± SD). MRM was found to accurately determine both cellular cap area (r2 = 0.72, slope: 0.54) and total plaque area (r2 = 0.89, slope: 1.01) (P < 0.0001 for each). Lipid‐rich core areas in the plaque (, red arrows) appeared as a dark signal on MR images, the intensity range for which was assessed by image analysis software. MRM vs light microscopy (LM) lipid core areas (0.16 ± 0.03 vs 0.13 ± 0.04 mm2; mean ± SD) were also found to be accurately correlated (P < 0.0001, ).
Figure 1. LM & matched MRM images of aortic root plague in apo E‐/‐mice fed high fat diet for 20 wks (yellow arrows = cellular‐rich caps; red arrows = lipid‐rich regions). (View this art in color at www.dekker.com.)

Figure 2. Correlatin of LM and MRM lipid‐rich areas in aortic root plague of apo E‐/‐ mice fed high fat diet for 20 weeks. (View this art in color at www.dekker.com.)
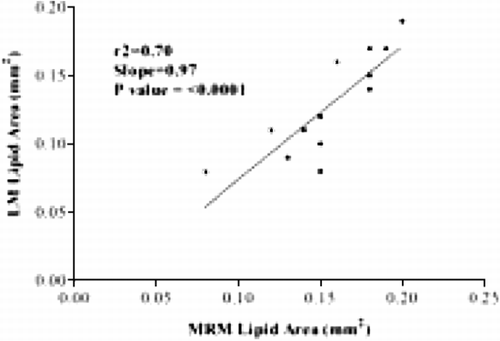
Conclusions: 1) To our knowledge, this is the first study to systematically quantify cellular caps and lipid‐rich cores in mouse atherosclerotic plaques using ex vivo MRM; 2) This will allow important plaque components to be quantified without recourse to histology; and 3) This may facilitate translation to in vivo imaging of mouse atherosclerotic plaque.
464. Characterisation of LV Mass and Function in Murine Dilated Cardiomyopathy Caused by MLP Deficiency, Using High‐Resolution Cine‐MRI
James R. Wilding,1 Juergen E. Schneider, PhD,2 A. Elizabeth Sang, PhD,1 Kay E. Davies, DPhil,3 Stefan Neubauer, MD,2 Kieran Clarke, PhD.1 1Physiology, Oxford University, Oxford, United Kingdom, 2Cardiovascular Medicine, Oxford University, Oxford, United Kingdom, 3Human Anatomy & Genetics, Oxford University, Oxford, United Kingdom.
Introduction: Mutation or ablation of the gene encoding muscle LIM protein (MLP) causes dilated cardiomyopathy in humans and mice, respectively.The MLP‐null mouse left ventricle (LV) has previously been characterised by M‐mode echocardiography, but LV mass and volumes have not been determined.
Purpose: To non‐invasively characterise LV morphology and function in young MLP‐/‐ mice in three dimensions using MRI.
Methods: High‐resolution cine imaging of 2–3 month old Sv129/B6 control and MLP‐/‐ mouse hearts (n = 6, both groups) was performed using an 11.7 T vertical MR system. Nine‐to‐eleven ECG‐ and respiration‐gated, contiguous 1 mm thick slices spanning the entire LV were acquired using a FLASH imaging sequence, with an in‐plane pixel resolution of 50 × 50 µm after image reconstruction. LV mass and volumes were derived from end‐diastolic and end‐systolic frames by segmentation.
Results: Representative images of control and MLP‐/‐ mouse hearts are shown in the . Compared with controls, LV mass‐to‐body weight ratio was 1.2.fold higher in MLP‐/‐ mice (3.5 ± 0.2 mg/g vs. 4.2 ± 0.1 mg/g, p < 0.01), end‐diastolic volume was 1.5‐fold higher (54 ± 2 µl vs. 81 ± 8 µl, p < 0.01) and end‐systolic volume was 3.4‐fold higher (18 ± 1 µl vs. 62 ± 9 µl, p < 0.0005). Compared with controls, cardiac ejection fraction was lower in MLP‐/‐ mice (66 ± 1% vs. 25 ± 5%, p < 0.0005), stroke volume was reduced (35 ± 1 µl vs. 20 ± 3 µl, p < 0.0005) and cardiac output was lower (17 ± 1 ml/min vs. 9 ± 1 ml/min, p < 0.0005).
Conclusions: MLP‐/‐ mice had LV hypertrophy, chamber dilation and heart failure. This data confirms the cardiac phenotype of the MLP‐/‐ mouse, and provides accurate quantification of LV mass and volumes in vivo.
465. A Preliminary Comparison of SSFP Cine Imaging at 1.5 T and 3 T
William Wince,1 Michael Paxten,2 Puneet Sharma,2 Josh Socolow,1 Stam Lerakis,1 Roderic Pettigrew,3 John Oshinski.3 1Medicine, Emory University, Atlanta, GA, USA, 2Biomedical Engineering, Georgia Tech, Atlanta, GA, USA, 3Radiology, Emory University, Atlanta, GA, USA.
Introduction: Recently, whole body 3 T systems have become available with dedicated cardiac phased array coils and advanced cardiac software. There is considerable enthusiasm surrounding the potential of 3 T to provide badly needed increased signal‐to‐noise (SNR) for cardiac applications. This enthusiasm is offset by potential problems of RF penetration, dielectric resonance, and increased effects of magnetic suceptability.
Purpose: The purpose of this study was to evaluate the change in signal‐to‐noise ratio (SNR) and contrast‐to‐noise ratio (CNR) between 1.5 T and 3 T in a series of normal volunteers using a steady‐state free procession (SSFP) cine sequence.
Methods: A series of 7 normal volunteers (5 males, 2 females, ages 22–37) were included in the study. Imaging at 1.5 T was done on a Philips Medical Systems Intera using a 5‐element cardiac array coil, and imaging at 3 T was done on a Siemens Medical Solutions Trio using an 8‐element torso array coil. For both scans, the coil was centered 2 cm above the sternal notch and this point was placed at the iso‐center of the scanner. For the 3 T scans, a non‐cardiac gated manual shim was preformed after scout scans on a volume encompassing the entire heart. The auto‐shimming routine was done at 1.5 T. After scout cans, vertical long axis (VLA) and mid‐ventricular short axis (SHAX) views were acquired using a SSFP cine sequence. All parameters was kept nearly the same between the 1.5 T and 3 T scanner (FOV = 360 mm, scan matrix = 256, slice thickness = 8 mm, flip angle = 40, bw = 625, cardiac phase interval = 50 msec). Signal‐to‐noise ratio (SNR) was calculated for the blood pool, the anterior wall and the inferior wall on both views at both fields. Contrast‐to‐noise ratio (CNR) between blood and myocardium was determined for the anterior and inferior walls on both views at both fields.
Results: Scans were successful at both fields on all subjects with no major suceptabilty or inhomogeneity artifacts (note that if the manual shim volume routine was not used at 3 T, artifacts did occur). SNR of the blood pool was 51 + /15 at 3 T and 36 + /5 at 1.5 T, an increase of 30% which was significant (p < 0.1). Differences in SNR between 3 T and 1.5 T also existed for the anterior wall of the myocardium in both the VLA and SHAX orientation. However, differences between fields were not significant in the inferior wall, . Averaged over all locations (anterior, posterior, VLA, SHAX),CNR between the blood and myocardium was 29 + 12 at 3 T and 24 ± 12 at 1.5 T, an increase of 17%. There was no significant variation in CNR between the anterior and posterior walls.
Conclusions: 3 T provides an increase in SNR and CNR for SSFP cine imaging of the heart. The increase in SNR appears to be dependant on the location within the body cavity. This could be due to differences in the receive coil sensitivity, dielectric resonance, or RF tissue interaction.
466. The Effect of Contrast Media on Blood and Myocardium T1 Values at 1.5 T and 3 T
Puneet Sharma,1 Josh Socolow,2 Salil Patel,2 Roderic I. Pettigrew,3 John N. Oshinski.3 1Biomedical Engineering, Georgia Tech, Atlanta, GA, USA, 2Department of Medicine, Emory University, Atlanta, GA, USA, 3Department of Radiology, Emory University, Atlanta, GA, USA.
Introduction: Gadolinium‐based contrast agents (e.g. Gd–DTPA–BMA) have the ability to reduce T1, which improves contrast between normal and infarcted tissue. The pharmacokinetics of these agents have been well documented, but their influence on T1 values at different field strengths, especially 3 T, have been limited. Empirical evidence has shown a field dependent increase in T1 of most biological tissues, but there is still question about the magnitude of increase under the influence of contrast media.
Purpose: This study compares T1 values of blood and myocardium at 1.5 T and 3 T following the administration of Gd–DTPA–BMA in normal volunteers. Particularly, we investigate whether T1 differences between 1.5 T and 3 T persist following contrast administration.
Methods: Ten healthy volunteers (6 male, 4 female, age 29.7 ± 4.7 yrs) were recruited for imaging at 1.5 T (Philips Intera) and 3 T (Siemens Trio) using cardiac phased array coils. Each subject was given either 0.1 mmol/kg (n = 5) or 0.2 mmol/kg (n = 5) of Gd–DTPA–BMA (Omniscan, Amersham). T1 measurements of blood and myocardium were performed prior to contrast injection using ECG‐gated inversion recovery (IR), single‐shot, balanced steady state free precession (b‐SSFP) sequences (five time points (TI = 400–1500 ms), FOV: 300 × 285 mm, 112 lines, 256 matrix, 8 mm thickness, TR/TE/a = 2.5 ms/1 ms/40°). T1 was determined from a least‐squared two‐parameter fit assuming mono‐exponential recovery. Following contrast injection, T1 was measured every five minutes for 35 minutes using two IR b‐SSFP sequences (FOV: 300 × 285 mm, 256 matrix, 42 lines/segment, 8 mm thickness, TR/TE/a = 3.1 ms/1.05 ms/40°, 3R–R intervals, scan time = 12 heartbeats) with TIs of 150 ms and 650 ms. T1 was calculated numerically from the ratio of intensity values of the two scans.
Results: Blood and myocardium T1 values pre‐ and post‐contrast at 1.5 T and 3 T are shown for 0.2 mmol/kg in . Pre‐contrast blood T1 values (n = 10) were not significantly different between 1.5 T and 3 T, despite a mean increase (1.58 ± 0.13 s and 1.66 ± .06 s, p > 0.05), but myocardium T1 values were significantly different between 1.5 T and 3 T (1.07 ± 0.03 s and 1.22 ± 0.07 s, p < 0.05). At all time points post‐contrast, mean T1 values between 1.5 T and 3 T were not distinguishable at either dose (p > 0.05) because of strong individual variance. shows that the difference in myocardial T1 due to field differences (T1 @ 3 T–T1 @ 1.5 T) decreased significantly after contrast administration. Conversely, the difference in blood T1 due to field differences remained the same post‐contrast, suggesting that the contrast agent affected blood T1 similarly at both fields, but not myocardial T1. Hence, there was a larger percent decrease in T1 for myocardium at 3 T compared to 1.5 T. These results were also consistent at 0.1 mmol/kg.
Table 1. T1 values (sec) at 1.5T and 3T
Conclusions: The present data shows: 1) a significant difference exists in the T1 of myocardium between 3 T and 1.5 T; 2) the difference in T1 of myocardium between 1.5 T and 3 T is reduced post contrast to a value that is not significantly different from zero; and 3) the difference in the T1 of blood between 1.5 T and 3 T is not significant before contrast and this does not change post‐contrast. Hence, contrast media had a larger T1 effect for myocardium at 3 T than 1.5 T; however, blood T1 effects remained relatively constant.
467. CMR in Transgenic Mice Demonstrates That the AT2 Receptor Mediates Most of the Benefit of AT1 Receptor Blockade Post‐MI
Szilard Voros, MD,1 Zequan Yang, MD, PhD,2 Robert S. Hopkins,1 Christina M. Bove, MD,1 Joseph M. DiMaria, BA,3 Wesley D. Gilson, MS,2 Frederick H. Epstein, PhD,3 Brent A. French, PhD,2 Stuart S. Berr, PhD,3 Christopher M. Kramer, MD.1 1Cardiology, University of Virginia, Charlottesville, VA, USA, 2Biomedical Engineering, University of Virginia, Charlottesville, VA, USA, 3Radiology, University of Virginia, Charlottesville, VA, USA.
Introduction: When applied in transgenic and knock‐out mice, CMR can be used to study the genetic mechanisms underlying LV remodeling after myocardial infarction (MI). Cardiac overexpression of the angiotensin II type 2 receptor (AT2‐R) attenuates remodeling. Some of the benefit of pharmacologic AT1‐R blockade post‐MI may be mediated through the AT2‐R pathway.
Purpose: We hypothesized that pharmacologic or genetic inhibition of the AT1‐R might provide additional attenuation of remodeling in the setting of AT2‐R overexpression, as defined by CMR.
Methods: We studied 3 groups of C57Bl/6 mice with cardiac overexpression of the AT2‐R, after MI was induced by 1 hour occlusion and reperfusion of the LAD; Group 1, Untreated mice (AT2, n = 14); Group 2, Mice treated with the AT1 receptor blocker losartan (25 µg/kg/day in drinking water) from day 1–28 post‐MI (LOS, n = 13); Group 3, Untreated mice, but null for the AT1a‐R (AT1a‐KO, n = 10). Systolic blood pressure (BP) and heart rate (HR) were measured weekly.
ECG‐gated cardiac MRI was performed at baseline and on days 1,7, and 28 post‐MI, using a 4.7 T imaging system (Varian 200/400 Inova MRI). Mice were anesthetized with 1% isoflurane and body temperature was maintained at 37°C. An ECG‐triggered multi‐phase FLASH cine sequence (12–14 phases/cardiac cycle) was performed in the short‐axis orientation, covering the heart from base to apex (6–8 contiguous slices) (TR 8 ms (∼ 90%of R–R interval), TE 3.1–3.9 ms, flip angle 20° (without contrast; baseline, day 7 and 28) and 60° (with contrast; day 1), slice thickness 1 mm, field of view (FOV) 2.56 cm, matrix 128 × 128). Endo‐ and epicardial borders were planimetered to determine end‐diastolic volume, end‐systolic volume and LV mass indexed to body weight (ESVI, EDVI and LVMI) and ejection fraction (EF).
Twenty minutes after injecting 0.3 mM/kg gadolinium‐DTPA, infarct size (IS) was measured on day 1 cine images as the mass of hyperenhanced myocardium, expressed as %LV mass.
Regional myocardial function was measured at each timepoint in 2 representative mid‐ventricular short axis slices using a six‐lobe SPAMM tagging sequence (TR 2 R–R intervals, TE 5.5 ms, flip angle 30°, slice thickness 1 mm, FOV 2.56 cm, matrix 192 [readout] × 96 [phase encode]; tag pulse flip angle 180°, tag spacing 0.7 mm). Percent circumferential shortening (%CS) was measured with Findtags software, using 12 sectors per slice. Proximity to the infarct border was used to define 3 zones as infarcted, adjacent or remote. Two‐way ANOVA confirmed intragroup differences by timepoint.
Results: IS (mean ± SE) was similar in AT2, LOS and AT1aKO mice (41 ± 3%, 41 ± 2%, 39 ± 2%, p = NS). HR was similar between groups, but BP was on average 12–14 mmHg lower in AT1aKO than AT2 and LOS at each timepoint (p < 0.03). Baseline volumetric parameters and changes in LVMI and EF over time were similar in all 3 groups. See for EDVI and ESVI. At day 28 post‐MI, EDVI and ESVI were lower in AT1aKO than AT2 and tended to be lower than LOS.
%CS in adjacent zone was similar between groups at all timepoints. On day 1, %CS was higher in AT1aKO than LOS in the infarct (0.05 vs. 0.02, p < 0.001) and remote regions (0.16 vs. 0.143, p = 0.016).
Conclusions: CMR demonstrates that pharmacologic blockade of AT1‐R is not additive to cardiac AT2‐R overexpression, but genetic knockout of the AT1a‐R further attenuates post‐MI LV remodeling, due in part to BP lowering. Preserved regional function early post‐MI due to the absence of AT1‐R may also contribute. The AT2‐R may mediate much of the benefits of pharmacologic AT1‐R blockade post‐MI.
468. Microsphere Validation of Slice Interleaved TSENSE Perfusion Imaging in Canines
G.S. Tilak, L. Hsu, A.H. Aletras, A. Natanzon, P. Kellman, A.E.Arai. Lce‐nhlbi, NIH, Bethesda, MD, USA.
Introduction: Existing MR first‐pass contrast perfusion methods possess limited spatial coverage when tracking the bolus during every heartbeat. Slice‐interleaved TSENSE perfusion is a new imaging method that can accelerate the acquisition time while maintaining comparable image quality. Validation is needed, however, to demonstrate that quantitative perfusion information remains accurate with this technique.
Purpose: The purpose of this study was to validate slice‐interleaved TSENSE perfusion imaging against ex‐vivo fluorescent microspheres.
Methods: Three canines underwent 90 minute LAD occlusion. Intravenous adenosine was administered to two of the animals. MR imaging was performed on a GE 1.5 T CVi scanner using a 4‐coil phased array knee coil. Perfusion images were acquired using a dual bolus Gd‐DTPA technique with concentrations of 0.0025 and 0.1 mmol/kg. A multi‐shot EPI FGRE sequence using slice interleaved TSENSE (Kellman P, et al. MRM 2003) was performed during contrast injection (MedRad Systems) with the following parameters: field of view = 28 × 14 cm2, matrix = 128 × 96, TE = 1.5 ms, TR = 7.2 ms, TI = 50 ms. Three to four 8 mm slices were acquired to cover the left ventricle during each heartbeat. Short axis slices were divided into 8 equally spaced sectors, and time intensity curves were generated for each sector. MR perfusion quantification was performed via Fermi model deconvolution. Following sacrifice, slices corresponding to MR images were sectioned into 16 segments. Absolute perfusion was quantified by fluorescent microsphere count (IMT labs, Irvine, CA). Myocardial blood flow by microspheres and MRI was compared from selected slices that contained both ischemic and normal segments.
Results: Perfusion by MRI and microspheres correlated closely (y = 0.97x + 0.60, R2 = 0.85). The Bland‐Altman plot shows a bias of 0.53 ml/min/g and a standard deviation of 0.51, consistent with slight overestimation of blood flow by MRI ( and ).
Figure 1. Myocardial blood flow measurements: x‐axis = microspheres, y‐axis = MRI. (View this art in color at www.dekker.com.)
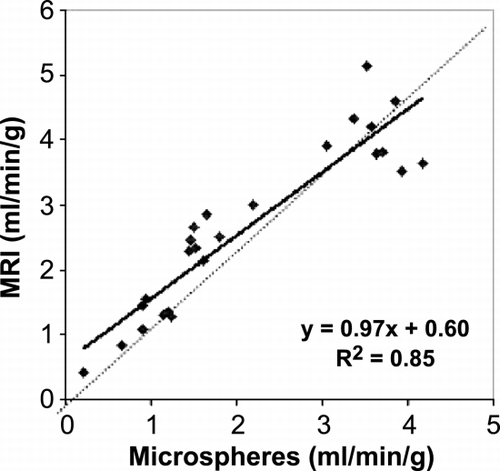
Figure 2. Bland‐Altman plot demonstrating agreement between the two methods: mean error = 0.53, stdev = 0.51. (View this art in color at www.dekker.com.)
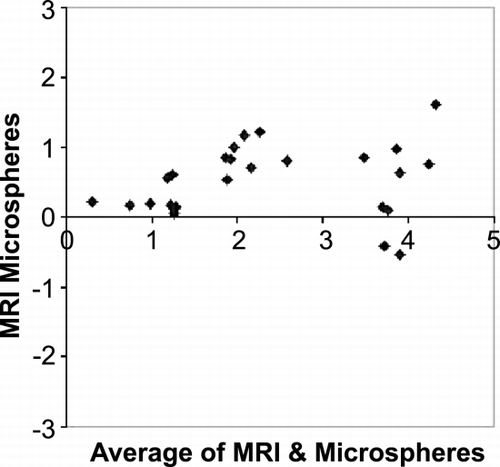
Discussion: In‐vivo perfusion quantification with slice‐interleaved dual‐bolus TSENSE agrees overall with ex‐vivo microsphere data. It is encouraging that image acquisition acceleration with parallel processing appears compatible with quantitative perfusion analysis. The slight overestimation by MRI needs to be studied further. A possible source for this discrepancy may be the TSENSE per se with only four coils. Future studies should investigate using 8 channel phased arrays to boost TSENSE performance.
469. Three‐Dimensional, Breath‐Hold, Contrast‐Enhanced Coronary MRA at 3.0 T
Xiaoming Bi, Debiao Li, Ph.D. Department of Radiology and Biomedical Engineering, Northwestern University, Chicago, IL, USA.
Introduction: Various contrast agents have been successfully used in coronary MRA at 1.5 T (Li et al., [Citation2001]). By administration of such T1 shortening agents, signal‐to‐noise ratio (SNR) and contrast‐to‐noise ratio (CNR) of coronary blood and surrounding myocardium were effectively improved. However, their use at 3.0 T has not been investigated.
Purpose: The purpose of this study is to evaluate the feasibility and performance of contrast‐enhanced magnetic resonance imaging of coronary arteries at 3.0 T using an extra‐vascular, paramagnetic contrast agent, Gd‐DTPA.
Methods: Five healthy volunteers were scanned on a Siemens 3.0 T scanner Tiro. A whole‐body radio frequency (RF) coil worked as both transmitter and receiver in four of these five studies and an 8‐channel cardiac phased array coil was used as receiver in the last study when it became available for our 3.0 T imaging system. A Medrad power injector was used for intravenous Gd‐DTPA (Magnevist, Berlex, 0.5 mol/L) injection.
Both the left anterior descending coronary artery (LAD) and right coronary artery (RCA) were imaged using a segmented three‐dimentional, cardiac gated, breath‐hold FLASH (Fast Low Angle SHot) sequence. Imaging parameters included: TR/TE = 4.1/1.7 msec, FOV = 237 × 380 mm2, 31–35 lines per cardiac cycle, matrix size = (124–138) × 512, slab thickness = 18 mm, number of partitions = 6 (12 after sinc‐interpolation), readout bandwidth = 420 Hz/pixel. Flip angle was 15° before contrast agent injection and 22° for post‐contrast images.
20 ml of Gd‐DTPA were injected at a rate of 1 ml/s for the contrast‐enhanced studies. A non‐selective inversion pulse was applied to null myocardium signal before data acquisition and the inversion‐recovery time (TI) was set to be 400 ms based on computational simulation. A test bolus (2 ml) was run to match the data acquisition window with the first pass of contrast agent.
Images were acquired both before and after contrast agent injection. Coronary artery SNR and CNR were measured and data were presented as mean ± standard deviation. Comparisons between different data sets were performed using a paired t‐test. P‐values less than 0.05 were considered significant.
Results: With contrast agent injection, vessel delineation was markedly improved as compared to pre‐contrast images. shows LAD images from two healthy volunteer using a whole body coil and a cardiac phased array coil. For the 4 volunteers with the body coil, SNR and CNR were 21.1 ± 8.8/8.7 ± 6.8 before contrast and 22.7 ± 9.3/20.7 ± 9.2 after contrast. No significant difference was observed between pre‐ and post‐contrast images (P = 0.474). CNR was increased by 188% and the difference is significant with P = 0.007. In the study with the phased array coil, SNR and CNR were enhanced by 44.8% and 140.7% with contrast agent injection (SNR and CNR were 41.7/21.6 before contrast and 21.6/52.0 after contrast).
Figure 1. LAD images from two healthy volunteers using a whole body coil (a, b) and a cardiac phased array coil (c, d), respectively. a). Pre‐contrast image. b). Post‐contrast image of the same volunteer using body coil. c). Pre‐contrast image of another volunteer using phased array coil. d). Post‐contrast image using phased array coil. Note CNR and vessel delineation were consistently improved in the contrast agent first‐pass images.
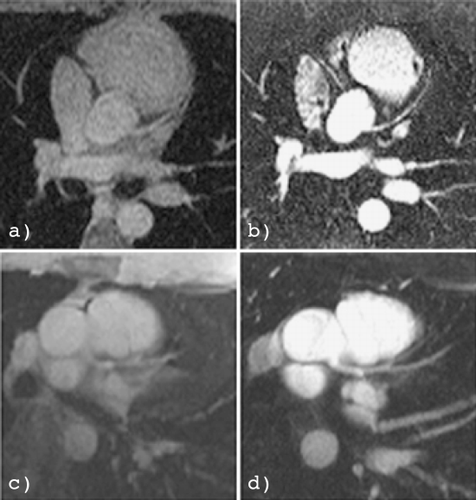
Conclusions: Gd‐DTPA has been successfully used for contrast enhanced, breath‐hold, three‐dimensional coronary imaging at 3.0 T. A markedly improvement was achieved in the delineation of coronary arteries with the administration of the T1 shortening agent. The contrast between myocardium and coronary blood is consistently improved in the first pass coronary artery images at 3.0 T.
470. Imaging of Tuned Fiducial Markers with Interleaved Sequences for Passive Catheter Tracking
Marc E. Miquel, PhD,1 Sanjeet Hegde, MBBS,1 Redha Bourbektah, PhD,1 David Gilderdale, PhD,2 Ian Young, PhD,2 Reza Razavi, MBBS,1 Stephen Keevil, PhD,1 Derek Hill, PhD.1 1Division of Imaging Sciences, King's College London, London, United Kingdom, 2Imperial College, London, United Kingdom.
Introduction: We have established a programme of Magnetic Resonance guided cardiac catheterisation in a XMR facility at Guy's Hospital, London (Citation[Razavi et al.]). However, an important obstacle to clinical MR guided endovascular procedures is the current lack of CE marked or FDA approved catheters and guide wires designed for MRI guided cardiac catheterization. Our clinical programme, therefore, makes use of passive visualization of standard interventional devices (Miquel et al., [Citation2003]). Although, it has been possible to carry out clinical procedures partly or totally under MR guidance on 30 patients, catheter visualization could be improved. For example, the visibility of CO2 filled‐balloon tip of the catheter can become poor due to partial volume effects when thick slices are required to cover tortuous vessels. There is also a risk of forming knots as only the tip of the catheter and not the whole length is visualised. Consequently, incorporating a marker with good MR visibility in the catheter would greatly improve real time position monitoring of interventional procedures. Prototypes of a suitable fiducial marker comprising a tuned circuit around a small NMR signal source which allows direct visualization of the signal source within a MR image have been reported (Burl et al., [Citation1996]; Kuehne et al., [Citation2003]). For our protocols it would be a major advantage to design a catheter which could combine such a marker and our current visualization techniques. The fiducial markers would need to be visible in our current or similar imaging protocols which include real‐time and interactive Steady State Free precession (SSFP) imaging. This abstract presents the preliminary work on the fiducial marker.
Methods: The fiducial marker was composed of a tuned single winding (12 turns) surrounding a small cell (3 mm internal diameter) containing a short T1 (≈ 30 ms) solution. It was placed at 0°, 45° and 90° to B0 and imaged using a head coil in a 1.5 T Philips Intera scanner (Philips Medical Systems, Best, the Netherlands). With this marker a 4° main field pulse excitation results in about a 90° rotation in the fiducial sample. We developed two real‐time imaging sequences which interleaved an image with a smaller flip angle (1° or 2°) every 5 or 10 images: Fast Field Echo (TE1 ms, TR4. ms, α = 70°) and SSFP (TE1.45 ms, TR2.9 ms, α = 50°). The FFE sequence was also used in interactive mode which allows manipulation of the slice plane and other imaging parameters during scanning.
Results: For both sequences the flickering of the marker allowed good visualization. However, for the balanced‐FFE sequence interleaving the flip angles leads to loss of steady state contrast and hence a reduced background signal (). Although, it was still possible to clearly visualize the background “anatomy”, this problem will be exacerbated in‐vivo due to off‐resonance created by flow and cardiac motion. The marker demonstrated the expected loss of signal when the axis of the winding was moved from perpendicular to parallel to the main field. The orientation dependence can be overcome by using quadrature coils or a pair of tuned markers as recently proposed (Kuehne et al., [Citation2003]).
Conclusions: We imaged tuned fiducial markers using interleaved sequences for real time and interactive scanning. This allowed easier visualization than our current passive tracking technique (Miguel et al., 2003). By manufacturing smaller markers it should be possible to incorporate the markers in an angiographic balloon catheter and hence use both techniques concurrently.
Using tuned fiducial markers and interleaved sequences it may also be possible to achieve automated detection of a catheter tip without the safety issues of active tracking and the lower reliability of passive tracking.
471. High‐Resolution Cardiac Cine‐MR‐Imaging of the Murine Right Ventricle: Methodological Validation and Results from a New Mouse Model of Right Ventricular Failure
Alex Frydrychowicz,1 Judith Rautenberg,1 Lisa Bauer,1 Kai Hu,1 Stefan Neubauer,2 Eberhard Rommel,3 Frank Wiesmann.1 1Medizinische Klinik, Universitaet Wuerzburg, Germany, 2Dept. of Cardiovascular Medicine, University of Oxford, Oxford, United Kingdom, 3Physikalisches Institut, Universitaet Wuerzburg, Germany.
Introduction: The importance of the right ventricle (RV) in the development of heart failure has been underestimated for a long time. However, studies in patients with myocardial infarction showed that involvement of the right ventricle was a strong and independent prognostic factor. With the advent of new transgenic mouse models of cardiomyopathy, the consequences of genetic defects on the right heart can be systematically investigated. Whereas high‐resolution magnetic resonance imaging (MRI) has proved highly accurate for the quantification of left ventricular (LV) volumes and function in mice, assessment of the right ventricle is by far more difficult due to the complex geometry and contractional motion of the RV.
Purpose: To assess 1) the feasibility and accuracy of high‐resolution MR imaging in mice, 2) to test for the reproducibility of MRI for murine RV volume quantification, and 3) to apply the MR technique to a new mouse model of right ventricular failure.
Methods: For validation of RV volume quantification and evaluation of measurement reproducibility, 13 healthy mice of different age and weight were investigated. To induce right ventricular failure, pulmonary banding against a 25 G needle was performed in a subgroup of mice (n = 5). Mice were given 4 weeks to recover from the operation and to develop heart failure. MR cine FLASH imaging was done on a 7.05 T experimental MR scanner (BRUKER Biospec, Germany) equipped with a microscopy gradient insert. Multiple contiguous imaging planes were acquired orthogonal to the ventricular septum to allow for accurate quantification of both RV and LV volumes. Cine MR imaging parameters were TR 9.6 ms, TE 1.5 ms, in‐plane resolution (117 µm)2 with slice thickness of 1 mm.
Volume calculation was achieved by determining end‐systolic and end‐diastolic slices in every plane. Endocardial and epicardial borders were manually delineated for both left and right ventricle and added up for total ventricular volume (). MR data analysis was repeatedly done by two independent observers for evaluation of intra‐observer and inter‐observer variability.
Figure 1. Delineation of epicardial and endocardial contours in both ventricles at diastole (a, c) and systole (b, d) in a mid‐ventricular (a, b) and basal plane (c, d).
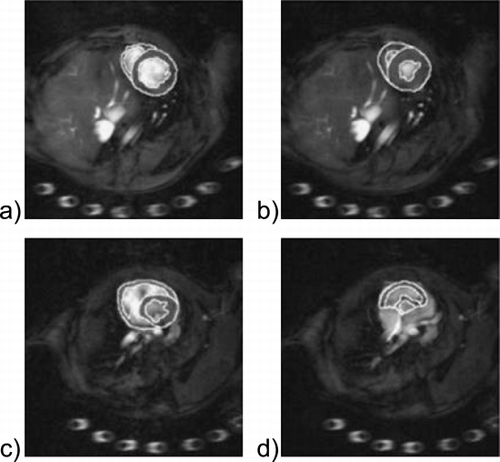
Results: MR measurements of RV cavity volume was feasible in all mice studied. MRI revealed close correlation between LV and RV stroke volume and cardiac output (for both r = 0.97, p < 0.0001). Bland‐Altman analysis revealed a mean difference of 0.4µl between LV and RV stroke volume with close limits of agreement (± 4.2 µl). Furthermore, repeated measurements of RV parameters revealed a high level of reproducibility for both intra‐observer and inter‐observer comparisons ().
Table 1. Absolute and relative interobserver and intraobserver variability
MR studies in mice after pulmonary banding revealed a significant increase in right ventricular end‐diastolic volume (84.5 ± 13.6 µl vs. control 36.4 ± 3.0 µl, p < 0.0001) and end‐systolic volume (121.4 ± 9.8 µl vs. control 84.1 ± 3.5 µl, p < 0.005). There was a significant reduction in RV ejection fraction EF (31.2 ± 6.2% vs. control 57.0 ± 2.3%, p < 0.001), indicating overt right ventricular failure. Comparison between mice with pulmonary banding and controls showed differences for LV parameters such as EDV, ESV, SV and EF.
Conclusions: We were able to demonstrate the feasibility of high‐resolution MRI for quantitative assessment of the murine right ventricle with high accuracy. Inter‐observer and intra‐observer validation of this method showed low measurement differences which enabled us to successfully transfer this technique on a new model of right heart failure. These findings open promising perspectives to further investigate RV changes both in healthy mice as well as in genetically or surgically engineered mice. This might lead to a better understanding of pathophysiological mechanisms involved in the development of RV dysfunction.
