Abstract
Shaped metal deposition is a novel technique to build near net-shape components layer by layer by tungsten inert gas welding. Especially for complex shapes and small quantities, this technique can significantly lower the production cost of components by reducing the buy-to-fly ratio and lead time for production, diminishing final machining and preventing scrap. Tensile testing of Ti-6Al-4V components fabricated by shaped metal deposition shows that the mechanical properties are competitive to material fabricated by conventional techniques. The ultimate tensile strength is between 936 and 1014 MPa, depending on the orientation and location. Tensile testing vertical to the deposition layers reveals ductility between 14 and 21%, whereas testing parallel to the layers gives a ductility between 6 and 11%. Ultimate tensile strength and ductility are inversely related. Heat treatment within the α+β phase field does not change the mechanical properties, but heat treatment within the β phase field increases the ultimate tensile strength and decreases the ductility. The differences in ultimate tensile strength and ductility can be related to the α lath size and orientation of the elongated, prior β grains. The micro-hardness and Young’s modulus are similar to conventional Ti-6Al-4V with low oxygen content.
Introduction
The manufacturing of titanium alloy components by traditional methods is costly due to the demanding machinability and the high material prices. Especially for complex shapes and small quantities, the fabrication of net shape components by additive layer manufacturing can reduce the costs by omitting extensive machining and production of scrap. Several techniques are considered, including direct laser fabrication [Citation1–10], electron beam freeform fabrication [Citation11–13] and tungsten inert gas welding [Citation14–16]. The technique used in this paper is shaped metal deposition (SMD), which is a net shape tungsten inert gas welding process patented by Rolls-Royce.
The microstructure and hence the mechanical properties of titanium alloys are very sensitive to the fabrication scheme and the thermal history [Citation17–19]. The SMD process repeatedly subjects a component to high temperatures and high cooling rates. The layer by layer manufacturing makes the part intrinsically anisotropic. Therefore, the microstructure of the SMD components should differ from those prepared with conventional techniques. Hence, the question arises how good are the mechanical properties of SMD Ti alloy components, and whether they are competitive with those of conventionally fabricated material. This topic is investigated here for Ti-6Al-4V, which is one of the most commonly used titanium alloys. This is an α+β alloy; therefore, for most fabrication schemes, it consists at room temperature of two phases: hexagonal closed packed α and body centered cubic β [Citation17].
Experimental details
Shaped metal deposition
The SMD cell consists of a tungsten inert gas welding torch attached to a 6-axis Kuka robot linked to a 2-axis table. The tungsten inert gas welding is performed with a Ti-6Al-4V wire with a diameter of 1.2 mm. The whole setup is enclosed in an airtight chamber filled with an inert gas (Ar, 99.999% purity) that reduces oxygen and nitrogen contamination of the final product: An oxygen content of 0.16 wt.% and a nitrogen content of 0.0041 wt.% are determined by instrumental gas analysis of the final product. These values are similar to the ones reported for the wire by the supplier (South Yorkshire Welding and Engineering Supplies): between 0.142 and 0.173 wt.% for oxygen and between 0.003 and 0.009 wt.% for nitrogen. More details about the cell can be found elsewhere [Citation16].
The tubular components are built layer by layer with a squared base of side length s, wall thickness t and height h (figure ). The wall thickness and surface finish in particular are controlled by the electrical current, travel speed and wire feed rate. Travel speed is the resultant of the rotation and tilting of the table and the movement of the robot. Two different components, A and B, were prepared with deposition parameters and dimensions given in table .
Figure 1 Shaped metal deposition scheme, showing a component with side length s, the welding head, the wire, the coordinate system (x, y, z: directions of the welding head movement relative to the component, wall thickness t and height h), and the location and orientation of tensile specimens.
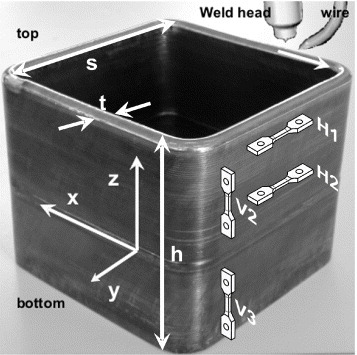
Table 1 Deposition parameters of components A and B and resultant geometry.
Tensile testing
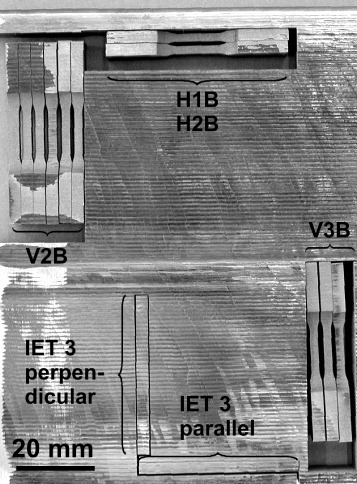
The tensile specimens have a flat dog-bone shape with a gauge length of 10 mm and a 3×2 mm2 cross-section within the gauge length (for schematic drawings, see figure ). Different tensile specimens were prepared from components A and B, in order to investigate the influence of location and orientation. Location and orientation of some of the tensile specimens cut out from component B can be seen in figure (also indicated schematically in figure ). The very top region of a component is denoted with location 1. As shown later, this region has a different microstructure than regions farther down. Location 2 comprises a tested region between 1 and 5 cm, and location 3 a region more than 8 cm below the top. The different orientations are designated with H and V, standing for specimens with tensile direction horizontal (H) and vertical (V) to the deposition plane. Accordingly, label H1A denotes a specimen of component A from location 1 with tensile direction horizontal to the deposition plane.
Figure 2 Side view on component B with cut out tensile and impulse excitation technique (IET) specimens, indicating their location and orientation.
Some specimens were heat treated in vacuum (better than 2.6×10⁻⁵ mbar) for 2 h at 900 °C or at 1040 °C and cooled inside the furnace (Brew; Thermal Technology GmbH, Bayreuth, Germany) at a rate between 1 and 4 °C s−1 within the first 100 °C. The heat treatment at 900 °C, i.e. within the α+β phase field, was performed to study the effect of stress relief, whereas annealing at 1040 °C, within the β phase field, was intended to show the consequence of homogenization.
The following number of specimens with different orientations and locations, derived from the two components A and B, were tested at room temperature: two H1A, one H1B, three H2A, one H2B, 12 V2B (four heat treated at 900 °C and four at 1040 °C) and three V3B. Furthermore, four V2B specimens were tested at a temperature between 190 and 700 °C.
The tensile tests were performed in an Instron testing machine (TTDL model with a maximum load of 100 kN) with a displacement rate of 0.5 mm min−1. Beside room-temperature tests, some experiments were performed at elevated temperatures in vacuum, employing the Brew furnace described above. Because strain controlled tensile testing was not possible, and the relation between displacement and strain was not known, in one experiment, the strain was measured optically, applying digital image correlation technique (Limess 4.7, Limess, Pforzheim, Germany). The ductility was determined by measuring the length of the two parts of the fractured specimens.
Characterization
The microstructure was investigated by scanning electron microscopy (SEM, FEI XL30FEG) of the polished cross section. Backscattered electron imaging with very high contrast allows discerning the α and β phases without additional etching.
Vickers micro-hardness was measured with a Leitz micro-hardness tester with a load of 100 g on polished cross sections. Many indents were performed on every cross-section (y–z planes) in order to obtain reasonable statistics and information on possible changes over the component height. The dynamic Young’s modulus of component B was measured at room temperature by the impulse excitation technique [Citation20, Citation21]. Bars were investigated from locations 2 and 3 with length axis parallel or perpendicular to the deposition plane.
Results
Tensile testing
The tensile deformation curves show extensive plastic deformation with limited work hardening (figure ). The Young’s modulus derived from this experiment is 71 GPa for stresses between 500 and 800 MPa. This value is lower than the one derived by impulse excitation technique, which gives a room temperature value of 117±1 GPa for component B, independent of the orientation and location. The Young’s modulus deduced from tensile tests is generally considered less reliable than that from dynamic methods like the impulse excitation technique, due to the larger experimental error and the difficulty to reckon with the influence of the set-up tensile tests.
Figure 3 Tensile stress-strain curve of a V2B specimen. For comparison, the slope is drawn for a Young’s modulus of 117 GPa, as derived by the impulse excitation technique.
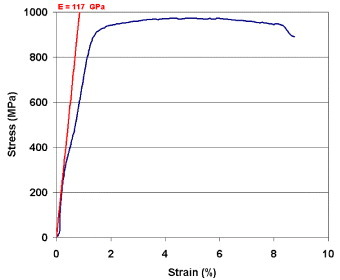
Figure (a) shows the ultimate tensile strength and figure (b) the ductility at room temperature for different orientations and locations. Naturally, the data show some scatter, but on average, the ultimate tensile strength of specimens with H orientations is slightly higher (983±22 MPa) than of specimens with V orientation (953±14 MPa). The results from specimens derived from components A and B are put together in the columns H1 and H2, as no significant difference is observed between these two charges. Discerning in more detail between different locations, specimens with H orientation show higher ultimate tensile strength for location 1 than for location 2. Furthermore, for specimens with V orientation, the ultimate tensile strength is slightly smaller at location 2 than at location 3.
Figure 4 Ultimate tensile strength (UTS) (a) and ductility (b) for specimens with differences in location, orientation and heat treatment.
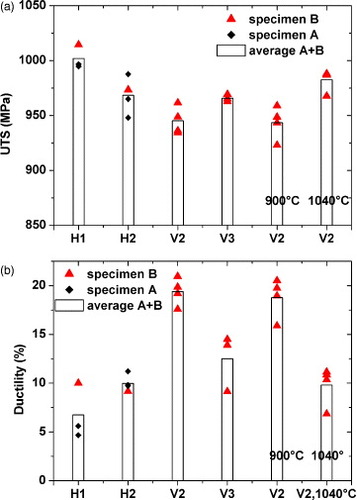
Whereas the ultimate tensile strength depends only slightly on the orientation and location, the ductility is very sensitive to these factors. The ductility is significantly smaller for H oriented than for V oriented specimens, and is the smallest (5.1%) for the H1A specimen. For the V oriented specimens, also a spatial dependence of ductility is observed. Ductility is highest at location 2 (19.1%), in comparison with 12.5% for location 3.
The ultimate tensile strength and the ductility of specimens heat treated at 900 °C are similar to the ones of as-fabricated V2 specimens (figure ), indicating that this heat treatment does not change the properties. However, the heat treatment at 1040 °C increases the ultimate tensile strength and decreases the ductility significantly.
To conclude, the properties are sensitive to location, orientation and also to heat treatment, if the temperatures are high enough. Ultimate tensile strength and ductility show an inverse relation.
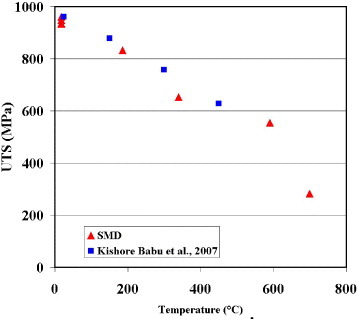
Some specimens were also tested at elevated temperatures. With increasing temperature, the ultimate tensile strength decreases in compliance with results from α–β processed and mill-annealed Ti-6Al-4V material (figure ) [Citation22].
Figure 5 Ultimate tensile strength (UTS) versus temperature for SMD specimens in comparison with values from α–β processed and mill annealed Ti-6Al-4V material [Citation22].
Morphology and microstructure
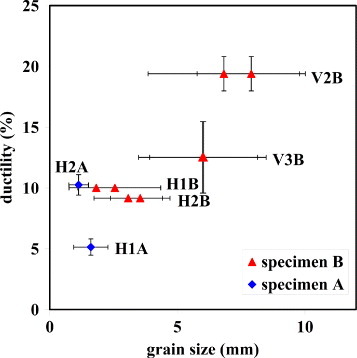
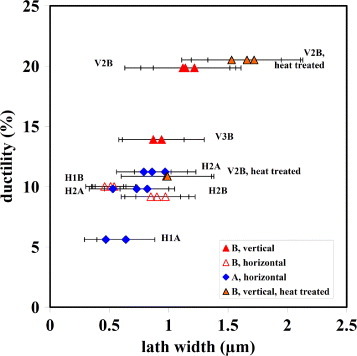
Viewed from the side, the surfaces of the components exhibit a layered structure from the welding and also show large, elongated grains (figure ). These grains were growing epitaxially, inclined in a direction to the layers following the temperature field resulting from the moving welding torch. Presumably, these elongated grains are prior β grains. Their average grain size is estimated from the appearance on the component surfaces. The width in horizontal and vertical directions is used to characterize the size of the elongated grains, since these directions are especially relevant for the ductility of tensile testing. This is shown in figure by plotting these grain sizes in relation with the ductility of tensile specimens derived from the respective region with the respective tensile direction. Because of the variation in grain sizes, the standard deviation is rather large. Yet, it can be summarized that the grain sizes are smaller in horizontal than in vertical direction, and that the ductility increases with the grain size in the tensile direction. The grain size perpendicular to the tensile directions is about 1–4 mm. Much larger grain sizes are expected in the tensile specimens heat treated at 1040 °C. Yet, due to the small sizes of the tensile specimens, a conclusive grain size determination is not possible, and usually only one grain within the gauge length must be assumed.
Figure 6 Side view on the surface of component A, exhibiting shaped metal deposition layers and large elongated grains.
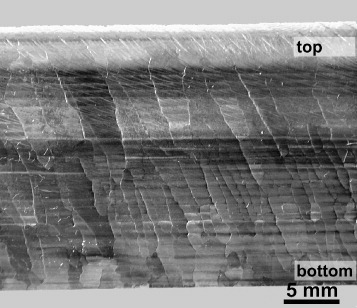
Figure 7 Average grain size of prior β grains, derived from their appearance on the component surfaces and measured in horizontal and vertical directions, set in relation with the ductility of specimens from the respective region and with the relevant orientation. The error bars give the standard deviation.
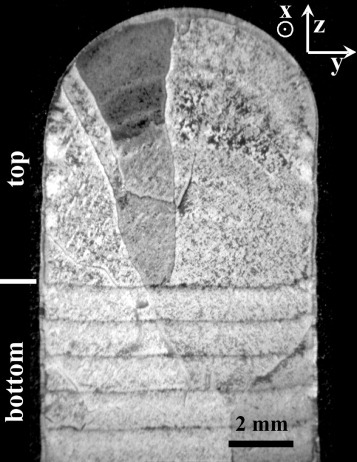
The SMD components exhibit in cross section two differently appearing regions: a bottom region, which is characterized by bands parallel to the base plate, and a top region, where these parallel bands are absent (figure ). The height of these top regions is not very sensitive to the height of the whole component, and it is given in table . The large, elongated grains, visible on the walls of the components (figure ), are also apparent in this cross-section, but are cut aslant and therefore appear more equiaxed (figure ).
Figure 8 Etched cross-section (y–z plane) of the upper part of component B exhibiting the top region without and the bottom region with bands parallel to the base plate.
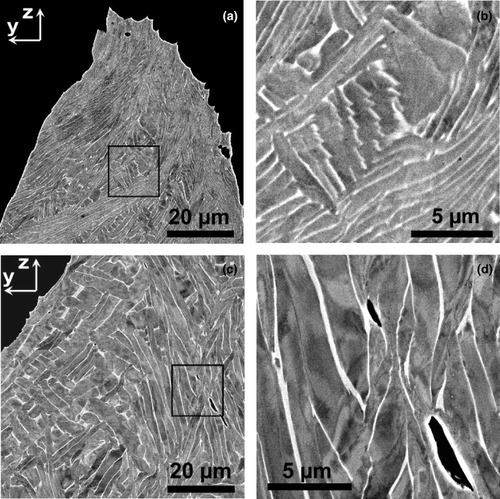
The microstructure in both regions consists of α phase laths in a β matrix (figure ), but their morphology is different in both regions. The top region displays mostly colonies of parallel, very fine needles (figures (a) and (c)), whereas the bottom region consists of thicker laths (figures (b), (d)–(f)). These laths frequently form a so-called ‘basket weave’; Widmanstätten morphology [Citation18], with interleaving α laths exhibiting a triangular or quadrangular symmetry. In addition, colonies consisting of bundles of α laths can be observed. They habitually grow from prior β grain boundaries, which are still visible because they are decorated by an α phase ligament (for example, in the top of figure (c)).
Figure 9 Microstructure of tensile specimens from component A and component B with different orientations and from different locations. (a) H1A, (b) H2A, (c) H1B, (d) H2B, (e) V2B and (f) V3B.
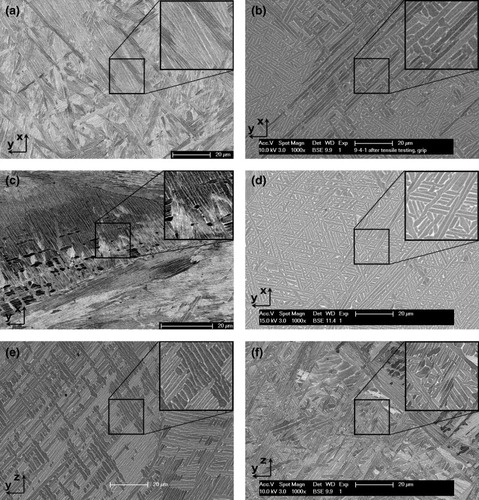
The microstructure and the peculiar morphology of SMD components are described and explained in more detail elsewhere [Citation16]. In short, the top region represents the area which was within the β phase field during the very last deposition. Because of the fast cooling after the last deposition, this region is in the two-phase field regime only for a short time, leading to fine α needles within a β matrix (figures (a) and (c)). In contrast, the bottom region was subjected to repeated heat treatments within the α+β phase field by subsequent welding steps, which leads to a further diffusional partitioning of the α- and β-forming atoms and therefore to the coarsening of the α laths (figures (b), (d)–(f)). The parallel bands (figure ) derive from the β/α+β transus lines during subsequent welding steps.
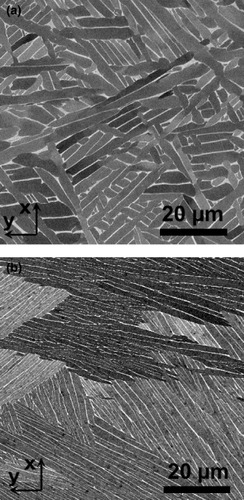
The heat treatment at 900 °C, i.e. within the α+β phase field, followed by furnace cooling, resulted in a thickening of the ‘Widmanstätten’ laths (figure (a)). However, the heat treatment at 1040 °C, i.e. within the β phase field, followed by furnace cooling, produced a fine structure with bundles of α laths (figure (b)). Furthermore, due to the growth of the β grains during this heat treatment, the number of prior β grains within the gauge length is very small.
Figure 10 Microstructure of V2B specimens after heat treatment at 900 °C (a) and 1040 °C (b).
In figure , the apparent lath widths, determined from micrographs of tested tensile specimens, is related with the ultimate tensile strength of these specimens. For every micrograph, approximately 100 laths were measured and the average was calculated. The variation of lath width within one specimen is rather large. Yet, it can be stated, that the ultimate tensile strength roughly is inversely proportional to the lath width.
Figure 11 Relation between ultimate tensile strength (UTS) and lath width (one data point derives from one micrograph and about 100 width measurements).
The severe deformation of the tensile testing leads to significant changes in the microstructure. The α laths are frequently lengthened and bended indicating their plasticity (figures and ). Sometimes, shearing of unfavorably oriented laths is observed (figure (b)). Pore formation at laths interfaces due to the deformations is also detected (figure (c) and (d)).
Figure 12 Microstructure in the plastic zone of H1A (a) and H2A specimens after fracture (vertical=tensile direction).
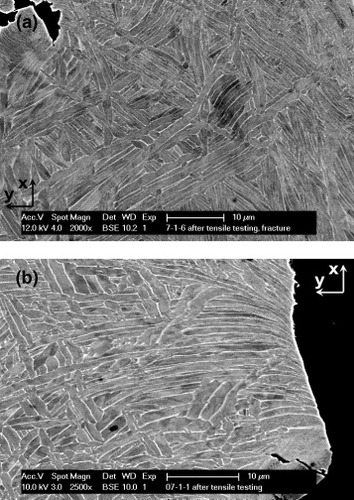
Figure 13 Microstructure in the plastic zone after fracture (vertical=tensile direction) of V2B specimens, as fabricated (a, b) and after heat treatment at 900 °C (c, d). Boxes in (a) and (c) indicate magnified areas of (b) and (d).
Vickers hardness
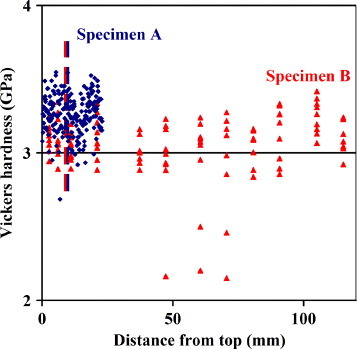
The micro-hardness shows a certain scatter for both components, yet no obvious dependence on the wall height (figure ). The average micro-hardness is 3.26±0.14 GPa for component A and 3.05±0.25 GPa for component B. Generally, for most materials the ultimate tensile strength and hardness are linearly related. However, in the present case, the spatial variation of the ultimate tensile strength (figure (a)) is too weak for an observable hardness dependence (figure ).
Figure 14 Vickers hardness (y–z plane) of component A (✦) and B (▴) versus the distance from the top (z-direction). The respective borders between top and bottom region are indicated.
Discussion
According to Lütjering [Citation19], the effective slip length determines the mechanical properties of Ti alloys with fully lamellar microstructure. In the case of α laths separated by the β phase, it is assumed that the width of the α laths determines the effective slip length. Lütjering states that the yield stress decreases with increasing slip length. Since in the present case little work hardening is observed (figure ), also the ultimate tensile strength should decrease with the lath width. This inverse relation between ultimate tensile strength and lath width agrees with the experimental results (figure ).
The ductility appears to depend on several factors. One observation is that high ultimate tensile strength values correlate with low ductility (figure ), the other that the ductility depends on the orientation relative to the deposition (figure ). The first observation is in agreement with [Citation19], which reports, in case of high cooling rates, an abnormal, inverse correlation between the ultimate tensile strength and ductility.
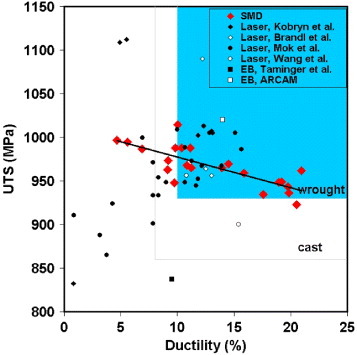
Figure 15 Correlation between ultimate tensile strength (UTS) and ductility for components fabricated by different additive layer manufacturing: SMD, laser deposition [Citation1, Citation7, Citation9, Citation10] and electron beam freeform fabrication [Citation12, Citation13]. The shaded areas indicate minimum requirements of cast (ASTMF1108) and wrought material (ASTM F1472). The line shows the linear regression for the SMD data.
The orientation dependence of higher ductility in specimens with V orientation, compared to specimens with H orientation, must be attributed to the shape of the elongated, prior β grains growing roughly in the vertical direction (figure ). Due to the orientation of these elongated grains, the grain size in horizontal direction is smaller than in vertical direction (figure ). Therefore tensile specimens with H orientation contain a higher amount of grain boundaries than specimens with V orientation. Because grain boundaries are potential sources of failure, the H orientation may lead to a lower ductility compared to the V orientation. For both orientations perpendicular to the tensile direction, the size of the tensile specimens (cross section=3×2 mm2) and the size of the elongated prior β grains (∼1–4 mm) are comparable. Therefore, an influence of the grain size perpendicular to the tensile direction cannot be observed.
Similar to the results reported for laser deposition [Citation1], the strength is slightly higher in horizontal than in vertical direction to the deposition plane (figure ). Yet, in case of the SMD specimens, the difference between the two directions is much smaller. Furthermore, in contrast to [Citation1], the ductility of SMD specimens is higher in V direction than in H direction because of no lack-of-fusion porosity in the SMD case.
The Young’s modulus measured for the SMD specimens agrees very well with values reported in literature for bulk Ti-6Al-4V [Citation17]. In addition, no orientation dependence of the Young’s modulus is observed. Therefore, we can exclude anisotropic lack-of-fusion porosity like observed for some components fabricated by laser deposition [Citation1]. This agrees with metallurgical investigations, where only very few and round pores were observed.
It is interesting to note that the lath width is larger in V2B than in V3B (and V1B) specimens. The different lath widths must be attributed to the temperature at certain regions during the SMD process. If the temperature is within the α+β phase field then the laths grow. The large metal deposition plate acts as a heat sink, and material closer to the plate experiences less time at temperatures high enough for lath growth than material farther away. This difference in lath width is reflected in the ultimate tensile strength being larger for V3B than for V2B specimens (figure ).
The hardness of Ti-6Al-4V is very sensitive to contaminants like oxygen and nitrogen. For example, for an oxygen content of 0.56 wt.% a hardness of 3.70 GPa and for an oxygen content of 0.26 wt.% a hardness of 3.05 GPa is reported [Citation23]. The hardness and the ultimate tensile strength of the as-fabricated SMD components agree with values reported for an α+β quenched Ti-6Al-4V alloy with an oxygen content of 0.26 wt.% [Citation23]. This is in good accordance with the low oxygen (and nitrogen) content of an SMD component measured by instrumental gas analysis (0.16 wt.%) and suggests negligible contamination during the SMD.
Applications of SMD depend on its competitiveness to other techniques. It is clear that SMD allows to cut production and material costs and to reduce development and lead times. But also the performance of the components must be compared among the competing techniques. Such a comparison is given in figure , where in an ultimate tensile strength/ductility plot the shaded areas indicate the ASTM minimal requirements for wrought and cast material. All specimens, apart from those from the very top location tested in horizontal direction (H1), fulfill these minimum ASTM requirements of cast Ti-6Al-4V, and many satisfy even the more severe ASTM requirements for wrought material. In comparison with components from other additive layer manufacturing techniques like laser deposition [Citation1, Citation7, Citation9, Citation10] and electron beam freeform fabrication [Citation12, Citation13], most ultimate tensile strength values of SMD specimens are competitive (figure ). Laser deposition may result in components with much higher ultimate tensile strength values in horizontal direction (1066 MPa). Yet, these specimens have weaker strength perpendicular to the deposition plane (832 MPa) due to lack-of-fusion porosity. This necessitates hot isostatic pressing, which homogenized but also significantly reduced the overall ultimate tensile strength [Citation1]. The ductility is similar or better for SMD than for other deposition techniques.
Conclusions
Shaped metal deposition produces net shape Ti-6Al-4V components with mechanical properties competitive to other additive layer manufacturing and, to some extent, to cast or wrought materials. The ultimate tensile strength varies between 936 and 1014 MPa, depending mainly on the orientation and location of the specimens. The ductility of specimens with tensile direction vertical to the deposition plate, generally between 14 and 21%, is two to three times larger than the one of specimens with tensile direction parallel to the deposition plate. The ultimate tensile strength is inversely proportional to the ductility. No significant difference in the mechanical properties is observed for components A and B. Heat treatment within the α+β phase field, followed by furnace cooling, does not change the properties, whereas heat treatment within the β phase field increases the ultimate tensile strength and decreases the ductility. The differences in the ultimate tensile strength and ductility can be related to the α lath size and to the orientation of the elongated, prior β grains. The hardness and the Young’s modulus are similar to conventional Ti-6Al-4V with low oxygen content.
Acknowledgments
The research is performed within the RAPOLAC STREP project under contract number 030953 of the 6th Framework Programme of the European Commission (http://www.RAPOLAC.eu), which is gratefully acknowledged. The support is highly appreciated of Professor Keith Ridgway and Dr Rosemary Gault and her team at AMRC, Sheffield, United Kingdom, where the components have been built.
References
- KobrynP ASemiatinS L 2001 Mechanical properties of laser-deposited Ti-6Al-4V Solid Freeform Fabrication (Austin, TX, USA, 2001) (The University of Texas at Austin) D LBourell J JBeaman R HCrawford H LMarcus LWood J WBarlow
- WuXMeiJ 2003 J. Mater. Proc. Technol. 135 266 http://dx.doi.org/10.1016/S0924-0136(02)00906-8
- WuXSharmanRMeiJVoiceW 2004 Mater. Design 25 103 http://dx.doi.org/10.1016/j.matdes.2003.10.004
- WangFMeiJWuX 2006 Appl. Surf. Sci. 253 1424 http://dx.doi.org/10.1016/j.apsusc.2006.02.028
- QianLMeiJLiangJWuX 2005 Mater. Sci. Technol. 21 597 http://dx.doi.org/10.1179/174328405X21003
- NowotnySScharekSBeyerERichterK-H 2007 J. Therm. Spray Technol. 16 344 http://dx.doi.org/10.1007/s11666-007-9028-5
- WangFMeiJJiangHWuX 2007 Mater. Sci. Eng. A 445–446 461 http://dx.doi.org/10.1016/j.msea.2006.09.093
- MokS HBiGFolkesJPashbyI 2008 Surf. Coat. Technol. 202 3933 http://dx.doi.org/10.1016/j.surfcoat.2008.02.008
- MokS HBiGFolkesJPashbyISegalJ 2008 Surf. Coat. Technol. 202 4613 http://dx.doi.org/10.1016/j.surfcoat.2008.03.028
- BrandlELeyensCPalmFSchoberthAOntenienteP 2008 Wire instead of powder? Properties of additive manufactured Ti-6Al-4V for aerospace applications Euro-uRapid (Berlin, Germany, 2008) (Fraunhofer-Allianz)
- DomackM STamingerK MBegleyM 2006 Mater. Sci. Forum 519–521 1291 http://dx.doi.org/10.4028/www.scientific.net/MSF.519-521.1291
- TamingerK MHafleyR A 2006 Electron beam freeform fabrication for cost effective near-net shape manufacturing NATO/RTOAVT-139 Specialists’ Meeting on Cost Effective Manufacture via Net Shape Processing (Amsterdam, the Netherlands, 2006) (NATO) pp 9–25
- Arcam 2008 http://www.arcam.com
- KatouMOhJMiyamotoYMatsuuraKKudohM 2007 Mater. Design 28 2093 http://dx.doi.org/10.1016/j.matdes.2006.05.024
- ClarkDBacheMWhittakerM 2008 J. Mater. Proc. Technol. 203 439 http://dx.doi.org/10.1016/j.jmatprotec.2007.10.051
- BaufeldBVan der BiestOGaultR 2008 Int. J. Mater. Res. at press
- BoyerRWelschGCollingsE W 1994 Materials Properties Handbook: Titanium Alloys (The Materials Information Society)
- AhmedTRackH J 1998 Mater. Sci. Eng. A 243 206 http://dx.doi.org/10.1016/S0921-5093(97)00802-2
- LütjeringG 1998 Mater. Sci. Eng. A 243 32 http://dx.doi.org/10.1016/S0921-5093(97)00778-8
- RoebbenGBasuBVleugelsJvan HumbeeckJvan der BiestO 2000 J. Alloys Compd. 310 284 http://dx.doi.org/10.1016/S0925-8388(00)00966-X
- RoebbenGBollenBBrebelsAvan HumbeeckJvan der BiestO 1997 Rev. Sci. Instrum. 68 4511 http://dx.doi.org/10.1063/1.1148422
- Kishore BabuNGanesh Sundara RamanSMythiliRSarojaS 2007 Mater. Charact. 58 581 http://dx.doi.org/10.1016/j.matchar.2006.07.001
- KahveciA IWelschG 1991 Scr. Met. Mater. 25 1957 http://dx.doi.org/10.1016/0956-716X(91)90335-X