Abstract
We present a detailed theoretical study of three alkaline earth compounds Ca2Pb, Sr2Pb and Ba2Pb, which have undergone little previous study, calculating electronic band structures and Boltzmann transport and bulk moduli using density functional theory. We also study the corresponding tin compounds Ca2Sn, Sr2Sn and Ba2Sn. We find that these are all narrow band gap semiconductors with an electronic structure favorable for thermoelectric performance, with substantial thermopowers for the lead compounds at temperature ranges from 300 to 800 K. For the lead compounds, we further find very low calculated bulk moduli—roughly half of the values for the lead chalcogenides, suggestive of soft phonons and hence low lattice thermal conductivity. All these facts indicate that these materials merit experimental investigation as potential high performance thermoelectrics. We find good potential for thermoelectric performance in the environmentally friendly stannide materials, particularly at high temperature.
1. Introduction
The lead chalcogenides PbTe, PbSe and PbS have undergone much detailed study as thermoelectrics in recent years. These are all narrow band gap semiconductors, forming in the cubic rocksalt structure, that can be readily doped both p-type and n-type. Although in earlier years their maximum thermoelectric figure-of-merit ZT (ZT is defined as S2σT/κ, where S is the Seebeck coefficient, σ the electrical conductivity, T the temperature and κ the thermal conductivity [Citation1]) was thought to be unity or less, recent work has shown a spectacular ZT improvement when full optimization of both carrier concentration and nanostructuring is performed. p-type PbTe, in particular, has recently been found to have a ZT value exceeding 2 at high temperature [Citation2]. Research on these materials continues to be quite active, and it is possible that still higher ZT values will be attained for these materials in the near future.
In this paper we will discuss three narrow band gap (based on our calculations) alkaline earth lead compounds Ca2Pb, Sr2Pb and Ba2Pb that, while having undergone scant experimental study, may also prove to be excellent thermoelectrics at a range of temperatures from room temperature to 1000 K, if optimized in a manner similar to the lead chalcogenides. As with the lead chalcogenides, these materials are isostructural and isoelectronic; they form in an orthorhombic structure (space group 62, Pnma) as depicted in figure . Lattice constants for these materials are presented in table . As the figure suggests, this is a layered structure and we therefore expect significant electronic structure anisotropy, to be discussed later. Nearest-neighbor distances in these materials exceed 3 Å, suggestive of weak bonding and hence soft phonons, favorable for thermoelectric performance (see section 4). Note also that the melting points for all three compounds are significantly above 1000 K, taking the values for Ca2Pb of 1476 K, Sr2Pb 1428 K and Ba2Pb 1201 K. This is similar to the lead chalcogenides and is favorable for high temperature performance.
Figure 1. The physical structure of Ca2Pb (orthorhombic space group 62, Pnma); Sr2Pb and Ba2Pb are similar. The x-axis is horizontal, the y-axis into the paper and the z-axis vertical.
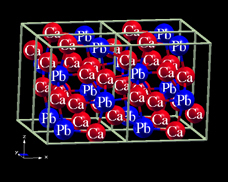
Table 1. Lattice constants (in Å) for the alkaline earth plumbides and stannides studied here. References as indicated.
These materials also bear a certain similarity to the half-Heusler thermoelectrics which have also shown high thermoelectric performance, with a ZT of 1.5 at 700 K found for ZrHfNiSn [Citation3]; for a review of these materials, see [Citation4]. Similarly to the half-Heusler materials, these materials are comprised of metallic elements yet exhibit semiconducting behavior. In the Heusler materials this behavior is associated with a band gap associated with valence electron counts of 8 or 18 associated with the bonding of this compounds. In the present case, there is also an electron count rule with a gap at a valence electron count of 8. These compounds consist of highly electropositive alkaline earth elements and group IV elements, and as such it is convenient to describe the electron counting in terms of a nominal ionic Zintl type picture, e.g. Ca2+2Pb4−. As discussed below, the valence and conduction bands in these compounds have different character, consistent with this description. Ionic bonding generally implies soft lattices, and indeed the calculated bulk moduli (section 4) for these materials are rather low.
These materials, like the lead chalcogenides, may represent a means of resolving one of the conundrums usually hampering thermoelectric performance: how to find materials with the usually conflicting properties of possessing soft phonons, indicating low lattice thermal conductivity, but also having a high melting point, allowing high temperature thermoelectric performance. In addition, with a substantially larger unit cell of 12 atoms, as opposed to the 2 atom unit cell of the lead chalcogenides, these materials may show particularly low thermal conductivity since a majority of the phononic specific heat will be comprised of the 33 optic modes (to be compared to the 3 optic modes of the lead chalcogenides), which generally have comparatively low group velocities and hence low thermal transport.
The only experimental thermoelectric study of these materials dates back to 1961 [Citation5], when Russell and Klein observed a room-temperature ZT of 0.2 in a Ca2Pb sample with a slight excess of calcium. Surprisingly, despite this significant ZT (probably at a substantially non-optimized doping level), no effort aimed at improving this value has been documented. Given this significant ZT, and that Ca2Pb has a significant band gap (estimated as approximately 0.46 eV [Citation6]), it is likely that much higher ZT values are attainable at high temperature. In addition, good room-temperature performance when fully optimized is probable as well. Some theoretical results on these materials were reported in [Citation7, Citation8].
As is well known, carrier mobility is an important factor affecting thermoelectric performance as it impacts the electrical conductivity, to which ZT is proportional. In this regard, there is one additional important piece of experimental data deriving from the aforementioned band-gap determination [Citation6] of Ca2Pb. A sample exhibiting a substantial room temperature electrical conductivity of 200 Ω−1cm−1 was observed to enter the intrinsic regime (i.e. the resistivity )) at the comparatively low temperature of approximately 550 K. Since this is primarily a band structure, not scattering time, effect, it is accessible to our first principles calculations and we find for this sample, as a rough estimate, a carrier concentration of 1018 cm−3, which would suggest a very high room temperature mobility of roughly 1250 cm2 V−1 s−1.
Given these favorable pieces of information, we chose to perform a theoretical study of this material, in the hopes of elucidating as much as possible about these materials. Sections 2–4 present the theoretical results and section 5 a summary and conclusion.
2. Theoretical results I: band structures, densities of states and thermopower
As mentioned previously, Ca2Pb, Sr2Pb and Ba2Pb all form in the orthorhombic structure, and we have therefore undertaken a systematic study of each of these materials, using the linearized augmented plane-wave (LAPW) first principles code WIEN2K [Citation9], within the generalized gradient approximation (GGA) of Perdew et al [Citation10]. We have used the experimental lattice constants, as presented in table , and optimized the internal coordinates. Spin–orbit coupling was included throughout (excepting the optimization). The self-consistent charge densities were calculated, using 140 k-points in the irreducible wedge of the Brillouin zone, and sphere radii of 2.5–2.7 Bohr radius were used. Due to the well known underestimation of band gaps by most first principles approaches, we have here used an augmentation of the GGA known as a modified Becke–Johnson (mBJ) potential [Citation11], in which a real-space, position dependent multiplicative factor is applied to the one electron potential derived from the GGA energy density functional. This approach has been shown [Citation11] to give band gaps much closer to experimental values. This is an important consideration for narrow band gap semiconductors, for which high-temperature bipolar conduction can be a substantial concern and which therefore require highly accurate band gaps, as the mBJ produces. We have calculated the thermopower for each material from the converged results using Boltzmann transport theory within the ‘constant scattering time approximation’ (CSTA), in which the scattering time of an electron or hole is taken as independent of energy. This method has been used with much success [Citation17–Citation26] to describe the thermopower of a large number of semiconducting materials.
We begin with the band structures, depicted in figure . For all three materials both the conduction band minimum (CBM) and VBM are at the Γ point, with respective band gaps for Ca2Pb, Sr2Pb and Ba2Pb of 0.33, 0.38 and 0.18 eV. The Ca2Pb figure of 0.33 eV is somewhat lower than the resistivity-determined value of 0.46 eV, and we note that this last value derives from a single, non-optical measurement and therefore contains some uncertainty. The calculated direct band gaps for all these materials suggest, however, that band gap assessment via optical measurement should readily determine the band gaps of these materials. To our knowledge, the calculated values for Sr2Pb and Ba2Pb are the first reported for these materials. The smaller band gap of the Barium compound suggests that bipolar conduction may be more of a concern with this material, and that therefore performance for this material will potentially be optimal at lower temperatures—generally under 500 K. The other two compounds, in the absence of temperature-dependent band structure effects, should be largely free of bipolar conduction in the doping ranges where thermoelectric performance is expected to be optimum for temperatures below 800 K.
Figure 2. The bandstructures of, from top/left, Ca2Pb, Sr2Pb and Ba2Pb, within the orthorhombic Brillouin zone. k-point labels from [Citation27]. The energy zero is set to the valence band maximum (VBM).
![Figure 2. The bandstructures of, from top/left, Ca2Pb, Sr2Pb and Ba2Pb, within the orthorhombic Brillouin zone. k-point labels from [Citation27]. The energy zero is set to the valence band maximum (VBM).](/cms/asset/65fac4bf-893d-4d14-8c19-410d8f72641f/tsta_a_11668636_f0002_oc.jpg)
The band gap found for Ca2Pb is significantly larger than that found in the theoretical studies of Yang et al [Citation8] and Migas et al [Citation28] who found band gaps of 0.07 and 0.15 eV, respectively for this material. In these studies a PBE GGA functional was used, as was done here, but the mBJ potential was not, leading to lower, and potentially understated, calculated band gap values.
The most significant effect of the inclusion of spin–orbit coupling is to reduce the calculated band gap, by an amount of the order of 0.1 eV. Such an effect has previously been shown to be important in properly describing the band structure and transport of the lead chalcogenides [Citation18], so that its inclusion here is expected to improve the accuracy of the calculated band gaps, relative to future band gap determination experiments. Physically spin–orbit coupling is rather important in these compounds, due principally to the large atomic number of lead. In addition the relevant states of lead are p states and thus experience less electronic screening and hence a stronger nuclear charge, enhancing the spin–orbit effect, which is relativistic in origin.
For all three materials, the valence band structure is rather anisotropic, with the slope near the VBM varying by as much as a factor of 5 or more, depending on direction. This anisotropy will be a significant consideration in the performance of the material, as (comparable to Bi2Te3) one direction can be expected to have significantly lower mobility and hence conductivity. The conduction band is slightly more isotropic but still contains significant anisotropy. We have attempted to understand the anisotropy in terms of the physical structure or bonding picture of these materials but have not been successful; for several of the compounds the high conductivity directions vary from the valence to the conduction band, confounding a simple bonding picture. The reason is probably related to the orthorhombic anisotropy of the physical structure, but no detailed explanation is readily apparent.
With regards to band degeneracy (usually favorable for thermoelectric performance), four of the six band extrema contain no degeneracy, while the conduction bands for Sr2Pb and Ca2Pb contain a near-degeneracy, with two maxima of rather disparate mass less than 100 meV apart. Such a structure has previously been shown to be favorable for thermoelectric performance [Citation29, Citation30], so that it is possible that the performance of n-type Sr2Pb and Ca2Pb may be enhanced by this feature. We will return to this issue later.
Turning to the calculated densities of states (DOS) in figure , we note that very near all six band edges the DOS rises rapidly, which provides a small energy scale that is generally favorable for high thermopower. All six band edges have a DOS peak of height over 10 per (unit cell eV) less than half an eV from the band edge. Interestingly, for several of the cases (see the inset figures) the bend edge contains a rather light dispersive band which is then augmented by a heavier band, generally less than 0.25 eV from the bend edge. Such a heavy band–light band combination has previously been shown [Citation29] to be favorable for thermoelectric performance, as it typically allows both high carrier mobility and high thermopower.
Figure 3. The DOS of, from top/left, Ca2Pb, Sr2Pb and Ba2Pb. The energy zero is set to the VBM. Inset: the density-of-states immediately around the band gap.
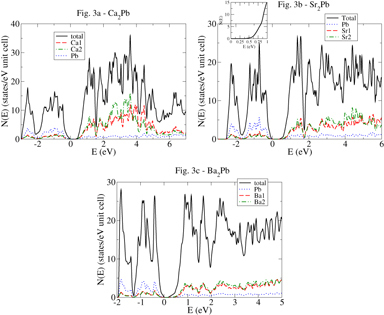
From the DOS plots, one sees that while the valence bands for all three compounds have substantial lead character, the conduction bands have primarily alkaline earth character. This reflects the fact that, unlike in the lead chalcogenides, where the lead is a cation, here the lead is an anion, receiving charge from the alkaline earth element. Electronegativity differences between the alkaline earth elements and lead are substantially larger than in the lead chalcogenides. Thus the band structure here, unlike in the lead chalcogenides, can be understood in terms of charge transfer from the electropositive alkaline earth elements to the lead. Since the conduction and valence bands are of different character, it is also possible they could experience different electron–phonon interactions and hence have different mobility. We also expect that alkaline earth vacancies will result in p-type doping into the lead bands, while lead vacancies would be n-type dopants.
Moving to the thermopower, in figure we present the conductivity averaged thermopower, for each of the three materials, for p-type and n-type, at the temperatures of 300, 500 and 800 K. The conductivity averaged thermopower is defined as follows, where x, y and z are the Cartesian axes:
1
This expression can be easily evaluated from both the thermopower S and σ/τ obtained from our first principles calculations from the canonical Boltzmann transport expressions [Citation1], under the assumption that the scattering time τ does not depend on direction. In the heavily doped regime typically of interest for thermoelectrics, scattering is dominated by electron–phonon scattering which is most typically a function of carrier concentration, but not of direction. We have chosen to plot this averaged thermopower because it is the effective thermopower that would be seen in a polycrystalline sample, as would most likely be used for applications, and because the thermopower in these materials is substantially anisotropic. This can actually be seen directly from the band structure plots in figure , where, for example, the Γ-centered VBM between U and Z exhibits quite different dispersions in these two directions, leading to differing σ/τ and as a consequence, differing thermopower.
Figure 4. The conductivity weighted thermopower (see text for details) for (from top/left) Ca2Pb, Sr2Pb and Ba2Pb. The horizontal lines demarcate the region of thermopower absolute value between 200 and 300 μVK−1, the typical range for a high performance thermoelectric.
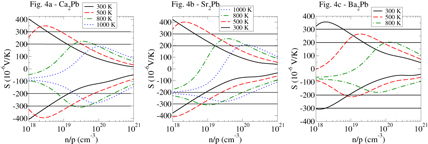
We begin with Ca2Pb. At 300 K, Pisarenko behavior, i.e. logarithmic in carrier concentration, is observed for both p-type and n-type for carrier concentrations between 1018 and 1019 cm−3. This is consistent with the low carrier concentrations, in which non-degenerate behavior is expected. As one passes the 1019 cm−3 point, some curvature becomes apparent, which results both from the approach to the degenerate limit (in which for a parabolic band the thermopower is, to first order, ∼p−2/3) and also from the effect of more than one band, or band maximum. Optimal doping for thermoelectric performance at 300 K, for both p-type and n-type is expected to be in the range of 4 × 10¹⁸–1.5 × 1019 cm−3. At the higher temperatures of 500 and 800 K, bipolar conduction (a decrease in thermopower with decreasing carrier concentration, the opposite of the usual situation) begins to appear. At 500 K this is in a doping range significantly lighter than probable optimal doping, but at 800 K this bipolar effect begins to encroach upon the Seebeck coefficient, particularly for p-type. Optimal doping ranges are given as (at 500 K) 1–4 × 1019 cm−3 for p-type and 2–7 × 1019 cm−3 for n-type. At 800 K the corresponding ranges are 4 – 8 × 1019 cm−3 for p-type and 6 × 10¹⁹–3 × 1020 cm−3 for n-type. Note that at 800 K the p-type performance (i.e. ZT) may well be degraded by the bipolar effects. Surprisingly, despite the comparatively small band gap the n-type material still attains a thermopower magnitude significantly exceeding 200 μVK−1 so that this material may show good 1000 K n-type performance for doping levels in the range of 1–5 × 1020 cm−3.
Moving to Sr2Pb, we observe Pisarenko behavior for both p-type and n-type at 300 and 500 K in the regime below carrier concentrations of 1019 cm−3, gradually transitioning to degenerate behavior as the carrier concentrations increases. As with the calcium compound, at 300 and 500 K the thermopower does not enter the bipolar regime until dopings far smaller than optimal. At 800 K the bipolar regime begins to appear nearer optimal doping, for p-type. For n-type, however, good performance is likely attainable at 800 K and even at 1000 K, as evidenced by the substantial regions of thermopower magnitude above 200 μVK−1. Expected optimal doping regimes, indicated by the lines at thermopowers of ±200 and ±300 μ VK−1, are at 300 K: p-type–5 × 10¹⁸–2 × 1019 cm−3; n-type, 2.5 × 10¹⁸–1019 cm−3; 500 K, p-type–1.3 × 10¹⁹–6 × 1019 cm−3; n-type, 7 × 10¹⁸–3 × 1019 cm−3; 800 K, p-type–approximately 1020 cm−3; n-type, 2 × 10¹⁹–1020 cm−3. N-type optimal dopings at 1000 K are 6 × 10¹⁹–2 × 1020 cm−3.
Finally we discuss Ba2Pb. With a calculated band gap of just 0.18 eV, we expect significant bipolar conduction at elevated temperature, and accordingly we find that the 800 K thermopower barely exceeds 200 μVK−1 for p-type and does not reach this absolute value for n-type. High thermoelectric performance at 800 K is therefore not likely. Even at 500 K, bipolar conduction may well preclude good thermoelectric performance for n-type and could limit p-type performance as well. AT 300 K, however, the bipolar conduction is much less significant, with maximum thermopower magnitude exceeding 300 μVK−1 for both p-type and n-type. We note also that, as Ba is the heaviest alkaline earth element in the three compounds considered in this paper, its lattice thermal conductivity is expected to be the lowest, a point underscored by our calculated bulk moduli (next section). This means that it is most probable that of the three materials studied here, Ba2Pb will be the best room temperature performance material. Optimal doping levels are likely as follows: 300 K: p-type – 3 × 10¹⁸–1019 cm−3; n-type, 6 × 10¹⁸–3 × 1019 cm−3; 500 K, n-type, 3 –8 × 1019 cm−3.
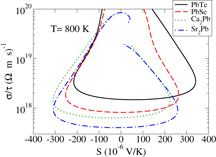
One additional area of interest regarding the thermopower concerns n-type Ca2Pb and Sr2Pb. As mentioned above, these may well have highly favorable thermoelectric performance at temperatures in the 800–1000 K range, despite the narrow band gaps of less than 0.4 eV. One factor supporting this observation is the likelihood of high electrical conductivity in these temperature ranges. Presented in figure is a plot of the calculated direction averaged σ/τ versus direction averaged thermopower at 800 K for these two materials and compared with corresponding values (calculated within the same CSTA/GGA/mBJ potential framework) for the known high performance thermoelectrics PbTe and PbSe. While for p-type the performance of the lead chalcogenides appears more favorable than these alkaline earth plumbides, for n-type in the thermopower range around −200 μVK−1 (the typical range for high performance thermoelectric), the σ/τ of Ca2Pb exceeds that of the lead chalcogenides by more than a factor of 2. Since the scattering time remains unknown, we cannot definitely assert high electrical conductivity in these compounds, but it is certainly possible.
Figure 5. The calculated σ/τ results for the indicated compounds plotted as a function of the calculated thermopower. Note that the n-type Ca2Pb and Sr2Pb have higher σ/τ in the thermopower range around −200 μVK−1, where performance may be optimum.
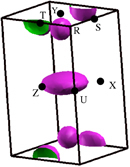
It is of interest to understand the reason for the high σ/τ results in n-type Ca2Pb and Sr2Pb, particularly since the CBM is located at Γ and hence has no pocket degeneracy. This is unlike in the high performance thermoelectrics Bi2Te3 and PbTe where the pocket degeneracy of the non-Γ-centered band extrema is a substantial contributor to transport. Part of the reason for these large σ/τ results can be seen from the band structure plots for these compounds in figure , where subsidiary conduction band minima appear at T and on the Γ–Y line. Note also that these subsidiary minima are closer to the CBM in Ca2Pb than Sr2Pb, accounting for the slightly higher σ/τ in figure . To shed further light on this we plot in figure the Fermi surface of n-type Ca2Pb, at a T = 0 doping level of 3.1 × 1020 cm−3. In addition to the main ellipsoidal surface around Γ, one observes six additional Fermi surface pockets, four located around the zone boundary T point and two nearly spherical pockets located above and below Γ. It is this additional Fermi surface structure that is responsible for the large σ/τ in Ca2Pb and Sr2Pb.
Figure 6. The Fermi surface of n-type Ca2Pb, plotted at a doping level n = 3.1 × 1020 cm−3.
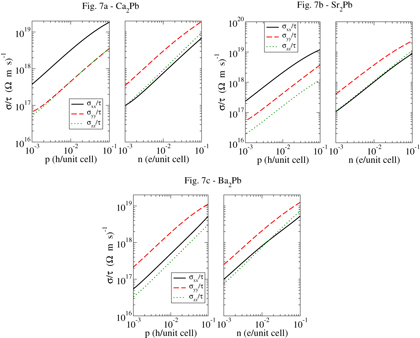
Since, as mentioned previously, the anisotropy of the electronic structure is a significant issue for these materials, we present in figure plots of the electrical conductivity (divided by the scattering time, which is unknown) for these three materials, for both p-type and n-type. For Ca2Pb (top/left), the 500 K anisotropy is substantial for p-type, with approximately a factor of 5 difference between the conductivities in the x direction and that in the y and z directions. In general, such anisotropy will tend to degrade the electrical conductivity, and therefore thermoelectric performance. The n-type Ca2Pb results are more favorable, with only a factor of 3 anisotropy. For Sr2Pb, the 500 K anisotropy is also substantial for p-type, being roughly a factor of 10, and a more moderate 4 for n-type. For Ba2Pb (bottom/left), due to the probable lower optimal temperature range we have chosen to plot the 300 K results and find anisotropies of roughly 5 for p-type and roughly 2 for n-type. With the exception of the p-type Ca2Pb and the p-type Sr2Pb, these anisotropies are in the range of those of Bi2Te3, and therefore although the anisotropy is a concern for these materials, it is not necessarily sufficient to preclude high thermoelectric performance. The theoretical results of this section then suggest that all three materials may be useful thermoelectrics, with the n-type Sr and Ca compounds expected to be the best at temperatures from 500 to 1000 K and the Ba compound likely the best at low temperatures between 300 and 400 K.
Figure 7. The conductivity σ/τ calculated from first principles for, from top/left, Ca2Pb at 500 K, Sr2Pb at 500 K and Ba2Pb at 300 K. Electron concentrations n and hole concentrations p given per unit cell.
3. Theoretical results II: comparison of alkaline earth plumbides and stannides
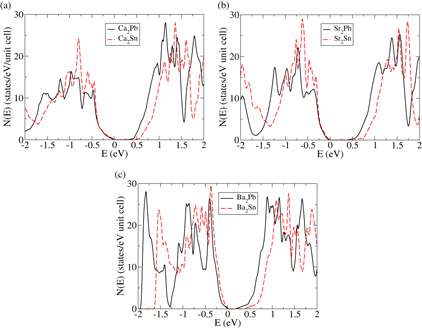
In this section we extend certain portions of the above analysis to the alkaline earth stannides Ca2Sn, Sr2Sn and Ba2Sn, which are isostructural and isoelectronic to the plumbides. While a full description of the potential performance of these stannides is beyond the scope of this paper, in figure we present a comparison of the calculated DOS of Ba2Sn and Ba2Pb, Sr2Pb and Sr2Sn, and Ca2Pb and Ca2Sn. For all three plots the calculated DOS of the stannides and plumbides are very similar, with the main difference in fact being somewhat larger band gaps in the stannides. The agreement is particularly good within the first half of an eV in the valence and conduction bands, the relevant region for thermoelectric transport. This plot strongly suggests that the thermopower of those three compounds should also be favorable, and that these three stannides may also show good thermoelectric performance. In the high temperature range around 800 K the performance of these stannides for p-type may in fact exceed that of the plumbides due to the larger band gaps. Due to the presence of the lighter element tin, lattice thermal conductivities of these compounds are expected to be somewhat larger than those of the corresponding plumbides, but the isostructural and isoelectronic nature of all six compounds suggests that alloying on either site should be readily possible and would tend to reduce the lattice thermal conductivity. Note also that the larger band gaps associated with the stannides suggest that such alloying would tend to enlarge the band gap, and thereby enhance the p-type performance of the alkaline earth plumbides, which is particularly hampered by bipolar conduction.
Figure 8. The calculated DOS for the six indicated compounds. The zero of energy is set to the respective valence band maxima.
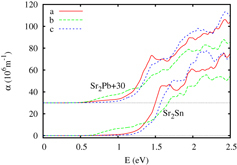
We have also performed calculations of the optical absorption of Sr2Pb and Sr2Sn, which are presented in figure . It is worth noting that for both compounds the optical absorption is highest along the b-axis at low excitation energies, and in addition for both compounds the apparent onset of strong direct transitions, usually appearing at the band gap energy, here appears at energies of 1.2 eV, well above the true band gap. This will probably be a significant consideration in the interpretation of optical experiments designed to assess the actual band gap. Note also that for both compounds the onset of b-axis transitions is several tenths of an eV lower than for the other two directions.
Figure 9. The calculated optical absorption for Sr2Pb and Sr2Sn.
4. Theoretical results III: bulk modulus calculations and estimation of lattice thermal conductivity
In the previous section we focussed on electronic structure and Boltzmann transport results, finding favorable band structures and thermopowers at a range of temperatures, depending upon the material. However, this is only part of what is necessary to produce a good thermoelectric, the other factors being low lattice thermal conductivity and acceptable carrier mobility. The mobility depends largely on the carrier scattering time, which is difficult to access in standard first principles approaches and can often be sample specific, depending on extrinsic factors such as point defects and surface oxidation. However, a reasonable guess can be made at the lattice thermal conductivity if one performs calculations to assess such factors as the bulk modulus. The bulk modulus has long been known as the determining factor in the velocity of the longitudinal (or ‘compression’, as opposed to ‘shear’) acoustic modes, which generally contribute a substantial fraction of the phononic heat transport in a given material. As with the electronic transport, a scattering time (related to mode anharmonicity, i.e. the Gruneisen parameters) enters as well, but factors such as the sound velocity, which directly contributes to the bulk modulus, play an important and easily assessed effect.
In order to make this assessment we have performed calculations of the bulk moduli of each of the three materials studied. This is done by taking the experimental structure and altering each of the lattice constants by a specified amount: ±1%,±2%, and the self-consistent charge density computed. From this charge density one evaluates the total energy and then fits this energy to the well-known Birch–Murnaghan equation of state [Citation31, Citation32] relating total energy, volume, bulk modulus B and the pressure derivative of the bulk modulus, dB/dP. Note that this calculation was performed with the standard GGA, not the mBJ potential which is inappropriate for structural calculation, as it does not derive from an energy functional. An additional point of note is that given that the energy differences associated with the above strains are fairly small (of the order of 10−2 Ryd), it is important to perform an optimization of any internal coordinates independently for each strained structure, to evaluate the actual energy sufficiently accurately. In general, other parameters, such as the number of k-points and LAPW sphere radii, were unchanged from the previous band structure calculations.
In table we present our calculated GGA bulk moduli, and make a comparison with the values for the lead chalcogenides as calculated within the GGA by Zhang et al [Citation33], matching compounds where the alkaline earth element and chalcogenide are of similar atomic number, for an overall comparison. The values decrease with increasing atomic mass, as expected, but what is more remarkable is that the values for the alkaline earth plumbides are roughly half of the values for the corresponding chalcogenides. These are indicative of low sound speeds. Note that our value for Ca2Pb is within 10% of the value calculated by Yang et al [Citation8] and 15% of the value calculated by Migas et al [Citation28]. Given that the chalcogenides have low room temperature lattice thermal conductivities in the 1.7–2.5 W m−1 K−1 range, this is suggestive that the alkaline earth plumbides considered here will have comparatively low lattice thermal conductivity as well.
Table 2. Calculated GGA bulk moduli B (in GPa) for the alkaline earth plumbides (our calculations) and the lead chalcogenides (from [Citation33]).
One possible reason for the lower bulk modulus values, relative to the lead chalcogenides, can be found from the atomic character plots depicted in figure . All three of these compounds are substantially ionic, with the primary character in the valence band being lead (the more electronegative element) and that in the conduction band being the alkaline earth element. As is well known, ionic compounds tend to be weakly bonded, with the attendant low sound speeds and elastic moduli. These compounds have substantially larger interatomic distances than the lead chalcogenides, likely due to the larger ionic radii of the alkaline earth elements relative to the chalcogenides, causing lower bulk moduli.
In this vein we can make a crude estimate of the possible lattice thermal conductivity for these materials. As is well known, for temperatures above the Debye temperature (of order 100–200 K for these soft materials) the lattice thermal conductivity can be estimated [Citation33] as
2
Here Mavg is the average atomic mass, in atomic mass units, θ the Debye temperature, γ the Gruneisen parameter, δ the cube root of the volume per atom and n the number of atoms per unit cell. A is a constant and if δ is measured in Å, T and θ in K and κlattice measured in W m−1 K−1, then A is 3.1 × 10⁻⁶. We may readily estimate the Debye temperature of each compound (for Ba2Pb, 116 K; for Sr2Pb, 143 K; for Ca2Pb, 180 K) from the computed bulk modulus and find that for the three respective (Ba, Sr, Ca) compounds, at 300 K, the lattice thermal conductivity is 1.6/γ2Ba2Pb W m−1 K−1, 2.5/γ2Sr2Pb W m−1 K−1, and 3.5/γ2Ca2Pb W m−1 K−1. With, experimentally speaking, for most materials Gruneisen parameters falling between one and two, one finds potential 300 K lattice thermal conductivity values between 0.4 and 1.6 W m−1 K−1 for the Ba compound, 0.6 and 2.5 W m−1 K−1 for the Sr compound, and 0.9–3.5 W m−1 K−1 for the Ca compound. As suggested previously, these are comparatively low values, particularly for the Ba compound, which we expect to exhibit the best room temperature performance.
5. Discussion and conclusion
The previous sections make clear that the alkaline earth plumbides and environmentally friendly stannides considered here, about which comparatively little is known experimentally, are quite likely to have the three characteristics necessary for good thermoelectric performance: high thermopower, low lattice thermal conductivity and good carrier mobility. One concern for practical applications, however, is the reactivity of the alkaline earth element, particularly at the elevated temperatures necessary for waste heat recovery. While calcium, strontium and barium have melting points of 1000 K or more (note that the corresponding chalcogens all have melting points below 725 K), it is possible that samples of the thermoelectrics considered here will oxidize in air, so that effort may be necessary to isolate the samples from air and water vapor. In any case, future experimental study is expected to reveal much about the potential of these materials for thermoelectric applications.
To summarize, in this paper we have shown that the alkaline earth plumbides Ca2Pb, Sr2Pb and Ba2Pb and stannides Ca2Sn, Sr2Sn and Ba2Sn, presently virtually unexplored as thermoelectrics, have substantial potential for thermoelectric performance, both at room temperature and at high temperature, and therefore warrant experimental exploration. We await the results of such experimental inquiries.
Acknowledgments
This research was supported by the US Department of Energy, EERE, Vehicle Technologies, Propulsion Materials Program.
References
- IoffeA 1957 Semiconductor Thermoelements and Thermo-Electric Cooling London Inforesearch
- BiswasKHeJBlumI DHoganT PSeidmanD NKanatzidisM G 2012 Nature 489 414 418 414–8 10.1038/nature11439
- SakuradaSShutohN 2005 Appl. Phys. Lett. 86 082105 10.1063/1.1868063
- GrafTFelserCParkinS S 2011 Prog. Solid State Chem. 39 1 50 1–50 10.1016/j.progsolidstchem.2011.02.001
- RussellV AKleinP H 1961 Adv. Energy Convers. 1 147 10.1016/0365-1789(61)90024-8
- BuschGJunodPKatzUWinklerU 1954 Helv. Phys. Acta 27 193
- KatsuraYTakagiH 2013 J. Electron. Mater. 42 1365 1368 1365–8 10.1007/s11664-012-2226-z
- YangZShiDWenBMelnikRYaoSLiT 2010 J. Solid State Chem. 183 136 143 136–43 10.1016/j.jssc.2009.11.007
- BlahaPSchwarzKMadsenGKvasnickaDLuitzJ 2001 WIEN2k, An Augmented Plane Wave + Local Orbitals Program for Calculating Crystal Properties Vienna Technische Universität Wien
- PerdewJ PBurkeKErnzerhofM 1996 Phys. Rev. Lett. 77 3865 3868 3865–68 10.1103/PhysRevLett.77.3865
- TranFBlahaP 2009 Phys. Rev. Lett. 102 226401 10.1103/PhysRevLett.102.226401
- BruzzoneGMerloF 1976 J. Less-Common Met. 48 103 109 103–9 10.1016/0022-5088(76)90236-8
- BruzzoneGFranceschiE 1978 J. Less-Common Met. 57 201 208 201–8 10.1016/0022-5088(78)90239-4
- GuttscheKRosinAWendorffMRoehrC 2006 Z. Natur. B 61 846 853 846–53
- EckerlinPLeichtEWlfelE 1961 Z. Anorg. Allg. Chem. 307 145 156 145–56 10.1002/zaac.19613070306
- WideraASchaeferH 2002 Golden Book of Phase Transitions vol 1
- MadsenG K HSchwarzKBlahaPSinghD J 2003 Phys. Rev. B 68 125212 10.1103/PhysRevB.68.125212
- SinghD J 2010 Phys. Rev. B 81 195217 10.1103/PhysRevB.81.195217
- ParkerDSinghD J 2010 Phys. Rev. B 82 035204 10.1103/PhysRevB.82.035204
- ZhangLDuM HSinghD J 2010 Phys. Rev. B 81 075117 10.1103/PhysRevB.81.075117
- OngK PSinghD JWuP 2011 Phys. Rev. B 83 115110 10.1103/PhysRevB.83.115110
- SinghD JMazinI I 1997 Phys. Rev. B 56 R1650 R1653 R1650–3 10.1103/PhysRevB.56.R1650
- ScheidemantelT JAmbrosch-DraxlCThonhauserTBaddingJ VSofoJ O 2003 Phys. Rev. B 68 125210 10.1103/PhysRevB.68.125210
- BertiniLGattiC 2004 J. Chem. Phys. 121 8983 8989 8983–9 10.1063/1.1802631
- LykkeLIversenB BMadsenG K H 2006 Phys. Rev. B 73 195121 10.1103/PhysRevB.73.195121
- WangYChenXCuiTNiuYWangYWangMMaYZouG 2007 Phys. Rev. B 76 155127 10.1103/PhysRevB.76.155127
- LaxM 1974 Symmetry Principles in Solid State and Molecular Physics New York Wiley
- MigasD BMiglioLShaposhnikovV LBorisenkoV E 2003 Phys. Rev. B 67 205203 10.1103/PhysRevB.67.205203
- ParkerDSinghD J 2012 Phys. Rev. B 85 125209 10.1103/PhysRevB.85.125209
- PeiYShiXLaLondeAWangHChenLSnyderG J 2011 Nature 473 66 69 66–9 10.1038/nature09996
- BirchF 1947 Phys. Rev. 71 809 824 809–24 10.1103/PhysRev.71.809
- MurnaghanF D 1944 Proc. Nat. Acad. Sci. 30 244 247 244–7 10.1073/pnas.30.9.244
- ZhangYKeXChenCYangJKentP R C 2009 Phys. Rev. B 80 024304 10.1103/PhysRevB.80.024304