
Abstract
This study presents a facile and green route for the synthesis of (La0.95Eu0.05)2O2S red phosphors of controllable morphologies, with the sulfate-type layered hydroxides of Ln2(OH)4SO4·2H2O (Ln = La and Eu) as a new type of precursor. The technique takes advantage of the fact that the precursor has had the exact Ln:S molar ratio of the targeted phosphor, thus saving the hazardous sulfurization reagents indispensable to traditional synthesis. Controlled hydrothermal processing at 120 °C yielded phase-pure Ln2(OH)4SO4·2H2O crystallites in the form of either nanoplates or microprisms, which can both be converted into Ln2O2S phosphor via a Ln2O2SO4 intermediate upon annealing in flowing H2 at a minimum temperature of ∼ 700 °C. The nanoplates collapse into relatively rounded Ln2O2S particles while the microprisms retain well their initial morphologies at 1 200 °C, thus yielding two types of red phosphors. Photoluminescence excitation (PLE) studies found two distinct charge transfer (CT) excitation bands of O2− → Eu3+ at ∼ 270 nm and S2− → Eu3+ at ∼ 340 nm for the Ln2O2S phosphors, with the latter being stronger and both significantly stronger than the intrinsic intra-f transitions of Eu3+. The two types of phosphors share high similarities in the positions of PLE/PL (photoluminescence) bands and both show the strongest red emission at 627 nm (5D0 → 7F2 transition of Eu3+) under S2− → Eu3+ CT excitation at 340 nm. The PLE/PL intensities show clear dependence on particle morphology and calcination temperature, which were investigated in detail. Fluorescence decay analysis reveals that the 627 nm red emission has a lifetime of ∼ 0.5 ms for both types of the phosphors.
Introduction
Lanthanide oxysulfides (Ln2O2S, Ln = La–Lu; space group: Pml) are known as a group of wide bandgap (4.6–4.8 eV) compounds that can be doped with various rare-earth activators for a wide range of luminescence and display applications [Citation1, Citation2]. Eu3+-activated Ln2O2S compounds, such as Y2O2S:Eu3+ and La2O2S:Eu3+, have been extensively investigated because they are efficient red phosphors finding extensive applications in television picture tubes [Citation1], field emission displays [Citation3] and long-lifetime phosphors [Citation4]. Compared with the traditional Eu3+ doped oxide red phosphors [Citation5–Citation7], Ln2O2S:Eu3+ compounds have Eu–S bonds in their crystal structure, which give rise to an additional Eu–S charge transfer (CT) excitation band, aside from the O–Eu one, and thus show significantly broader CT excitation behaviors. Furthermore, the Ln2O2S:Eu3+ phosphors dominantly emit red light at ∼ 630 nm, which is closer to the ideal red-color (∼ 650 nm) than the typical Y2O3:Eu3+ emission at ∼ 610 nm. Although highly valuable in many fields, Ln2O2S:Eu3+ phosphor particles of uniform dimension, good dispersion and well-controlled morphology are still challenging in synthesis. Traditional synthesis of oxysulfide phosphors via solid-state reaction of Ln2O3 and elemental sulfur, in the presence of a proper amount of suitable flux, usually yields products of large particle sizes (several to tens of microns), appreciable aggregation and a wide size distribution [Citation8, Citation9]. As finer phosphor particles of better controlled characteristics are desired in contemporary lighting and display technologies to improve the resolution and luminescence intensity, alternative synthetic methodologies have been attempted in recent years for oxysulfide synthesis, including combustion [Citation10], sulfurization of rare-earth oxides by H2S or CS2 gas at elevated temperatures [Citation11], solvothermal pressure-relief synthesis [Citation12], two-step solution gel polymer thermolysis [Citation13], gelatin-templated synthesis [Citation14] and gel thermolysis [Citation15]. It should be noted that the above synthetic routes generally need harmful and bad-smelling sulfurization reagents, such as CS2, H2S, K2S and thiourea (CS(NH2)2), and sometimes have difficulties in the morphological control of the final product.
We report in this work a facile and clean route to synthesize (La,Eu)2O2S red phosphors of controlled particle morphologies, with SO42−-pillared layered rare-earth hydroxides (LRHs) (Ln2(OH)4SO4·nH2O, Ln = La and Eu, and n ≈ 2) as a new type of precursor. One distinct feature of this technique is that the precursor has already had the exact Ln:S molar ratio of the targeted Ln2O2S phosphor, and thus Ln2O2S can be directly yielded via proper annealing in a reducing atmosphere without using any of the aforementioned hazardous sulfurization reagents. The method is environment friendly, has high efficiency and presents a better morphological control. The Ln2(OH)4SO4·2H2O compounds were reported as a new family of LRHs in 2010, and elongated platelets of several micrometers in lateral size and tens of nanometers in thickness were successfully crystallized for the intermediately sized Ln3+ (Ln = Pr–Tb) via controlled hydrolysis of the corresponding rare-earth sulfates in the presence of hexamethylenetetramine (HMT) [Citation16]. Synthesis via the HMT-based homogeneous precipitation technique, however, has not been reported for the Ln3+ larger than Pr3+, such as the La3+ in this work. It was also noticed that hydrothermal reaction has rarely been attempted in the synthesis of this group of layered compounds. In view of these results, we employed in this work the hydrothermal route to synthesize Ln2(OH)4SO4·2H2O (Ln = La and Eu) under controlled pH, with Ln(NO)3 as the mother salt and environmentally benign ammonium sulfate ((NH2)2SO4) as the sulfate source, which is then employed as the precursor to generate (La,Eu)2O2S red phosphors via proper annealing in flowing H2. The precursors and the resultant phosphors are thoroughly characterized by the combined techniques of x-ray diffractometry (XRD), Fourier transform infrared spectroscopy (FTIR), field emission scanning electron microscopy (FE-SEM), thermogravimetry/differential scanning calorimetry (TG/DSC) and photoluminescence excitation/photoluminescence (PLE/PL) spectroscopies. In the following sections, we report the phase structure and particle morphology controlled synthesis of SO42−-LRHs precursors, phase evolution of the precursor upon calcination and PL behaviors of the resultant (La,Eu)2O2S red phosphors.
Experimental procedure
The starting materials for powder synthesis are La2O3 (99.99% pure), Eu2O3 (99.99% pure), NH3·H2O, (NH4)2SO4 and HNO3 (Shenyang Chemical Reagent Factory, Shenyang, China). All the chemicals were used as received without further purification. A mixed solution of La and Eu nitrates was prepared by dissolving La2O3 and Eu2O3(La/Eu = 19:1 molar ratio) in concentrated HNO3, followed by evaporation to dryness at 100 °C to remove superfluous HNO3 and a final dilution with distilled water to 0.1 M. For each run of the synthesis, 0.792 g of (NH4)2SO4 (Ln3+:SO42− = 1:1 molar ratio, Ln = La and Eu) was dissolved in 60 ml of the mixed nitrate solution to get a clear solution, and NH3·H2O was then added dropwise to reach different pH values in the range 7.0–10. The resultant mixture was homogenized at room temperature in the favor of magnetic stirring for 10 min and was then transferred to a Teflon lined stainless steel autoclave of 100 ml capacity. The autoclave was tightly sealed and was put in an electric oven preheated to 120 °C for a reaction period of 24 h. After natural cooling to room temperature, the hydrothermal product was collected via centrifugation, washed three times with distilled water via repeated ultrasonication and centrifugation to remove by-products, rinsed with absolute ethanol and was finally dried in the air at 50 °C for 12 h to yield a white precursor powder for characterizations and further processing. Calcination of the precursor was performed by following hydrogen (∼ 200 ml min−1) at various predetermined temperatures ranging from 400 to 1200 °C for 1 h, with a heating rate of 10 °C min−1 at the ramp stage. Details of the synthesis are summarized in scheme .
Scheme 1. Experimental details of phosphor synthesis.

Phase identification was performed by XRD (Model PW3040/60, Philips Research Laboratories, Eindhoven, The Netherlands) operated at 40 kV per 40 mA, using nickel filtered CuKα radiation. FTIR spectroscopy (Model Spectrum RXI, Perkin-Elmer, Shelton, Connecticut, USA) of the precursors was performed by the standard KBr method. Morphologies of the products were observed via FE-SEM (Model JSM-7001F, JEOL, Tokyo, Japan) operated at 10 kV. PL/PLE spectra and fluorescence decay kinetics of the (La,Eu)2O2S phosphors were taken with an LS-55 fluorescence spectrophotometer (Perkin-Elmer, Shelton, Connecticut, USA) at room temperature.
Results and discussion
Hydrothermal synthesis and characterization of the precursor
The systematic studies performed in this work indicated that characteristics of the precursor, including chemical composition, phase structure and particle morphology, are significantly affected by the solution pH (7.0–10). For each run of the synthesis, residual La3+ and Eu3+ ions are hardly detectable in the remnant solution after solid particle removal, suggesting a nearly 100% yield of the hydrothermal reaction.
Figure compares XRD patterns of products synthesized in the pH range 7.0–10. Samples S1 (pH = 7.0) and S2 (pH = 7.5) can be well indexed based on anhydrous La(OH)SO4 (JCPDS No. 00-045-0750). The compound crystallizes in the space group P21/n and possesses a layered structure, in which the main layers, composed of LnO9 polyhedra, are confined to the ac plane and the individual ac layers are tied together by the sulfate entities along the b-axis [Citation1, Citation17]. The S4 (pH = 9.0) and S5 (pH = 10.0) samples, which were obtained under higher pH, are both indexible to the sulfate-type LRHs (SO42−-LRHs) of Ln2(OH)4SO4·2H2O reported for the intermediately sized Ln3+ ions (Ln = Pr–Tb) [Citation16]. The SO42−-LRHs tend to crystallize in the orthorhombic system, with the SO42− anions sandwiched between the hydroxide host layers for charge balance, and the crystal may be viewed as an alternative stacking of the host and SO42− layers along the [010] direction (b-axis) [Citation16]. For the five samples of S1–S5, the appearances of (020) and (040) diffractions in the low-angle region are indicative of layered structures. LRHs of the composition Ln2(OH)5A·nH2O (A = NO3, Cl or Br, and n ∼ 1.5–1.7), reported in recent years for a wide spectrum of Ln (Ln = Nd–Yb, including Y), are featured by exchangeable A− anions and varied hydration number n and interlayer distance with varying Ln3+ size and environment humidity [Citation18–Citation20]. The sulfate-type LRHs of Ln2(OH)4SO4·nH2O, however, have bidentatedly coordinated SO42− (un-exchangeable) and an almost fixed hydration number of 2 [Citation16]. From the peculiar crystallization behavior and crystal structure of Ln2(OH)4SO4·2H2O, it can be expected that Ln3+ size would bring about no essential difference to the interlayer distance (i.e. peak positions of the (0k0) diffractions) but appreciably varied dimensions of the ac plane (the host layer). Calculations from the XRD results shown in figure yielded lattice parameters of a ∼ 0.640 nm, b ∼ 1.626 nm and c ∼ 0.389 nm, and an interlayer distance of ∼ 0.813 nm for the (La,Eu)2(OH)4SO4·2H2O compounds synthesized in this work. The interlayer spacing is close to the value of 0.829 nm reported for Tb2(OH)4SO4·2H2O[Citation16]. The S3 sample, synthesized under the intermediate pH of 8.0, is apparently a mixture of the Ln(OH)SO4 and Ln2(OH)4SO4·2H2O phases. The above results are understandable from the solution chemistry of Ln3+ discussed below. The Ln3+ cations undergo hydration and hydrolysis in an aqueous solution to form six-fold coordinated [Ln(OH)x(H2O)y(SO4)z]3−x−z/2 (x + y + z = 6) complex species [Citation21], in which SO42− is incorporated because of its high complexing ability. Higher solution pH promotes hydrolysis and thus leads to more hydroxyls while at the same time lessens SO42− in these precursor ions. This accounts for the higher OH−/Ln3+while lower SO42−/Ln3+ mole ratios are observed for the higher pH product and also the phase transition from Ln(OH)SO4 to Ln2(OH)4SO4·2H2O.
Figure 1 XRD patterns of the hydrothermal products synthesized at 120 °C under different pH values, with (a) Ln(OH)SO4 (pH = 7.0), (b) Ln(OH)SO4 (pH = 7.5), (c) a phase mixture of Ln(OH)SO4 and Ln2(OH)4SO4·2H2O (pH = 8.0), (d) Ln2(OH)4SO4·2H2O (pH = 9.0) and (e) Ln2(OH)4SO4·2H2O (pH = 10.0).
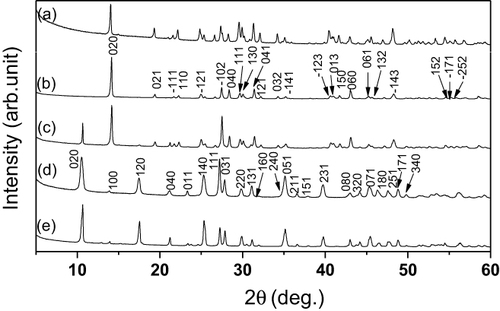
Figure shows FE-SEM morphologies for the three typical samples of S1, S4 and S5. The S1 sample (Ln(OH)SO4, pH = 7.0) presents plate-like morphologies, with sizes of up to 4 μm in length, 500 nm in width and a thickness of ∼ 20 nm. It is also seen that some of the plates tend to wrap up and appear curved. The S4 sample (Ln2(OH)4SO4·2H2O, pH = 9.0) is composed of relatively uniform and thin platelets of approximately 1 μm long, 300 nm wide and 100 nm thick. At the even higher hydrothermal pH of 10, the Ln2(OH)4SO4·2H2O particles (S5) turn significantly bigger and thicker and appear as microprisms with dimensions of up to ∼ 5 μm in length, 1.2 μm in width and 400 nm in thickness. From figures (b) and (c), it is perceived that raising the solution pH from 9.0 to 10.0 appreciably raises the solubility of Ln2(OH)4SO4·2H2O in the hydrothermal system, and thus significantly larger particles are resulted via Ostwald ripening (i.e. the dissolution of smaller particles followed by reprecipitation on bigger ones). Nanosized particles are seen to cover surfaces of the microprisms (figure (c)), which is believed to be caused by secondary nucleation upon cooling the hydrothermal system. The initially high solubility of Ln2(OH)4SO4·2H2O, rendered by the high solution pH of 10, decreases with decreasing temperature and thus secondary nucleation of Ln2(OH)4SO4·2H2O takes place once supersaturation is reached.
Figure 2 FE-SEM images of the hydrothermal products synthesized at 120 °C under pH values of (a) 7.0, (b) 9.0 and (c) 10.0.

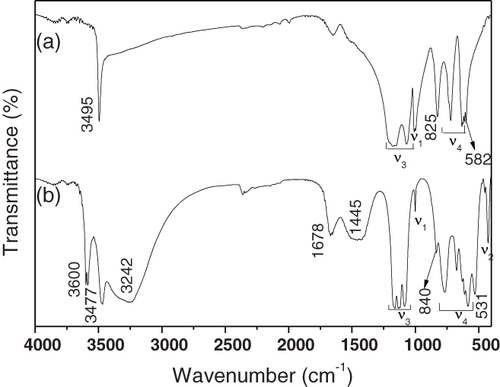
The functional groups built in the hydrothermal products are investigated via FTIR spectroscopy, and the results are shown in figure for the two typical samples of S1 and S4. The fundamental IR vibrations of SO42− are well documented to be located at 1104 (ν3), 981 (ν1), 618 (ν4) and 451 cm−1 (ν2), and strong bands are usually found in the region 1210–1040 cm−1 [Citation22]. When the SO42− tetrahedron is distorted, ν3 would split to give rise to two or three peaks, the resolution of which depends on the magnitude of the split, and ν1 would become active usually near 1000 cm−1 [Citation22]. Similarly, the ν4 absorption may split into three bands [Citation22]. The above-mentioned SO42− vibrations are thus all clearly observable for the S1 sample, that is, ν3 in the range ∼ 1038–1250 cm−1 (two splits), ν1 at 1005 cm−1, and ν4 in the region ∼ 780–625 cm−1 (two splits). The sharp absorptions found at ∼ 3495, 825 and 582 cm−1 are all diagnostic of hydroxyls in the molecule. The lack of a clear absorption at ∼ 3240 cm−1 and the rather shallow peak at 1650 cm−1 imply that the sample essentially contains no water of hydration but has some surface adsorbed water molecules. The above results suggest that the S1 sample is an anhydrous basic sulfate, in accordance with the results of XRD. The appearance of ν1 vibration at ∼ 1005 cm−1, which is IR inactive in free SO42− ions of highly symmetric Td point group, together with the significant splitting of both ν3 and ν4, strongly suggest the presence of coordinated sulfate anions and also a possible intra-molecular coupling between SO42− and OH−. Sample S4 (spectrum b) presents IR responses similar to the Tb2(OH)4SO4·2H2O sample reported recently [Citation16]. Compared with sample S1, S4 exhibits additional vibration features, as discussed below, though the hydroxyl absorptions are similarly observed at ∼ 3477, 840 and 531 cm−1. Firstly, water vibrations appear as a strong and broad band at ∼ 3242 cm−1 together with a relatively strong one at ∼ 1678 cm−1, which suggests that S4 is hydrated. Secondly, more splitting of ν3 into three bands and an expansion of the ν4 band from ∼ 780–625 cm−1 for S1 to ∼ 825–550 cm−1 for S4 are clearly seen, indicating that the SO42− tetrahedron in S4 is significantly more distorted. This is further evidenced by the appearances of not only ν1 (at ∼ 1005 cm−1) but also ν2 (∼ 475 cm−1) vibrations, since, like ν1, ν2 should also be IR inactive for a free SO42−. The enhanced distortion of the SO42− tetrahedron in S4 was believed to arise from intra-molecular H2O/SO42− interactions via hydrogen bonding. The coupling would distort the molecular structure of H2O at the same time, and thus additional hydroxyl absorption appears at ∼ 3600 cm−1. The less defined absorption at ∼ 1445 cm−1 on spectrum (b) conforms to the characteristic vibration of CO32−, and may be due to chemical adsorption of atmospheric CO2 on particle surfaces.
Figure 3 FTIR spectra for precursors (a) S1 and (b) S4.
Thermal decomposition of the layered hydroxyl precursors to oxysulfide phosphors
Figure shows thermogravimetry analysis (TGA)/DSC curves of the Ln2(OH)4SO4·2H2O precursor (S4) recorded in flowing Ar (5 ml min−1) at a heating rate of 10 °C min−1. The microprism precursor (S5) exhibits a similar thermal behavior and thus the data are not shown. It is seen that the basic sulfate decomposes via two major stages up to 1100 °C. The small weight loss (∼ 1.26%) from room temperature to ∼ 200 °C and the endotherm peaked at ∼ 185 °C on the DSC curve are largely due to the evaporation of surface adsorbed water. The weight loss of 6.53% between ∼200 and 300 °C is primarily due to the removal of hydration water, and is accompanied by an endothermic peak at ∼ 269 °C. The weight losses occurring in the range of ∼ 300–400 °C, accompanied by a sharp endotherm at ∼ 344 °C, can be attributed to dehydroxylation of the hydroxide layer. No significant weight loss was observed at the even higher temperatures up to 1100 °C, and the broad and ill-defined endotherm above 400 °C is an artifact. From the above TGA/DSC analysis, it can be concluded that the Ln2(OH)4SO4·2H2O (Ln = La and Eu) precursor decomposes according to the following procedure:
1
2
Figure 4 TGA/DSC profiles of precursor S4 (nanoplates).
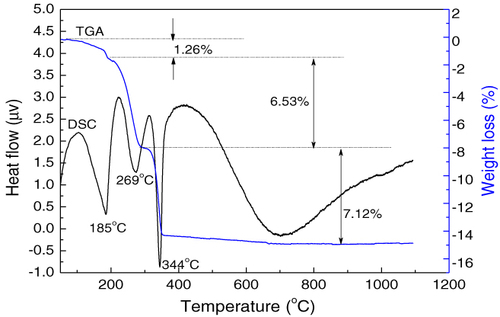
In addition, the weight losses of 6.53 and 7.12% observed for the dehydration and dehydroxylation stages follow closely the values of 7.51 and 8.12% calculated from the chemical formula, respectively.
Figure exhibits XRD patterns of the nanoplate precursor (S4, figure (a)) and the products calcined under flowing H2 at various temperatures for 1 h. The powder calcined at 400 °C (figure (b)) can be well indexed to the monoclinic structured Ln2O2SO4 phase (JCPDS No. 01-085-1534), and the XRD result is in accordance with TG/DSC analysis (figure ). The 600 °C powder is primarily of monoclinic Ln2O2SO4, with the presence of trace Ln2O2S (figure (c)), and hexagonally structured Ln2O2S (JCPDS No.01-075-1930) has resulted as a pure phase at 700 °C (figure (d)). As TG/DSC analysis revealed no composition change of Ln2O2SO4 up to 1100 °C in Ar, the above XRD results thus indicate that the H2 atmosphere used for calcination has a strong capability to take out oxygen atoms from SO42− even at a low temperature of 600–700 °C. Since no hazardous sulfurization reagents were used for precursor synthesis and the only exhaust gas during calcination is water vapor, the synthetic route developed in this work for Ln2O2S phosphor can be regarded as a green one. The powders calcined at even the higher temperatures of up to 1200 °C show identical positions of the XRD peaks but successively more refined peak shapes and improved peak intensities, indicating lattice perfection and crystallite growth. Compared with the standard JCPDS file (No. 01-075-1930) for La2O2S, the diffraction peaks of Ln2O2S slightly drifted to larger angles, indicating a contracted unit cell.
Figure 5 XRD patterns of the nanoplate precursor (a) and those calcined from (a) under flowing H2 (∼ 200 ml min−1) for 1 h at (b) 400, (c) 600, (d) 700, (e) 800, (f) 1000 and (g) 1200 °C. The standard diffractions of La2O2S (JCPDS No. 01-075-1930) are included as bars for comparison (h).
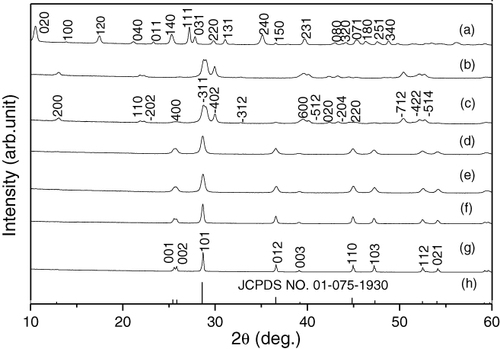
By applying equations 1/d2 = (h2 + k2 + l2)/a2 and 2d sin = nλ, the lattice parameters of Ln2O2S were calculated to be a = b = 0.399 38 nm and c = 0.685 38 nm for the 1200 °C sample, which are indeed smaller than those of pure La2O2S (JCPDS No. 01-075-1930; a = b = 0.404 00 nm and c = 0.689 00 nm). This is due to the smaller ionic radius of Eu3+ than La3+ (for seven-fold coordination in hexagonal Ln2O2S, La3+ and Eu3+ have their respective sizes of 1.10 and 1.01 nm) [Citation1, Citation23], and is a manifestation of solid solution formation.
Morphology analysis of the (La,Eu)2O2S red phosphors
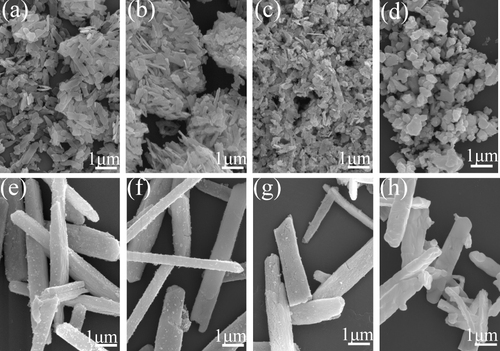
Figure shows morphology evolution of the nanoplate (S4) and microprism (S5) precursors upon calcination. It is seen from the FE-SEM micrographs that the powders derived from S4 well preserved the original thin-platelet morphologies up to 700 °C (figure (b)), at which point the powder had turned into pure Ln2O2S (figure ). The platelets partially collapse into much smaller particles at 1000 °C (figure (c)), followed by an almost complete disintegration at 1200 °C to form submicron-sized particles of relatively good dispersion and somewhat irregular shapes (figure (d)). The prismatic particles of S5 are highly stable in morphology against calcination of up to 1200 °C, due to their much larger lateral sizes and particular thickness, although cracks arising from thermal decomposition and crystallite growth are observable (figures (e)–(h)).
Figure 6 FE-SEM micrographs showing morphologies of the products calcined from precursors S4 (a)–(d) and S5 (e)–(h) at (a), (e) 400, (b), (f) 700, (c), (g) 1000 and (d), (h) 1200 °C for 1 h in flowing H2.
Luminescence behaviors of the (La,Eu)2O2S red phosphors
Figure reveals the effects of calcination temperature on emission and excitation properties of the (La,Eu)2O2S red phosphors derived from precursor S4. The PLE spectra are obtained by monitoring the strongest red emission at 627 nm, and the PL spectra are measured under UV excitation at 340 nm. It is seen from the PLE spectra (figure (a)) that a higher calcination temperature, particularly above 1000 °C, produces significantly stronger excitation bands. The paired broad peaks at ∼ 275 and 340 nm are ascribed to different transitions by CT. To be more specific, the one located at ∼ 275 nm is owing to the electron transition from the 2p orbital of O2− to the 4f orbital of Eu3+ (O2− → Eu3+) [Citation24] and the stronger one centered at ∼ 340 nm is attributed to S2− → Eu3+ CT transition. The higher covalency of S–Eu than O–Eu bonds (S and O have their respective electronegativities of 2.58 and 3.44) allows much easier electron transfer to Eu3+, and thus the S2− → Eu3+ CT band appears at a longer wavelength (lower energy) with an appreciably higher intensity. In each spectrum, the weaker and sharper peaks observed in the wavelength region of ∼ 390–500 nm belong to the intra f–f transitions of Eu3+, and are originated from the 7F0 → 5L6 transition at 395 nm, the 7F0 → 5D1 at 418 nm, the 7F0 → 5D2 at 468 nm and the 7F1 → 5D2 at 475 nm.
Figure 7 PLE and PL spectra of the (La,Eu)2O2S phosphors calcined from the nanoplate precursor (S4) at various temperatures for 1 h. The inset in panel (b) is the average crystallite size as a function of calcination temperature.
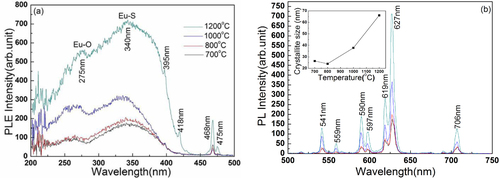
Figure (b) shows the emission spectra recorded under 340 nm excitation. The observed PL bands are ascribed to the transitions from the 5DJ excited sates to the different 7FJ levels of Eu3+ ground states. More specifically, the emissions at lower energies (597, 619/627 and 706 nm) arise from the 5D0 → 7FJ (J = 1, 2 and 4) transitions while the higher energy ones (541, 559 and 590 nm) from the 5D1 →7FJ (J = 1, 2 and 3) transitions, respectively. The Eu3+ activators are expected to replace La3+ and thus inherit the C3V point symmetry of La3+ in hexagonal La2O2S [Citation1]. The low site symmetry of Eu3+ thus allows the forced electric dipole 5D0 → 7F2 transition to appear significantly stronger than the magnetic dipole 5D0 → 7F1 transition according to the Judd–Ofelt parity law [Citation25, Citation26]. The most intense emission was observed as splits at 619 and 627 nm, and thus the phosphor emits a bright red color. Color coordinates of the emission were calculated from the PL spectra to be around (0.61, 0.39), irrespective of the synthesis temperature, conforming to a vivid red color in the Commission Internationale de L'Eclairage (CIE) chromaticity diagram. The PL bands do not change obviously in their positions but exhibit appreciably improved intensities at a higher synthesis temperature of the phosphor. To be more precise, an 87% increase was yielded with a 200 °C temperature increase from 800 to 1000 °C, and another 200 °C temperature increase from 1000 to 1200 °C improves the emission intensity by 99%. The enhancements may mainly be due to the removal of surface dangling bonds and particularly hydroxyls, crystal perfection and crystallite growth (the inset in figure (b)). It is noteworthy that the significant improvement from 1000 to 1200 °C may also arise from the complete collapse of plate-like particles into relatively rounded ones. The morphology change may appreciably reduce the scattering of excitation light, and thus improves excitation absorption to yield higher CT and emission intensities.
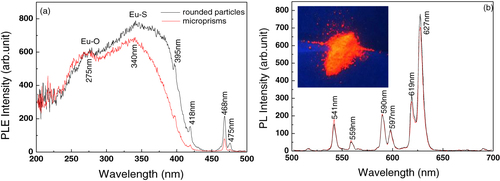
Particle morphology may appreciably affect the luminescence properties of a phosphor [Citation27]. Figure compares PLE/PL behaviors of the two phosphor powders shown in figures (d) and (h) (both calcined at 1200 °C). Clearly, the rounded particles (figure (d)) exhibit a stronger S–Eu CT band (figure (a)) and more intense emission (figure (b), ∼ 10.5% stronger for the 627 nm peak) than the microprisms shown in figure (h). Phosphors of bigger particles are normally observed to exhibit stronger luminescence since their smaller specific surface area allows less scattering and hence better absorption of the excitation light. The reverse finding in this work may mainly be due to the different extents of crystallization. Since the microprismatic precursor particles are significantly larger, they may not be as evenly heated from the particle surface to the interior as compared to their nanoplate counterparts under identical calcination. That is, the relatively low crystallinity in the center region of the prismatic phosphor particles may have led to the observed inferior luminescence. Such an explanation is supported by the PLE results shown in figure (a), from which it is seen that the O2− → Eu3+ CT bands have almost identical intensities for the two phosphors but the S2− → Eu3+ CT band is weaker for the microprism phosphor. These may indicate that the Ln–O bonds (Ln = La and Eu) are equally well developed in the two phosphors but the Ln–S ones, formed after Ln–O at higher temperatures, are less well developed in the microprism phosphor owing to non-uniform crystallization.
Figure 8 (a) PLE and (b) PL spectra of the (La,Eu)2O2S phosphors shown in figure (d) (rounded particles) and figure (h) (microprisms). The PLE spectra were recorded by monitoring the 627 nm emission while the PL spectra were taken under 340 nm excitation. The inset in part (b) is the appearance of red emission (digital photograph) of the phosphor powder shown in figure (d). The picture was taken under 254 nm irradiation of the phosphor from a hand-held UV lamp.
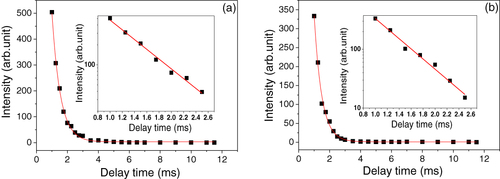
Fluorescence decay kinetics of the 627 nm emission are shown in figure for the two phosphors calcined at 1200 °C (excitation: 340 nm). The decay data can be fitted to single exponentials (the red curves) according to equation I = A exp(− t/τ) + B, where τ is the fluorescence lifetime, t the delay time, I the emission intensity, and A and B are constants, as also seen from the good linear relationships between log I and t on the semi-log plots (the insets). The fittings yielded τ = 0.54 ± 0.01 ms, A = 3111.6 and B = 3.2 for the rounded phosphor particles (figure (a)) and τ = 0.49 ± 0.01 ms, A = 2533.8 and B = 1.1 for the microprismatic ones (figure (b)). The lifetimes determined in this work are also in general agreement with the previously reported values of ∼ 0.2–0.7 ms for Eu3+ emission in La2O2S:Eu3+ [Citation1, Citation28].
Figure 9 Fluorescence decay analysis of the 627 nm emission for (a) the rounded and (b) microprismatic (La,Eu)2O2S phosphor particles calcined in H2 at 1200 °C for 1 h. The insets are the semi-log (log I–t) plots of the decay data.
Conclusions
Facile and clean synthesis of (La0.95Eu0.05)2O2S red phosphors with controlled particle morphologies has been achieved via calcination in hydrogen of Ln2(OH)4SO4·2H2O (Ln = La and Eu) layered hydroxyl sulfate precursors prepared via hydrothermal reaction at 120 °C. Characterizations of the products via XRD, DSC/TG, FTIR, FE-SEM, PLE/PL and fluorescence decay analysis have yielded the following main conclusions:
| (1) | Solution pH is the decisive factor controlling properties of the hydrothermal product. Low pH up to ∼ 7.5 yields La(OH)SO4 while higher pH values of 9.0 and 10 produce pure phases of the intended Ln2(OH)4SO4·2H2O. A mixture of the two compounds is observed at the intermediate pH of 8.0. The crystallites of Ln2(OH)4SO4·2H2O change from thin platelets to significantly larger microprisms by raising the reaction pH from 9.0 to 10. Good dispersion is observed for both the types of precursor particles. | ||||
| (2) | The Ln2(OH)4SO4·2H2O precursor compounds decompose to Ln2O2S via hydrogen annealing at a minimum temperature of 700 °C via a Ln2O2SO4 intermediate. The precursor platelets collapse into submicron-sized Ln2O2S particles of rounded shapes while the microprisms well retain their initial shapes up to 1200 °C, yielding phosphor powders of two distinctive particle morphologies. | ||||
| (3) | The resultant (La0.95Eu0.05)2O2S phosphors exhibit the typical emissions of Eu3+ in a hexagonal host lattice, with the strongest red emission (the 5D0 → 7F2 transition of Eu3+) located at 627 nm irrespective of particle morphology. The 627 nm red emission exhibits a single exponential decay behavior, and the fluorescence lifetime was determined to be ∼ 0.5 ms for both the phosphors. | ||||
| (4) | Calcining the phosphors above 1000 °C significantly improves intensities of the PLE/PL bands for both the phosphors. After identical processing at 1200 °C, the rounded phosphor particles show better luminescence than the microprismatic ones owing to their higher extent of crystallization and better development of Eu–S bonds. | ||||
Acknowledgments
This work was supported in part by the National Natural Science Foundation of China (grant no. 51172038), The Program for New Century Excellent Talents in University (NCET-11-0076), Fundamental Research Funds for the Central Universities (grant no. N110802001) and China Postdoctoral Science Special Foundation (grant no. 2013T60291).
Related Research Data
References
- DaiQ LSongH WWangM YBaiXDongBQinR FQuX SZhangH 2008 J. Phys. Chem. C 112 19399 10.1021/jp808343f
- PiresA MSerraO ADavolosM R 2004 J. Alloys Compounds 374 181 10.1016/j.jallcom.2003.11.088
- ChoS HYooJ SLeeJ D 1998 J. Electrochem. Soc. 145 1017 10.1149/1.1838380
- KangC CLiuR SChangJ CLeeB J 2003 Chem. Mater. 15 3966 10.1021/cm0344212
- WuX LLiJ-GLiJ KZhuQLiX DSunX DSakkaY 2013 Sci. Technol. Adv. Mater. 14 015006 10.1088/1468-6996/14/1/015006
- LiJ KLiJ-GZhangZ JWuX LLiuS HLiX DSunX DSakkaY 2012 Sci. Technol. Adv. Mater. 13 035007 10.1088/1468-6996/13/3/035007
- ZhuQLiJ-GLiX DSunX DSakkaY 2011 Sci. Technol. Adv. Mater. 12 055001 10.1088/1468-6996/12/5/055001
- PopoviciE JMuresanLHristea-SimocAIndreaEVasilescuMNazarovMJeonD Y 2004 Opt. Mater. 27 559 10.1016/j.optmat.2004.07.006
- KottaisamyMHorikawaKKominamiHAokiTAzumaNNakamuraTNakanishiYHatanakaY 2000 J. Electrochem. Soc. 147 1612 10.1149/1.1393405
- FuZ LGengYChenH WZhouS HYangH KJeong J H 2008 Opt. Mater. 31 58 10.1016/j.optmat.2008.01.008
- LlanosJSanchezVMujicaCBuljanA 2002 Mater. Res. Bull. 37 2285 10.1016/S0025-5408(02)00936-4
- YuS HHanZ HYangJZhaoH QYangR YXieYQian Y TZhangY H 1999 Chem. Mater. 11 192 10.1021/cm9805469
- DhanarajJGeethalakshmiMJagannathanRKuttyT R N 2004 Chem. Phys. Lett. 387 23 10.1016/j.cplett.2004.01.079
- LiuZ GSunX DXuS KLianJ BLiX DXiuZ MLiQHuoDLiJ-G 2008 J. Phys. Chem. C 112 2353 10.1021/jp0764687
- PengH SHuangS HYouF TChangJ JLuS ZCaoL 2005 J. Phys. Chem. B 109 5774 10.1021/jp0453414
- LiangJ BMaR ZGengF XEbinaY SSasakiT 2010 Chem. Mater. 22 6001 10.1021/cm102236n
- ZehnderR A 2011 Inorg. Chem. 50 836 10.1021/ic101350f
- PoudretLPriorT JMcIntyreL JFoggA M 2008 Chem. Mater. 20 7447 10.1021/cm802301a
- GengF XMatsushitaYMaR ZXinHTanakaMIzumiFIyiNSasakiT 2008 J. Am. Chem. Soc. 130 16344 10.1021/ja807050e
- GengF XMatsushitaYMaR ZXinHTanakaMIyiNSasakiT 2009 Inorg. Chem. 48 6724 10.1021/ic900669p
- ThompsonL C 1979 Handbook on the Physics and Chemistry of Rare Earths vol 3 GschneidnerK AJrEyringL R Amsterdam North-Holland Physics 209 296 pp 209–96
- GadsdenJ A 1975 Infrared Spectra of Minerals and Related Inorganic Compounds Newton , MA Butterworth
- ShannonR D 1976 Acta Crystallogr. A 32 751 10.1107/S0567739476001551
- BuijsMMeyerinkABlasseG 1987 J. Lumin. 37 9 10.1016/0022-2313(87)90177-3
- JuddB R 1962 Phys. Rev. 127 750 10.1103/PhysRev.127.750
- OfeltG S 1962 J. Chem. Phys. 37 511 10.1063/1.1701366
- Rodriguez-RojasR ADe la Rosa-CruzEDiaz-TorresL ASalasPMelendrezRBarboza-FloresMMeneses-Nava M ABarbosa-GarciaO 2004 Opt. Mater. 25 285 10.1016/j.optmat.2003.07.001
- YapS VRansonR MCrantonW MKoutsogeorgisD CHixG B 2009 J. Lumin. 129 416 10.1016/j.jlumin.2008.10.019