
Abstract
A fine layered nanocomposite with a total thickness of about 200 nm was formed on the surface of an Al63Cu25Fe12 quasicrystal (QC). The nanocomposite was found to exhibit high catalytic performance for steam reforming of methanol. The nanocomposite was formed by a self-assembly process, by leaching the Al–Cu–Fe QC using a 5 wt% Na2CO3 aqueous solution followed by calcination in air at 873 K. The quasiperiodic nature of theQC played an important role in the formation of such a structure. Its high catalytic activity originated from the presence of highly dispersed copper and iron species, which also suppressed the sintering of nanoparticles.
Introduction
Quasicrystals (QCs) are a novel form of matter, which are neither crystalline nor amorphous. They were first discovered in 1984 [Citation1], which led to Dan Shechtman receiving the Nobel Prize in Chemistry in 2011. The diffraction patterns obtained from QCs exhibit sharp spots with forbidden five-fold symmetry, indicating the presence of an unusual atomic structure with a long-range order similar to that found in crystals [Citation2]. Due to their unique structure, it has been anticipated that QCs would exhibit intriguing physical and/or chemical properties. It was subsequently found that they are promising precursors for the fabrication of high-performance nanocomposite catalysts when they are subjected to a leaching treatment [Citation3–Citation6]. Tsai and Yoshimura first employed leaching with a NaOH aqueous solution to prepare catalysts from Al–Cu–Fe QCs [Citation3, Citation4]. The resulting catalysts had a higher reactivity and thermal stability than typical copper catalysts for steam reforming of methanol (SRM) [Citation3, Citation4]. In order to elucidate the origin of the high catalytic performance, we previously carried out a microstructural analysis using cross-sectional transmission electron microscopy (TEM) observations of Al–Cu–Fe QC catalyst particles [Citation7, Citation8]. The results indicated that the quasiperiodic structure of the QC was stable during leaching, which resulted in a relatively low dissolution rate for Al, leading to the formation of a homogeneous leached layer that was responsible for the high activity and stability during SRM. However, for QC catalysts leached with NaOH(aq), a degradation of catalytic activity was observed at high temperatures (> 613 K) due to a decrease in thermal stability [Citation9], which is a drawback of QC catalysts.
The microstructure of the leached layer is mainly controlled by the Al dissolution rate during leaching. A low dissolution rate gives rise to a homogeneous leached layer exhibiting a high catalytic performance. We previously reported that an Al–Cu–Fe QC leached in Na2CO3(aq) exhibited excellent catalytic performance for SRM [Citation9, Citation10]. Interestingly, no sintering of copper particles on the QC catalyst was detected by x-ray diffraction (XRD) even after SRM was carried out at 633 K [Citation9, Citation10]. Recently, the activity of Al–Cu–Fe QC catalysts leached in alkaline aqueous solutions was found to be significantly improved by further calcination in air at 873 K [Citation11]. This behavior contrasts with that observed for typical catalysts, where calcination leads to sintering and a serious loss of catalytic activity [Citation12].
In this communication, we demonstrate that surface activation of the Al–Cu–Fe QC is a simple method for synthesizing catalysts with high performance and thermal stability. Additionally, we clarify the origin of the high catalytic performance of the Al–Cu–Fe QC using cross-sectional TEM observations.
Experimental
Al63Cu25Fe12 quasicrystalline alloy (Al–Cu–Fe QC) was prepared from Al, Cu and Fe with purities of 99.9 wt% in an arc furnace under an Ar atmosphere. The alloy was annealed in vacuum at 1073 K for 24 h to achieve homogeneity, and was subsequently crushed in a ball mill to a powder with particle sizes of <150 μm. Details of the preparation method have been previously reported [Citation3, Citation4]. The particle surface area was determined using a Brunauer–Emmett–Teller (BET) analysis. The pore structure and pore size distributions in the samples were obtained from N2 adsorption–desorption isotherms at 77 K. The powdered samples were leached in a 5 wt% Na2CO3 aqueous solution for 4 h at room temperature, and then filtered and washed thoroughly with distilled water until no alkali was detected in the filtrate. In order to investigate the effect of various treatments, some leached samples were calcined in air at 873 K for 3 h. A subset of these samples was subsequently reduced in H2 at 873 K for 3 h. Finally, some of these samples were recalcined in air at 873 K for 3 h. The sample designations are given in table . The concentration of metal ions dissolved in the leaching solution was analyzed by inductively coupled plasma-optical emission spectrometry (ICP-OES) measurement. The crystal structure of each sample was determined by XRD (Rigaku RINT 2500) using Cu Kα (λ = 1.543 Å) radiation. The reduction temperature for Cu on the Al–Cu–Fe QC catalyst was measured using a H2 temperature-programed reduction (H2-TPR) technique. The sample was heated in a 5% H2/Ar flow (30 ml min−1) at a heating rate of 5 K min−1, and H2 consumption was monitored. Cross-sectional TEM observations of catalyst particles were performed using a JEOL 2010 electron microscope equipped with an energy dispersive x-ray spectroscopy (EDS) system at an accelerating voltage of 200 kV. Details of the specimen preparation have been previously published [Citation7, Citation8]. Scanning electron microscopy (SEM) observations were performed using a Hitachi S-900 at 15 kV [Citation7, Citation8]. SRM reaction was carried out in a conventional flow reactor at 100 kPa. The sample was pretreated at 513 K under H2 flow for 1 h just before SRM reaction. The inlet partial pressures of methanol, water and nitrogen were 35.5, 52.7 and 13.2 kPa, respectively. The liquid hourly space velocity of CH3OH/H2O mixture was 30 h−1. Here, the nitrogen was used as a dilutent. The products were monitored by on-line gas chromatography [Citation3, Citation4]. The catalytic activity for SRM was evaluated based on the H2 production rate when the reaction reached steady state after 30 min.
Table 1. List of each samples’ pretreatments and surface areas.
Results and discussion
Figure (A) shows the H2 production rate per unit catalyst surface area (ml min−1 m−2-cat) as a function of reaction temperatures for samples BL, AL and AL(873). For comparison, the H2 production rate for a commercial Cu/Al/Zn catalyst (COM) is also shown. It can be seen that for all temperatures, sample AL exhibits a much higher activity than sample BL, indicating that leaching with Na2CO3(aq) is effective at promoting catalytic activity by increasing the surface area (SBET in table ). At temperatures above 593 K, the activity of sample AL is even better than that of a conventional Raney copper catalyst and that of an Al–Cu–Fe QC leached using NaOH(aq) [Citation9, Citation10]. A surprising result is that sample AL(873) exhibits even higher activity than sample AL. It is generally thought that heat treatment even at 573 K leads to sintering of Cu particles [Citation9] and a serious deactivation of catalytic activity [Citation12]. However, for AL(873), the catalytic activity improves and is almost one order of magnitude higher than that of the commercial catalyst.
Figure 1 (A) Rate of H2 production versus reaction temperature during SRM over different catalysts: (AL; •) uncalcined QC catalyst, (AL(873); ▴) QC catalyst following calcination in air at 873 K, (BL; ○) unleached QC and (COM; ⋄) commercial catalyst. (B) XRD patterns for QC catalysts after different treatments. (C) H2-TPR profiles for AL, AL(873) and CuO samples obtained with heating rate of 5 K min−1 in 5% H2/Ar. (D) Rate of H2 production versus reaction temperature for SRM over different catalysts: (○) AL, (△) (AL(H873); blue ▴) reduction in H2 at 873 K and (AL(re873); red ▴) (blue ▴) followed by re-calcination in air at 873 K.
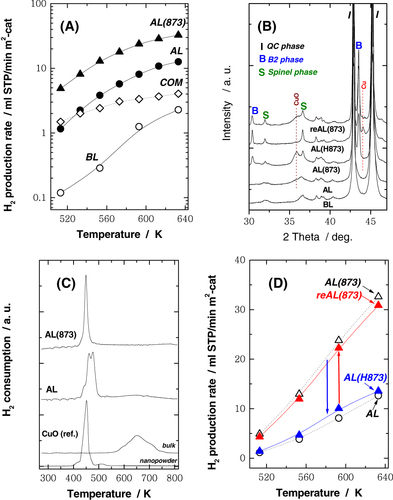
Figure (B) shows powder XRD patterns for QC catalysts subjected to different treatments. For the sample BL, the peaks corresponded mainly to a single QC phase. It can be seen that for sample AL following leaching, no significant changes are observed. There are no separate peaks associated with Cu, Al, Fe or their oxides, implying that these are only present in highly disordered or nanoparticle states, so that any diffraction peaks are rendered invisible due to line-broadening. On the other hand, for the calcined AL(873) sample, peaks due to CuO, spinel and B2 phases appear. Diffraction peaks of the spinel phase are mainly derived from γ Al2O3 and CuAl2O4 phases. It should be noted that γ Al2O3 has been regarded as a spinel: Al8/3( )1/3O4, ( ) denotes a vacancy [Citation13]. The B2 phase is formed by calcination at high temperatures (e.g. 873 K) and is considered to be inactive for the SRM even at 633 K [Citation11].
Figure (C) shows the H2-TPR profiles for the QC catalysts and reference CuO samples (nanopowder and bulk). The peak around 460 K for the QC catalysts is attributed to reduction of highly dispersed copper oxides species [Citation14, Citation15], and is similar to that observed for the CuO nanopowder. In contrast, for the bulk CuO sample, a broad reduction peak is seen at around 650 K. This result suggests that formation of fine dispersed copper particles is responsible for the high catalytic activity of the AL and AL(873) samples, as shown in figure (A). Figure (D) shows the H2 production rate for the four leached QC catalysts. Interestingly, although the enhanced activity due to calcination is lost following, treatment in H2, it is almost fully recovered by repeated calcination in air. Clearly, the reduction–oxidation (redox) treatment brings about a reversible change in catalytic activity. Taken together with the results shown in figure , it is clear that formation of the B2 phase does not suppress the enhancement of activity brought about by the calcination treatment.
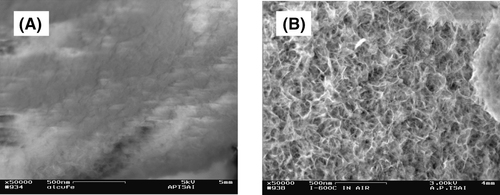
Figure shows SEM micrographs of the surfaces of the AL and AL(873) samples. The surface morphology is seen to be very different. Leaching with Na2CO3(aq) leads to the formation of alumina (or aluminum hydroxide) on the QC surface (2NaAlO2 + 4H2O → Al2O3·3H2O (or 2Al(OH)3)↓ + 2NaOH), while the leaching with NaOH(aq) does not lead to the formation of alumina since it is removed as water-soluble species NaAlO2 [Citation16]. The calcination treatment appears to introduce fine-scale surface roughness, with a consequent decrease in surface area and porosity (SBET in table ).
Figure 2 SEM images of surface of: (A) sample AL and (B) sample AL(873).
Figures (A) and (B) show cross-sectional bright-field TEM images and selected area electron diffraction (SAED) patterns obtained from samples AL and AL(873), respectively. The SAED patterns are from the regions indicated by the corresponding letters in the TEM images. The SAED patterns from region (a) in figure (A) exhibit five-fold symmetry, indicating that most particles have a QC structure even after leaching. At region (b) in figure (A), it is clear that a surface layer with a thickness of about 200 nm thick was formed by leaching. The structure of this new layer cannot be clearly resolved, but the SAED pattern was successfully indexed by Cu as shown in the figure. The SAED patterns from region (c) are halo-like, and this region is thought to be an amorphous phase containing Al and O. As seen in region (c) in figure (B), the calcination process produced an additional intermediate layer, which contains nanoparticles with different phases. Thus, the TEM results are generally consistent with the powder XRD results. In addition, the surface roughening observed in figure (B) is confirmed in region (d) of figure (B). The SAED patterns obtained from the leached regions contain both diffuse rings and weak diffraction spots, making it difficult to identify the phases present. Nevertheless, it is clear from the TEM image in figure (B) that a layered nanostructure was formed on the QC surface during the calcination treatment. This layered structure will now be discussed in more detail.
Figure 3 Cross-sectional TEM bright-field images of (A) sample AL and (B) sample AL(873). The SAED patterns were obtained from the corresponding regions indicated in (A) and (B).
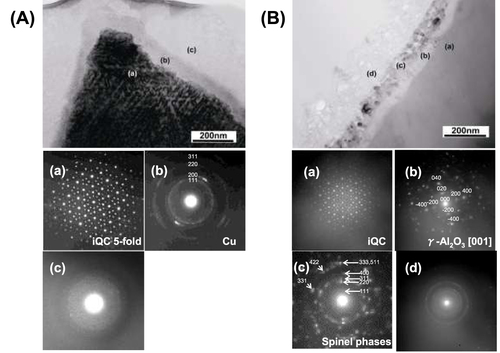
Figure shows a bright-field scanning TEM (STEM) image of the layered structure in sample AL(873), together with EDS elemental maps for O, Al, Cu and Fe. The distribution of each element is very distinct and two significant features should be noted. First, O and Al are concentrated in the layer closest to the QC phase (referred to as the first layer). In contrast, Cu and Fe are concentrated in the second layer, but are mutually separated in the upper and lower parts of this layer; the second layer also contains a considerable amount of O. Taken together with the powder XRD results, it is clear that the first layer is composed of dense Al2O3 with a thickness of about 50 nm, whereas the second layer is a 50 nm-thick nanocomposite consisting mainly of CuO and Fe oxide nanoparticles with a small amount of Al (oxides) with grain sizes less than 10 nm. This corresponds to the spinel structure indicated in the powder XRD pattern. It is assumed that the second layer is responsible for the high catalytic activity due to existence of the CuO nanoparticles, which are reduced to Cu during the H2 treatment. An increase in catalytic activity due to high-temperature oxidation has also been observed for bulk spinel CuFe2O4 [Citation17] as well as for Al–Cu–Fe sample leached using NaOH(aq) [Citation11], where the formation of a CuFe2O4 based spinel was a key factor. In both cases, the spinel acted as a precursor, and decomposed into Cu and Fe3O4 upon treatment in H2. Following decomposition of the bulk CuFe2O4 sample, it was found that Cu nano-particles were embedded in pores in the Fe3O4, and were the origin of the high activity. Based on the binary alloy equilibrium phase diagram, Fe is immiscible with Cu, i.e. they neither form compounds nor mutually dissolve in the solid state [Citation18]. Here, this immiscibility between Cu (or CuO) and Fe (or Fe oxide) plays an important role in keeping the Cu nanoparticles isolated when they are reduced. This is the origin of the high thermal stability and reversible change in microstructure and activity induced by redox treatment for the two above-mentioned samples. On the other hand, as shown in figure (B), only diffraction peaks associated with CuO, CuAl2O4 and γ Al2O3 are observed for the AL(873) sample, with no evidence for the formation of CuFe2O4. Although it is not clear from the XRD patterns, it is assumed that the Fe oxide phase is actually Fe3O4. From a careful examination of figure , it is clear that the Fe oxide region is concentrated in the lower part of second layer, close to the γ Al2O3 layer, whereas the CuO is concentrated in the upper part of the layer. Noting that γ Al2O3 (cubic: 7.937 Å) and Fe3O4 (cubic: 8.396 Å) have the same spinel structure, it is likely that the Fe3O4 is epitaxially stabilized by the underlying γ Al2O3. In addition, since CuAl2O4 (cubic: 8.075 Å) and γ Al2O3 have a similar spinel structure and lattice parameters, no visible change in the XRD peaks associated with the spinel phase was observed even after H2 reduction at 873 K (figure (B); CuAl2O4 + H2 → Cu + γAl2O3 + H2O). The existence of γ Al2O3 would favor the formation of spinel CuAl2O4 upon oxidation in the presence of Cu or CuO. However, we cannot exclude the possibility of formation of other spinel oxides such as CuFexAl2−xO4, which may not be distinguishable from composites of CuAl2O4 and Fe3O4 by XRD or EDS. In the present study, the catalytic behavior of the AL(873) sample is thought to be more like that of a supported catalyst, in that Cu nanoparticles are supported on Fe3O4 or partially supported on γ Al2O3. Nevertheless, a reversible change in activity induced by the redox treatment was clearly observed, as shown in figure (D), and this could be associated with a reversible transformation between CuO and Cu. Although this is not certain at present, based on the standard enthalpy of formation for CuAl2O4 (ΔHf = −1946.9 kJ mol−1) and CuFe2O4 (ΔHf = −969.0 kJ mol−1), the former is more stable, so that CuO is likely to exhibit a higher reactivity with Al2O3 [Citation19]. Apart from its catalytic activity, the formation of multiple layers in the AL(873) sample is also of considerable interest. The first is a dense Al2O3, the second is a composite of Cu and Fe oxides and the third is a porous-like Al2O3 layer. The presence of the dense homogeneous Al2O3 layer is especially intriguing. There have been a large number of reports on artificial metal/oxide multilayered structures prepared by sputtering or molecular beam epitaxy [Citation20–Citation22], but all involved vapor-phase processes in a well-controlled environment. To the best of our knowledge, this is the first example of a homogeneous Al2O3 layer formed using a non-vapor-phase method. In addition, the triple-layer structure in the present study was produced by the equivalent of a self-assembled process, involving only leaching and oxidation treatments.
Figure 4 Cross-sectional STEM images of sample AL(873); EDS elemental maps for Al, Cu, Fe and O.

The ability to form such a unique structure is closely related to the quasiperiodic nature of the QC surface and the leaching process. There is a strong fluctuation in the Al concentration along the five-fold axes in the Al–Cu–Fe QC [Citation23], with atomic layers with more than about 80 at.% Al alternating with atomic layers containing less than about 60 at.% Al. This has been verified by several surface science studies on the five-fold symmetric planes of QCs [Citation24, Citation25], whose surfaces are always terminated by an Al-rich layer with a high atomic density. Since the concentration of Al dominates the leaching process, leaching would be suppressed for layers with a low Al content and the overall dissolution rate would decrease, thus giving rise to a fine homogeneous composite layer with high catalytic performance. We have previously reported that the dissolution rate of Al is much lower for an Al–Cu–Fe QC than for a crystalline ω-phase Al70Cu20Fe10 [Citation7].
The present study reveals the potential of the combined leaching and calcination method for fabricating fine nanocomposite materials with high catalytic performance. It can also be applied to other Al-based quasicrystalline materials such as Al–Pd–Mn and Al–Ni–Co QCs. Its simplicity makes it an attractive process for applications such as practical plate-type catalysts.
Conclusions
Surface activation of an Al–Cu–Fe QC to achieve high catalytic performance was demonstrated in this communication. The quasiperiodic structure of the QC was found to be stable during leaching with Na2CO3(aq), and directly contributed to the low Al dissolution rate, which led to the formation of a homogeneous leached layer that was responsible for the high SRM activity and high thermal stability of copper nanoparticles. Interestingly, the catalytic performance increased following calcination in air at 873 K. These properties are attributed to the immiscibility of Fe with Cu and their interaction with aluminum oxides. The results indicate that this is a very promising method for producing high-performance copper-based catalysts.
Acknowledgments
The authors are grateful to Professor Kenji Tsuda (IMRAM Tohoku University) for fruitful discussion and Mr Eiji Aoyagi (IMR Tohoku University) for STEM observations. This work was supported in part by Grant-in-Aid for Scientific Research (A) 23247117, (B) 24360329 and Challenging Exploratory Research 24656484 from the Ministry of Education, Culture, Sports, Science and Technology (MEXT).
Related Research Data
References
- ShechtmanDBlechI AGratiasDCahnJ W 1984 Phys. Rev. Lett. 53 1951 10.1103/PhysRevLett.53.1951
- KittelC 1986 Introduction to Solid State Physics New York Wiley p 8
- TsaiA PYoshimuraM 2001 Appl. Catal. A 214 237 10.1016/S0926-860X(01)00500-2
- YoshimuraMTsaiA P 2001 J. Alloys Compounds 342 451 10.1016/S0925-8388(02)00274-8
- NgocB PGeantetCDalmonJ AAouineMBergeretGDelicherePRaffySMarlinS 2009 Catal. Lett. 131 59 10.1007/s10562-009-0018-8
- HighfieldJLiuTLooY SGrushkoBBorgnaA 2009 Phys. Chem. Chem. Phys. 11 1196 10.1039/b811775f
- TanabeTKameokaSSatoFTerauchiMTsaiA P 2007 Phil. Mag. 87 3103 10.1080/14786430701365017
- TanabeTKameokaSTsaiA P 2010 Appl. Catal. A 384 241 10.1016/j.apcata.2010.06.045
- KameokaSTanabeTTsaiA P 2004 Catal. Today 93–95 23 10.1016/j.cattod.2004.05.010
- TanabeTKameokaSTsaiA P 2006 Catal. Today 111 153 10.1016/j.cattod.2005.11.003
- TanabeTKameokaSTsaiA P 2011 J. Mater. Sci. 46 2242 10.1007/s10853-010-5063-6
- TwiggM VSpencerM S 2003 Top. Catal. 22 191 10.1023/A:1023567718303
- SoledS 1983 J. Catal. 81 252 10.1016/0021-9517(83)90163-X
- DongLLiuZHuYXuBChenY 1998 J. Chem. Soc. Faraday Trans. 94 3033 10.1039/a803630f
- DowW-PWangY-PHuangT-J 1996 J. Catal. 160 155 10.1006/jcat.1996.0135
- WainwrightM S 1997 Handbook of Heterogeneous Catalysis vol 1 ErtlGKnozingerHWeitkampJ Weinheim Wiley-VCH p 64
- KameokaSTanabeTTsaiA P 2010 Appl. Catal. A 375 163 10.1016/j.apcata.2009.12.035
- MassalskiT B 1990 Binary Alloy Phase Diagrams vol 2 2nd edn Ohio ASM International p 1408
- KubaschewskiOAlcockC BSpencerP J 1993 Materials Thermochemistry6th edn Oxford Pergamon p 282
- TakanashiKMitaniSSanoMFujimoriH 1995 Appl. Phys. Lett. 67 1016 10.1063/1.114715
- PaniagoRForrestRChowP CMossS C 1997 Phys. Rev. B 56 13442 10.1103/PhysRevB.56.13442
- GrondilovaJRickartM 2002 J. Appl. Phys. 91 8246 10.1063/1.1452224
- YamamotoATakakuraHTsaiA P 2003 Phys. Rev. B 68 094201 10.1103/PhysRevB.68.094201
- GiererMHoveM A VGoldmanA IShenZChangS-LJenksC JZhangC-MThielP A 1997 Phys. Rev. Lett. 78 467 10.1103/PhysRevLett.78.467
- SharmaH RFourneeVShimodaMRossA RLograssoT ATsaiA PYamamotoA 2004 Phys. Rev. Lett. 93 165502 10.1103/PhysRevLett.93.165502