
Abstract
The discovery in 1987 of stable quasicrystals in the Al–Cu–Fe system was soon exploited to patent specific coatings that showed reduced friction in ambient air against hard antagonists. Henceforth, it was possible to develop a number of applications, potential or commercially exploited to date, that will be alluded to in this topical review. A deeper understanding of the characteristics of complex metallic alloys (CMAs) may explain why material made of metals like Al, Cu and Fe offers reduced friction; low solid–solid adhesion came later. It is linked to the surface energy being significantly lower on those materials, in which translational symmetry has become a weak property, that is determined by the depth of the pseudo-gap at the Fermi energy. As a result, friction is anisotropic in CMAs that builds up according to the translation symmetry along one direction, but is aperiodic along the other two directions. A review is given in this article of the most salient data found along these lines during the past two decades or so.
1. Introduction
The discovery of a stable icosahedral quasicrystal in the Al–Cu–Fe system [Citation1], followed shortly by that of stable decagonal quasicrystals in Al–Ni–Co and Al–Cu–Co alloys [Citation2], has allowed soon afterwards one of us to patent several application niches of those materials [Citation3, Citation4]. Among other applications was the possibility to use coatings made thereof to reduce friction and adhesion against other metallic solids, which led later on to a more systematic study of the physical origin of this effect. This article gives an overview of the most salient features pointed out in contact mechanics, using quasicrystals sliding against different types of antagonists like hard chromium steel and diamond at a macroscopic level, or an atomic force microscope (AFM) tip in an ultra-high vacuum at the microscopic level.
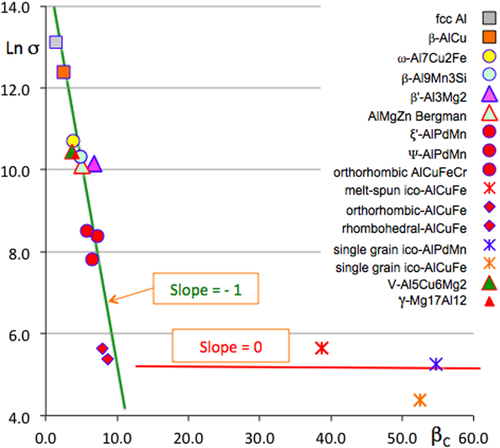
Quasicrystals are ordered crystals in the usual sense that they diffract electrons or x-rays and form sharp diffraction patterns, which however, exhibit no translational symmetry, but may be referred to as a higher dimensional cubic lattice from which they are inferred in a one-to-one correspondence by a cut scheme (see for instance [Citation5] and the references therein). This awkward jargon is explained elsewhere in this focus on complex metallic phases. Complex metallic phases, or complex metallic alloys (CMAs [Citation6]) encompass those metallic crystals that contain at least a few tens of atoms per unit cell, and, as the ultimate stage of complexity, quasicrystals. As illustrated in figure , transport properties of CMAs vary over orders of magnitude with increasing lattice complexity: the larger the number of atoms in the unit cell, the less conductive the crystal is. We will show later in this article that, similarly, friction and adhesion to a hard metal are partly dependent upon the lattice complexity of the CMA antagonist, an extreme being realized with quasicrystalline samples.
Figure 1 Natural logarithm (denoted Ln) of the inverse resistivity (or conductivity) σ at 4 K plotted versus β C, the natural logarithm of the number of atoms in the unit cell. The index β C measures the complexity of the lattice and is introduced in detail in [Citation4]. It does not become infinite in a quasicrystal, although a unit cell cannot be defined any longer because every sample is of finite size (grain size in a multi-grained specimen, or size of a single grain crystal). The correspondence between symbols and compounds is indicated in the right-hand side of the figure. Data align on a straight line with the slope equal to −1, which is indicative of it being self-organized criticality, as first introduced by Dubois [Citation4].
The article is organized in ten sections. We start with experimental details about the preparation metallurgy of the specimens, the pin-on-disk and fretting devices used and their conditions of use, as well as specific details regarding the experimental determination of partial densities of states that become relevant by the end of the paper. Friction against a hard material in ambient air, and far more so under a vacuum, leads to the surprising measurement of a reduced friction coefficient compared to materials of similar mechanical properties, especially hard steel and aluminum oxide, which are relevant to the elemental constituents of the quasicrystal. The main data gained from such comparisons will be reported in section 3. Experiments performed in an ultra-high vacuum using single grain samples sliding on top of each other and the discovery of friction anisotropy in decagonal quasicrystalsFootnote 3 supplies the matter of the next section. It is followed by a section dedicated to the pin-on-disk data obtained in a secondary vacuum using a large variety of CMA samples, therefore of composition, hardness, and electronic structure. We show then how such data may be used to derive an estimate of the upper limit of the surface energy and we present a rather large list of experimental results that could not have been derived from experiments on single crystals at the approach of the melting point, or from computer simulations owing to the complexity of the lattices involved. Solid–solid adhesion and fretting test results are introduced in the following section, with a view to some potential applications in aerospace or ultra-high vacuum technologies. To end with, section 8 introduces some of the views about the interpretation of all the data in terms of partial densities of states and electronic transfer through the contact area. For the sake of illustration of the usefulness of CMAs regarding friction and energy savings, the last but one section describes an application niche, that is commercially available and combines electronic and mechanical properties to achieve light-weight composites offering much lower friction against steel than state-of-the-art composites. Finally, a perspective view and conclusions are given in the last section.
Experimental details
Most of the samples used for our tribological studies were prepared by a sintering technique, starting from crushed powders of the appropriate composition. The use of uniaxial pressure to close the inter-grain porosity is described elsewhere [Citation7], whereas information about isostatic pressurisation can be found in [Citation8]. We will also refer in this review to data gained on single crystals grown by Czochralsky pulling at the Juelich Research Centre in Germany [Citation9]. Coatings were widely studied in view of contact mechanics applications. They may be produced either by plasma torch spraying, starting from atomised powders preferably [Citation10], or by physical vapour deposition. The interested reader may find more information on this topic in [Citation5].
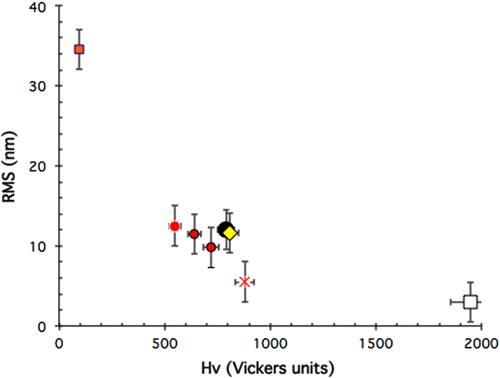
Commercial scratch testing and pin-on-disk devicesFootnote 4 were used in ambient air conditions to assess the wear resistance and friction coefficient of such coatings when exposed to a hard indenter sliding on their surface either under variable or constant load. More advanced pieces of equipment, housed in vacuum chambers (figure ), were used to assess the friction and fretting behaviour, respectively, when specimens are placed in aerospace conditions. A full account of the technical specifications of this equipment can be found in [Citation11]. Preparation of the surface for tribology measurements was performed using carborundum abrasive paper down to 4000 grit under water, followed by cleaning in an ultrasound bath of pure ethanol. No diamond paste was used in order to avoid trapping some lubricating material in voids or cracks open at the surface, if any. The final roughness of the surface was assessed through its root mean square (RMS) and was found in the range 3 ≰ RMS ≰ 35 nm, smoothly decaying with increasing hardness of the bulk material (figure ). Rugosity is therefore essentially the result of the polishing process, which removes and reconstructs the surface oxide layer since this manipulation takes place in ambient air. For experiments conducted in the secondary vacuum in the range 10−5 to 10−7 mbar, the roughness of the pin-surface interface must be different however, due to the removal of the oxide after a few passes, as we will see later, and cannot be assessed in this type of experiment. Details about the amorphous nature and growth kinetics of the surface oxide layer would take us too far in the present review but may be found elsewhere [Citation12–Citation14].
Figure 2 Pin-on-disk (left) and fretting test (right) apparatus designed to assess friction and adhesion against solids in secondary vacuum. These pieces of equipment were used in the present study in collaboration with Austrian Research Centres, Seibersdorf, Austria. See [Citation11] for a detailed description of the technical specifications of these instruments.
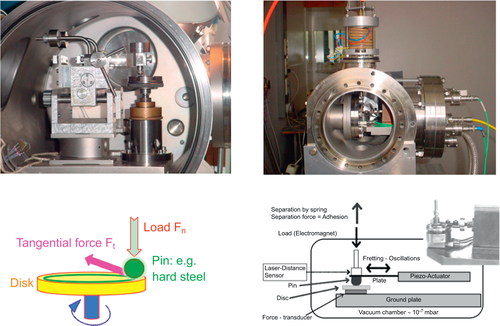
Figure 3 Root mean square roughness (RMS) assessed after polishing in ambient air and water lubrication of a sub-ensemble of disks used for friction tests in the studies reported on in sections 3.1 and 5.1 of this article. Symbols are defined as in figure below.
AFM data, which we deal with in section 4 below, was acquired in an ultra-high vacuum using a scanning atomic force microscope equipped with a 4-quadrant photodiode that allows measuring simultaneously the lateral friction force whilst the surface image is recorded [Citation15]. Passivation of the cantilever tip could be achieved by coating it with a thin organic film. Varying the contact mode this way led to deeper insight into the adhesion and friction properties of various CMAs [Citation16].
We will also refer in the following to measurements of the partial densities of states (DOSs) in order to improve our understanding of the underlying mechanism that promotes, or reduces, friction and adhesion in contact with CMAs. Those measurements were performed as explained in [Citation17], using the very same samples as the ones used on the devices of figure . They were obtained by soft x-ray emission spectroscopy (SXES), which is a technique that provides separately the energy distribution of partial occupied DOSs around each chemical species in the compound owing to the radiative recombination of a core hole from an outer atomic shell, here, and the valence band. Actually, the x-ray emission transitions are governed by dipole selection rules, so that the technique probes the p valence DOS alone and s and d valence DOSs together with transition probabilities favouring d states with respect to s ones. Moreover, the electronic states of each individual chemical species in the compound are probed separately, the data being averaged over all atomic sites allocated to the species. Hence, the electronic distributions of the various constituents of a compound are obtained separately, each one in its own x-ray transition energy scale. For a meaningful view of the electronic structure of the valence band, it is therefore necessary to adjust the distinct electronic distributions in the same energy scale. For this purpose, it is convenient to use the binding energy scale that is supplied by measuring the binding energy of the inner level involved in the x-ray transition, so that a realistic picture of the valence band is obtained, which allows discussion of the electronic interactions between the many components of the compound and also comparison for a given chemical species between several compounds.
Reduced friction in ambient air and in a vacuum
Early measurements in ambient conditions
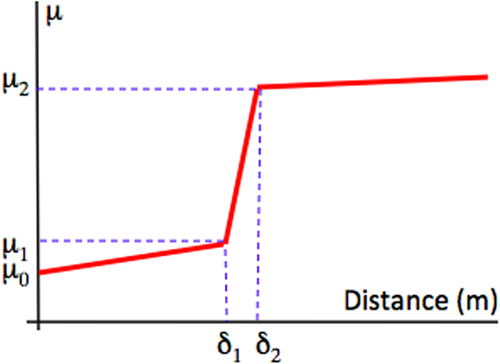
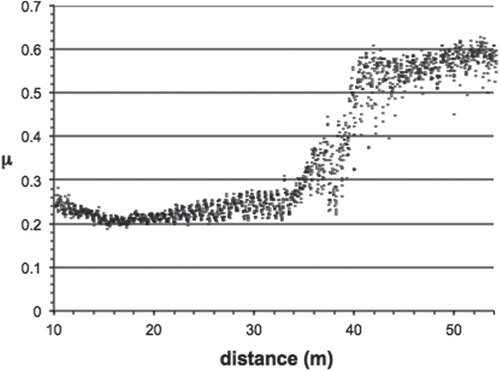
Initial data [Citation18] using a scratch test device showed that quasicrystalline and approximantFootnote 5 materials of the Al–Cu–Fe(–Cr) system are characterized by a friction coefficient μ = Ft/Fn (where Ft and Fn are, respectively, the force that opposes the movement of the indenter in the plane of the sample surface and the applied load) that lies significantly below that of the individual constituents of the alloy. A large number of sample compositions and crystal structures were assessed regarding friction in air against a diamond indenter using a more versatile device called a pin-on-disk test machine. This device is exemplified in the left-hand side column of figure . The friction coefficient μ is defined in the same way, μ = Ft/Fn as shown in the bottom part of figure . Typical pin-on-disk measurements resemble the curve shown in figure that presents the friction coefficient μ as a function of the distance run by the indenter in contact with the material. Most often, the pin is a sphere made of Cr hard steel or diamond, of a diameter equal to 6 mm or below, which is loaded by a mass of a few newtons, typically 1 or 2 N. The velocity of the disk relative to the pin is of the order of few 10−2 ms−1. Friction is sampled at a frequency of few hundred Hz, so that each full rotation of the disk is shown on the curve by tens to hundreds of data points. In ambient conditions, friction starts at relatively low values, around μ0 = 0.2–0.3, and increases slowly with time, and therefore distance, until a sudden rise of μ appears at μ = μ1. This increase is provoked by tribo-oxidation [Citation19] and the formation of a third body made of the worn out particles produced within the contact area, inside the trace, and contributing strongly to friction. Nearly steady state friction μ2 is then observed above a distance δ2. The value of μ2 ≍ 0.7–0.9 is only weakly dependent on the nature and composition of Al-based materials and experimental conditions. In contrast, the onset of high friction at a distance δ1, and the rise of friction between distances δ1 and δ2 may change drastically with the nature of the sample, its sensitivity to oxygen, and the settings of the pin-on-disk apparatus.
Figure 4 Schematic presentation of a typical friction curve recorded for an Al-based CMA sample using the pin-on-disk apparatus operated in ambient air. The instantaneous friction coefficient μ is shown versus the distance run by the indenter in contact with the disk (see left-hand side column in figure ). Since the relative velocity of the indenter contact point on the disk is fixed, the distance and time from the start of the experiment are directly proportional. The meaning of the symbols is explained in the text.
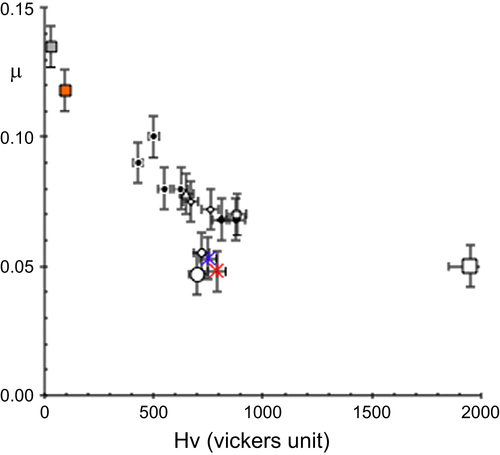
A characteristic set of initial friction coefficients μ = μ0 is assembled in figure , which shows that μ roughly decreases in inverse proportion to the (Vickers) hardness of the samples that is used in this figure to order the samples along the x-axis, from the softer one (cross on the left for fcc aluminium) to the hardest (sintered alumina, open square on the right) [Citation20]. Yet, quasicrystals and highly complex approximants are found below the data characteristic of the other materials, in the middle of the figure, and especially below measurements made with metallic alloys like hard Cr steel that exhibit comparable hardness and Young modulus.
Figure 5 Friction coefficient μ measured in air for specimens with variable hardness given on the x-axis, using an alternating sliding scratch test equipped with a spherical diamond indenter of diameter 6 mm (load Fn = 1 N). A full list of symbols is given in [Citation20]. The cross and solid square close to the y-axis are for fcc aluminum and copper, respectively. The open square on the other side of the plot is for sintered alumina. Quasicrystals and approximants are visible close to the middle of the figure. They are clearly located under the general trend manifested by the other specimens, which approximately follow a curve (not shown) inversely proportional to the hardness. Adapted from [Citation20] with permission of World Scientific, Singapore.
Pin-on-disk data measured in a secondary vacuum
The response of pin-on-disk tests changes drastically if the device is placed in a secondary vacuum, using e.g. a chamber such as the one illustrated in the left-hand side column of figure . It is then observed with an icosahedral Al–Cu–Fe quasicrystal that tribo-oxidation does not occur anymore and that the friction coefficient is stable around its initial value μ = μ0 (figure ). If in turn, air, or oxygen, is fed back to the chamber, the value of the friction goes rapidly back to its upper limit μ = μ2. The process is reversible and μ = μ0 can be recovered at will if the chamber is evacuated again. The reason for this behaviour—in a good enough vacuum—is that the native surface oxide layer that is always present in air on an Al-based sample is broken by the friction forces and evacuated from the friction trace by the rotation of the disk. If the disk rotation is fast enough, the oxide layer has no time to regrow during the time that elapses between two successive passages of the indenter at the same location, thus producing contact between the naked pin and disk surfaces after a small number of pin rotations. The typical conditions for such a mechanism to take place are 10−6 mbar vacuum and 5.10−2 m s−1 relative velocity, which are standard for such an experiment. On the contrary, if such conditions are not fulfilled, the oxide layer grows fast enough to form a third body of worn out and oxidized particles that is responsible for the rise of μ up to μ = μ2 (figure ).
Figure 6 Friction coefficient measured in a secondary vacuum with an Al59B3Cu25.5Fe12.5 icosahedral specimen as a function of the distance run in contact with a Cr-hard steel sphere under a load of 1N. The curve is drawn starting with an empty chamber (residual pressure: 10−6 mbar) until 3 mbar of air is introduced. The value of μ rises then up to a much higher value than the one that is initially observed. Pumping air out of the chamber brings the coefficient of friction back to its initial value. This behaviour is fully reversible, at least over the limited number of experiments that could be produced.
Wear is therefore intrinsically associated with friction, at least on conventional materials. An example is given in figure for the case of a 6 mm diameter ball of hard steel sliding on a disk of the same material, a disk of sintered alumina and a quasicrystal, the composition of which is indicated in the figure. Actually, it can be easily assessed by inspecting the surface of the quasicrystal disk after ending the test that the experimental conditions chosen for this experiment produce no wear on the quasicrystal. In strong contrast, the same conditions applied to hard steel riding on itself provoke severe wear, indicated by the sharp rise of μ after the beginning of the experiment. Friction stabilizes later on when a steady state is achieved. A third body of worn out steel particles then covers the friction trace as post-mortem inspection teaches us. Similarly, friction on alumina increases smoothly, yet because a transfer of steel from the indenter to the surface of alumina takes place in such a way that the test ends in a situation where friction is between the hard steel indenter and a thin layer of steel deposited at the surface of the hard alumina disk. These measurements will prove useful in section 6 when we will estimate an upper limit of the surface energy.
Figure 7 Comparative display of the friction coefficient measured against a Cr-hard steel ball of 6 mm diameter (residual pressure: 10−6 mbar, load 1 N, relative velocity: 0.05 m s−1) with hard steel, sintered alumina and a sintered quasicrystalline specimen as indicated in the figure.
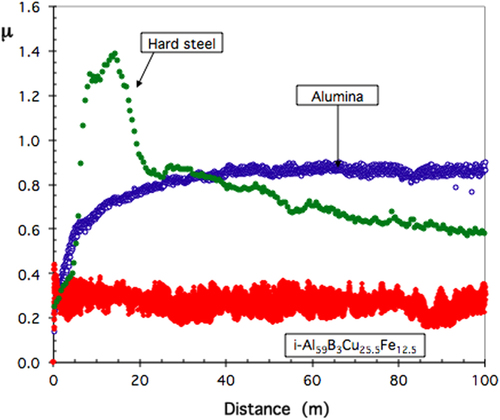
Clearly from figure , friction is found to be significantly reduced when comparing a quasicrystal to a material like hard steel of similar hardness (≍ 7–8 GPa [Citation21]) and Young modulus (≍ 100 GPa [Citation22]). We insist here that this result has never meant that quasicrystals are ultra-low friction materials like MoS2 or graphite, which self-lubricate. It simply means that better technological solutions may be achieved, compared to hard metals, by preparing quasicrystalline friction beds equipped with self-lubricating standard solutions like the ones evoked above. Composites that challenge such multi-layered alternatives are the matter of section 9 in this article.
Friction in an ultra-high vacuum and anisotropy of friction
Friction between single crystals
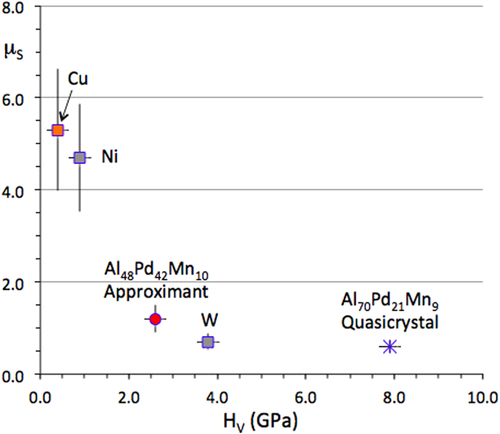
Gellman and his collaborators placed pairs of single crystals in contact under an ultra-high vacuum and measured the shear force that acts against their relative motion [Citation23, Citation24]. This procedure allowed assessment of the static friction coefficient, which is the ratio between the shear stress necessary to move the samples relative to each other at a very small velocity, of the order of few 10−5 m s−1, and a tiny applied load of few tens of 10−3 N. For the sake of comparison, they used both single icosahedral grains of composition Al70Pd21Mn9 and what they call an approximant, which in fact is a B2-CsCl cubic phase of composition Al48Pd42Mn10 (at.%). First, they observed that the surface reactivity of the two samples is essentially different when exposed to oxygen: the crystal surface saturates at much smaller exposures compared to the quasicrystalline one, yet leading to the same amorphous Al2O3 oxide. Second, static friction of the naked surfaces (before exposure to O2) is also different: for the quasicrystal, it amounts to about half that of the approximant, in proportion to their respective hardness. Extension to other materials (figure ) leads the authors to the conclusion that hardness is the ‘root cause of low friction of the quasicrystal’ and that ‘quasicrystallinity may influence friction through bulk hardness rather than aperiodicity of the surface structure’. We will show later in this section and more so in sections 4 and 8 that this is true only to first order, via the so-called ploughing component of friction, but that surface energy effects dominate friction on CMAs.
Figure 8 Static friction coefficient μS displayed versus hardness for a variety of single-grain materials as indicated in the figure. Redrawn from [Citation24].
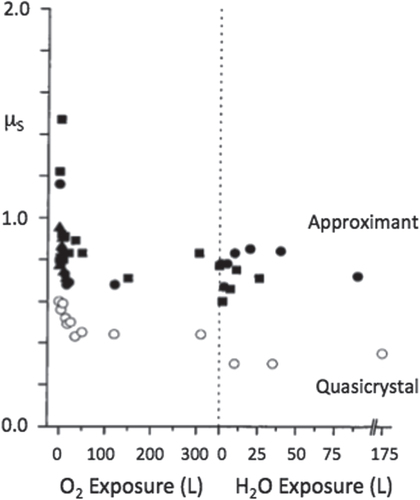
Third, passivation of the surface with oxygen or even water reduces static friction, in contrast to what was found in the previous section in the case of the formation of a surface oxide layer (figure ). The two situations are however by essence different: the oxide layer contributes friction because of the emission of third body hard particles whereas molecules adsorbed on the surface contribute to lubricating the contact area.
Figure 9 Static friction coefficient μS found for a quasicrystalline and an approximant Al–Pd–Mn sample before and after covering the surface either with oxygen or water. In both cases, covering the surface significantly decreases friction. Redrawn from [Citation24].
Anisotropy of friction
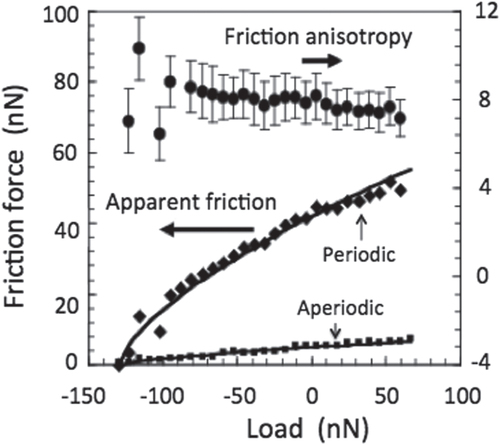
That hardness alone is not the root of low friction on quasicrystals was beautifully demonstrated in 2005 by Park et al [Citation25]. As introduced earlier in section 2, an AFM experiment in an ultra-high vacuum was used to this end [Citation15]. The sample was a single grain of a decagonalFootnote 6 quasicrystal, which was cut along a 2-fold facet in such a way that the contact plane contained both the periodic direction of the crystal and, perpendicular to it, an aperiodic direction. Exploring the apparent friction on this facet with an AFM tip revealed an anisotropy in friction by a factor close to 8 when the AFM tip moved along the periodic direction or perpendicular to it (figure ). This anisotropy disappeared when the sample was covered by its native oxide, but was reduced only by a factor of 2 when it was passivated with ethylene. Meanwhile, hardness of the same type of decagonal crystals exhibits no anisotropy, or if any, of a much more reduced amplitude [Citation21].
Figure 10 Friction force experienced by an AFM tip sliding on the 2-fold surface of an Al–Co–Ni decagonal quasicrystal along, respectively, its periodic and aperiodic directions (left y-axis). The ratio between the two sets of data is shown in the upper part of the figure (right-hand side y-axis). Courtesy of P A Thiel, Ames Laboratories. Redrawn from [Citation15].
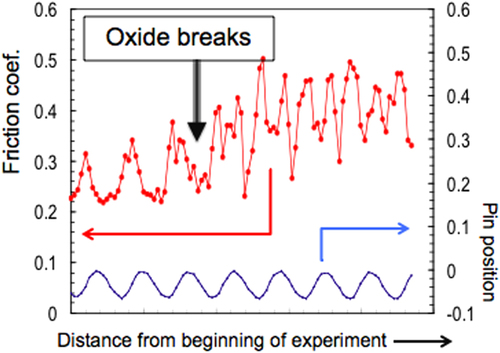
A weaker anisotropy of friction can be pointed out at a macroscopic level, using a standard pin-on-disk test in a secondary vacuum and a single grain crystal cut the same way [Citation26]. Such a specimen cannot be placed in a perfectly horizontal position on the test device, which forces it to move the position of the contact area up and down along the vertical axis, thus allowing in turn to trace the rotation of the disk just by measuring the position of the pin compared to a reference horizontal plane. Figure summarizes the results of such a test. During a small number of disk rotations at the beginning of the test, the recorded friction shows the same period as the disk: friction takes place on top of the surface oxide layer, which is amorphous and thus isotropic. When the indenter pierces this layer, see above, friction very soon shows a new periodicity, which is close to half the previous one. This behaviour lasts until an accumulation of wear transforms the quasicrystal into a bcc crystalline phase [Citation26] and later on, an amorphous or nanocrystalline material. Careful analysis [Citation27] of the balance between forces leads to the conclusion that friction is 1.5 times larger along the periodic direction compared to the aperiodic direction perpendicular to it. The same data had already been pointed out from scratch testing a decagonal crystal of nearby composition [Citation21]. It makes sense to observe that the anisotropy fully disappears when the oxide layer is formed on the surface after exposure of the sample to ambient air [Citation16]. More specifically, it was observed that oxidation reduces friction against the AFM tip, whatever the contact conditions, as long as the oxide layer remains unbroken [Citation16]. The macroscopic pin-on-disk tests that will be reported in figure and more so in section 5 hereafter will be in strong contrast to this result since the oxide layer will be removed from the contact area during the first steps of the experiment.
Figure 11 Pin-on-disk measurements obtained in a secondary vacuum for a single grain, decagonal specimen in contact with a 6 mm spherical indenter of hard steel. The lower curve is for the position of the disk along a vertical axis and shows a period identical to that of the rotation of the disk. The upper curve shows the friction coefficient that is recorded simultaneously. It has the same period as the disk position at the beginning of the test, until the surface oxide layer is broken and the two bodies, indenter and quasicrystal, come into contact. The periodicity of the signal is then divided by 2 when the indenter experiences friction in contact with the naked 2-fold surface of the quasicrystal. This signal lasts until friction and wear destroy the brittle quasicrystal surface.
The underlying mechanisms that might be responsible for the anisotropy were analysed in a recent review by Rapson [Citation28]. Phase transition taking place due to the contact pressure [Citation26] can be ruled out a priori since no significant wear is observed, on the one hand, and passivation of the AFM tip keeps the contact in the elastic regime [Citation29], on the other. As a consequence, bond formation and plastic deformation do not contribute in this regime to the energy dissipation that accompanies friction. Plausible mechanisms are henceforth electron-hole exchange through the contact area and phonon dissipation, or a mixture of both effects, which would be sensitive to the formation of gaps in the densities of electronic and/or phononic states. However, propagation of sound in decagonal quasicrystals does not show such a large anisotropy [Citation30], which in turn draws attention to the role of electronic effects. We will come back to this point in a later section. Also, incommensuration between periodic and aperiodic directions may be involved in the anisotropy as was demonstrated by Filippov et al [Citation31] using numerical simulations based on an ad hoc potential able of mimicking the relevant length scales along both types of directions. Anisotropy is assigned in this study to the large difference of corrugation installed by the potential along the periodic direction, which fits the P = 0.4 nm period found along the 10-fold axis in the decagonal crystal, on the one hand, and short S = 0.8 nm and long L = τS = 1.3 nm segments that combine to build up the aperiodic direction on the other (τ is the golden mean). Changing these parameters in the model allows the authors to modify the response of their simulation and to observe that a different anisotropy can be obtained for a different set of parameters, up to an inversion of the anisotropy for a suitable choice of S and L compared to P. This model however does not account for the fact that macroscopic measurements also reveal the anisotropy of friction on a decagonal quasicrystal.
CMAs friction in a secondary vacuum
General trends
With the view that a systematic study of a large variety of compounds may help us to understand better the origin of friction on Al-based CMAs, we have performed a series of pin-on-disk tests in a secondary vacuum on various compounds, changing the composition, therefore the crystal structure, their hardness and electronic density of states. These compounds, binary or ternary, were already listed elsewhere together with their relevant crystal structures [Citation32]. Complementary measurements were produced on elemental Al, Cu and on reference samples like alumina or window glass for the sake of comparison. The experimental conditions were all the same for all samples, namely residual pressure in the pin-on-disk chamber: 10−6 mbar, relative velocity of the disk vs indenter: 5 10−2 m s−1, indenter: 6 mm diameter Cr-hard steel sphere, load: 1 N, radius of trace: 5 10−3 m. A summary of the most interesting results is given in figure . After the end of each test, both the CMA disk and indenter were visualized with the help of an optical microscope to verify that the wear was indeed insignificant.
Figure 12 Ensemble of friction coefficients measured in a secondary vacuum against hard Cr-steel with a variety of specimens presented according to their Vickers hardness HV (see [Citation20] for details). The dashed curve in the left-hand side of the figure is a guide for the eye and varies in inverse proportion of HV. The right-hand side of the figure presents a magnification of the region with 400 < HV < 1000. Adapted from [Citation20] with permission of World Scientific, Singapore.
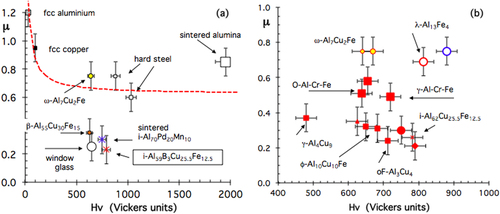
The left-hand side part of figure assembles friction coefficient data for a large variety of samples, covering a broad range of hardness values, from HV = 40 for fcc Al to HV = 2000 Vickers units (load 0.5 N). The friction coefficient in a secondary vacuum indeed decreases with increasing hardness, roughly in inverse proportion to HV, as already mentioned in section 2. This trend is emphasized by the solid line, which guides the eye. Blowing up the region around HV = 600–700 Vickers units shows, however, a far more complex behaviour. This region is shown in the right-hand side of the figure. There, it is clear that compounds with identical hardness, and very similar compositions, like the Al59B3Cu25.5Fe12.5 quasicrystal, the Al55Cu30Fe15 β-phase, the Al70Cu20Fe10 ω-phase, and hard steel samples show quite different friction in a secondary vacuum against hard Cr-steel. Similarly, the right-hand side of figure presents data for Al–Cu compounds, with no or little addition of transition metals (with the noticeable exception of the Al–Cu–Fe quasicrystal which follows the same trend, see the solid diamond symbol), on the one hand, and compounds that contain transition metals (TM = Cr and Fe), on the other. The former compounds assemble in the bottom part of the figure and show friction coefficients that slowly decrease with increasing hardness. In contrast, the TM containing specimens fall above that region and supply data that are more erratically distributed, but roughly increase with increasing hardness. Such a piece of evidence rules out hardness as the sole root of friction on CMAs.
Focus on binary samples
Many binary compounds form with aluminium [Citation33]. In order to clarify the origin of friction against hard steel on Al-based compounds, we have systematically investigated μ and HV for a significantly large number of sintered compounds. Many of them fall around the equiatomic composition Al50TM50 where TM represents a transition metal selected among Cu, Ni, Co, Fe, Mn, Ti in the 3d metals row or Zr in the 4d line. Their lattice structure is most often, but not always, cubic and close to the B2-CsCl type (noted β-phase) although ordering of vacancies may complicate the structure [Citation34]. Other compounds of generic formula Al75TM25 were also investigated, like the Al3Ni orthorhombic compound isotypic with Fe3C cementite, as well as Al13Fe4 and Al13Co4, Al11Mn4, etc. Cubic phases will be represented in figures hereafter by squares whereas the other types of compounds will appear represented by a dot, with the exception of the icosahedral compounds that will be shown as a star symbol.
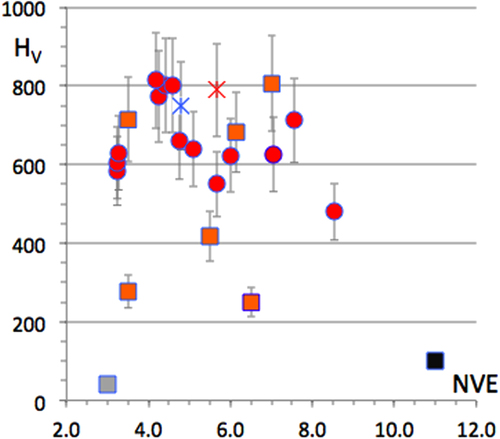
A full series of friction data is reported in figure as a function of sample Vickers hardness. The general trend that friction (in a vacuum) decays in inverse proportion to the hardness is still observed, although significant shifts are clearly visible. Among all compounds, the icosahedral material manifests itself at the lowest friction coefficient, but the difference compared to two Al–Cu binaries (dot for Al3Cu2 and square for h-AlCu close to the star in figure ) falls within the error range of the measurement. This similarity was already exploited to design bonding layers specific to quasicrystalline coatings [Citation35]. Another interesting piece of evidence is the regular decay observed on μ when it is plotted as a function of the number of valence electrons in the compound, which may be directly inferred from composition (figure ). Again, although a scatter of the data points is observed, friction is the lowest for compounds lying in the right-hand side of the row, i.e. for a filled d-band, in contrast to alloys that will show a tendency to hybridize to steel in order to complete their d-band. Observe, however, the cross-correlation between HV and the filling of the valence band (figure ), which follows the well-known behaviour of the cohesive energy for 3d metals (see the next section), with two maxima around valence electron numbers NVE equal to 4.5 and 7, respectively. It makes sense, therefore, to wonder if the root of friction is to be found in the electronic DOS as well as in the hardness, itself being determined not only by the preparation process, although it matters, but also, in an essential way, by the cohesive energy of the material, hence its DOS.
Figure 13 Experimental correlation observed between friction coefficient μ (against hard steel, in a secondary vacuum, see text) and Vickers hardness (load 50 N) for fcc aluminum (grey square), copper (black square), B2-CsCl binary Al-TM compounds (including h-AlCu) and β-Al–Cu–Fe, which are all represented by filled squares, and other binary and ternary compounds, represented by filled dots. Icosahedral samples from Al–Cu–Fe and Al–Pd–Mn systems are represented by red and blue stars, respectively.
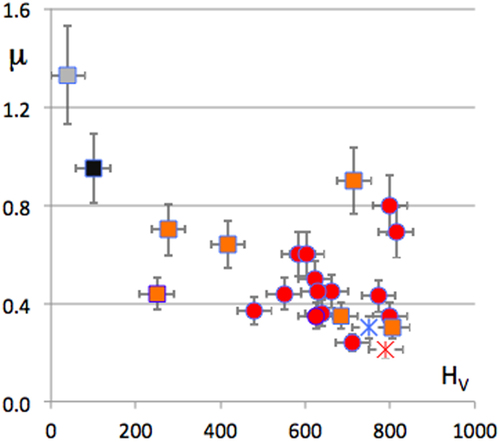
Figure 14 Experimental correlation observed between the friction coefficient already shown in figure and the number of valence electrons in the compound. Symbols are defined as in figure . Copper is omitted.
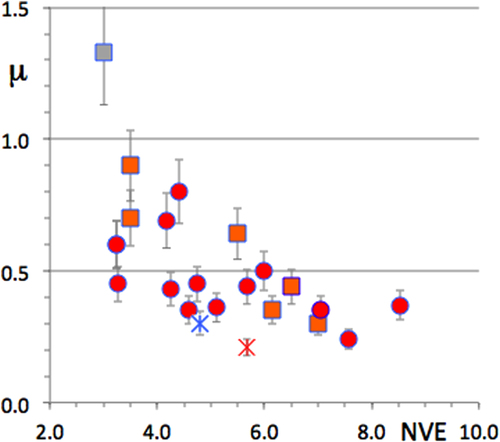
Figure 15 Experimental correlation between hardness measured using a Vickers indenter for the samples shown in figure and NVE as defined as in figure . Two maxima and a marked minimum of HV are clearly visible in spite of the data scatter.
Surface energy
Experiments with elemental metals and reference samples
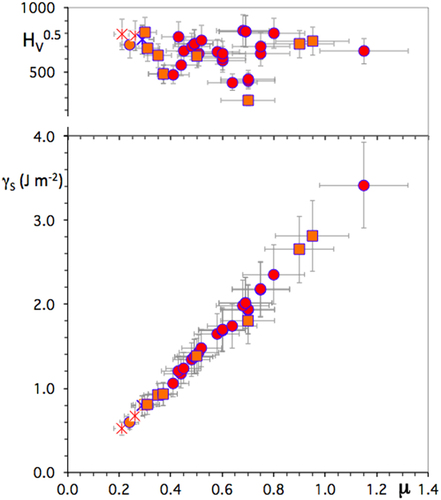
At this stage, an interesting clue is to perform the same pin-on-disk experiments with elemental metals for which hardness is easily measured and surface energy is known from computations [Citation36]. Figure (a) summarizes the surface energyFootnote 7 γS of those metals, which is taken as half the cohesive energy EC, thus neglecting out of equilibrium effects. EC is well known for 3d metals (solid squares), 4d metals (open triangles, only part of the series is drawn) and one 5d metal and aluminium (grey square). When presented as a function of the number of valence electrons (s, p + d), the plot of γS for the 3d series goes through two marked maxima at 5 and 9 s,p + d electrons per atom and a sharp minimum in between, which are characteristic of this plot. Conversely, the 4d series shows only a maximum in the middle of the band, of which only the lowest populated part is presented in the figure. The average surface energy of aluminium lies under the previous values of EC/2 and is taken as γS = 1.15 J m−2. Experimental values of the friction coefficient on samples of the same metals may be plotted in a one-to-one correspondence with the same curves, figure (b).
Figure 16 (a) Plot of the surface energy, taken as half the cohesive energy, as a function of the number of valence electrons (NVE = number of s, p and d electrons) in pure metals: aluminum (grey square), 3d metals (solid squares), 4d (triangles) and 5d (lozenge). (b) Experimental friction coefficient corrected as explained in the text to match the theoretical data in a). Symbols are kept the same. The larger symbols are for Mo and Co, which do not allow one to deduce the surface energy (see text).
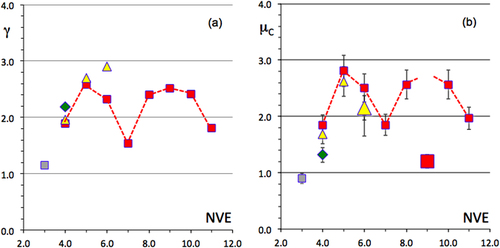
To this end, we assume a correction for the ploughing component of friction that is explained in the coming sub-section 6.2 and is given by a constant divided by the hardness of the sample (times a constant scaling factor). This correction cannot hold true for very soft metals like Pb or Sn, but proves to be operational already for Al. When doing so, the experimental friction coefficient after correction, or μC, exhibits the same characteristic two maxima and minimum expected from theoretical data for the 3d series (figure (b)). Two data points however, marked by larger symbols (triangle for Mo and square for Co) emphasize the limits of the approach. Both fall below the other data points because adsorption of oxygen on the surface in the experimental conditions provided by this experiment cannot prevent lubrication of the trace and therefore hinder friction of the naked surfaces against each other. Yet, for all other data points, matching between theoretical values of γS and the experimental ones is pretty good. We will use this opportunity to estimate the surface energy of our CMA samples after appropriate calibration of the experiment.
Model and calibration of the pin-on-disk experiment
Various models may be found in the literature, which account for the hardness and adhesion effects, depending on the parameters of the contact geometry. An updated review is available in an article by Gao et al [Citation37]. Interestingly, Park et al pointed out that an AFM W2C tip experiences a very significant shear stress when displaced in contact with the 2-fold facet of an Al–Ni–Co decagonal single grain [Citation38]. Its friction-load pattern is then best accounted for using the Johnson–Kendall–Roberts model (JKR) [Citation39], although the contacting bodies are both hard materials. The importance of the shear stress and accordance with the JKR model emphasizes the key role played in friction by adhesion properties.
To explore the relative weights of plastic deformation, what we call the ploughing component of friction, and of adhesion, we will rely in this article on a simple picture that assigns friction to a balance between the reciprocal hardness, to account for ploughing, and the work of adhesion. In other words, we separate—in a sense, artificially—the contributions of the electronic structure at work in the volume of the sample, which determine the hardness, from those experienced at the surface, which we call adhesion. The model reads(1)
where α and β are fit parameters and WSP is the adhesion work between the pin P and the surface of interest S. Since wear is irrelevant, we assume that WSP is the reversible adhesion energy between the pin and the surface, i.e.
(2)
with γP the surface energy of the pin and γSP the interfacial energy developed at thermodynamic equilibrium between S and P. The values of γP and even more so, of γSP are essentially unknown. In a very drastic assumption, we admit, we take γP − γSP = 0, which leaves us with a new version of equation (Equation1
(1) ),
(3)
from which it is easy to deduce an upper limit for γS if α and β are determined. Therefore, friction may be corrected for its ploughing component
(4) 4
that will be used in the following sections (the scaling factor applied in figure (b) is simply equal to 1/β, later in this section we will just omit it).
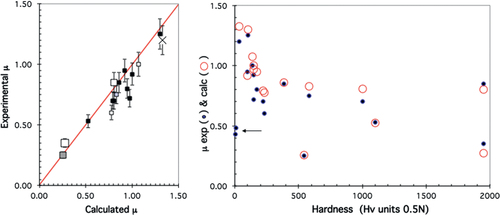
The values of the device parameters α and β can be obtained from experiments like the ones shown in figure (b), after measuring, on the one hand, the Vickers hardness of the reference samples (pure metals, window glass, sintered alumina), the surface energy of which is known either from experiments or from computations [Citation36], and on the other hand, friction against hard steel, always in the very same conditions that we have already introduced in this article. The data presented in figure for sintered alumina is especially relevant in this respect since it starts with the friction coefficient of ‘naked’ alumina, but ends with that of alumina covered with steel. Its surface energy evolves therefore from that of alumina to that of steel, whereas its hardness does not change. The resulting two data points are introduced at the highest hardness on the x-axis in figure , which yields a comparison between the experimental friction coefficient (solid dots in the right-hand side part of the figure) and the one calculated according to equation (Equation3(3) ) above (open circles), once α and β are determined for the very specific apparatus used in our study: α = 33.5 HV units; β = 0.322 m2 J−1. Agreement between experimental and calculated data is rather good (linear regression coefficient r = 0.9557, left-hand side part of figure ), except for soft metals like Pb and Sn (arrow in the right-hand side of figure ) as expected from the divergence of equation (Equation3
(3) ) when HV * 0.
Figure 17 Calibration data used for the pin-on-disk device housed in a vacuum chamber and used to determine the upper limit of the surface energy (see text).
We insist again: our procedure to analyse friction data has meaning only for the device we have used and imposes especially that all experimental conditions are kept unchanged when examining new samples of unknown surface energy. Yet, by doing so, insight is gained into this very important property that otherwise cannot be computed, due to the large size of the unit cell of many of our samples and the present limited computer capabilities, nor experimentally assessed owing to the large number of samples, which makes the present analysis valuable.
Surface energy of CMAs
For the sake of brevity, we call the surface energy hereafter, or γS, the upper value of the surface energy determined as explained in the previous sub-section. Experimental values obtained for the series of CMA compounds already addressed in previous sections are represented in figure . Quasicrystals supply the smallest values of γS (the data point for icosahedral AlPdMn is hardly visible because it is hidden by a square symbol that stands for a β-Al–Cu–Fe phase). Again, like friction, typical values of γS for cubic phases of the Al-Cu and Al–Cu–Fe systems come close to those for the quasicrystals, but may be much higher if the transition metal constituents are different, e.g. Al–Zr or Al–Ti. More complex compounds, like the ω-Al7Cu2Fe, λ-Al13(Fe or Co)4, etc, crystals exhibit significantly larger surface energy. The upper part of figure presents the Vickers hardness measured for the same specimens. Clearly, it cannot be the root of friction since, as is observed on the experimental data, it remains within a narrow range (with few exceptions however) whereas μ evolves significantly. Meanwhile, as shown by the data relevant to β-phases (square symbols in figure ), composition has far more influence: friction is larger if the transition metal constituent is selected among the beginning or centre of the d-series and is reduced for samples containing Cu (figure ), as we have already seen in a previous section.
Figure 18 Bottom: Surface energy deduced from experimental friction coefficient, see text, for icosahedral compounds (stars), β-cubic phases (squares) and other types of binary and ternary compounds (dots) of the Al–TM systems. Top: Vickers hardness measured under 0.5 N load for the same specimens, also arranged in the figure along the experimental friction coefficient μ.
Friction corrected for the ploughing effect
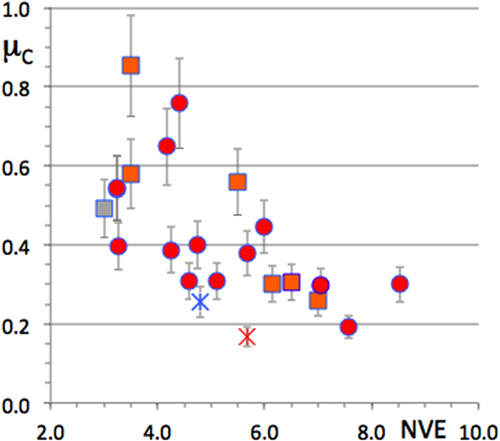
Since hardness is not the only effect that reduces friction, but that adhesion is equally important through the effect of the surface energy, we will concentrate in the following on friction corrected from its ploughing component as indicated by equation (Equation4(4) 4 ). The corrected friction coefficient, which is noted μC hereafter, is presented as a function of the filling of the valence band in figure . Correction is not very significant for most data, except for aluminium, which is a soft metal. We will discuss in section 8 the dependence of μC on the electronic structure of the material and its complexity. However, first let us study solid-solid adhesion in a secondary vacuum.
Figure 19 Friction coefficient corrected for the ploughing component (as explained in the text) plotted against the number of valence electrons in each CMA sample. The grey square symbol stands for fcc aluminum, the other square symbols for Al50TM50 B2-type phases, dots for CMAs of different composition. Icosahedral specimens are represented by stars (i-AlPdMn is shown left to i-Al–Cu–Fe).
Solid–solid adhesion and fretting
The experimental set-up used to assess adhesion between solids in a secondary vacuum is depicted in the right-hand side column of figure . It consists of a fretting device actuated by a piezoelectric transducer and a sensor that measures the force needed to open the contact after a few hundreds of alternating movements (of amplitude in the range 10–30 10−6 m) have been imposed on the spherical indenter placed in contact with the solid of interest under an external load that reaches typically 2/3 of the elastic limit of the material. This experiment is repeated until the surfaces are worn out, which also provides a measure of the adhesion forces at work. For low adhesion situations, thousands of cycles may be necessary to cause destruction of the contact area, whereas high adhesion is observed over very brief experiments.
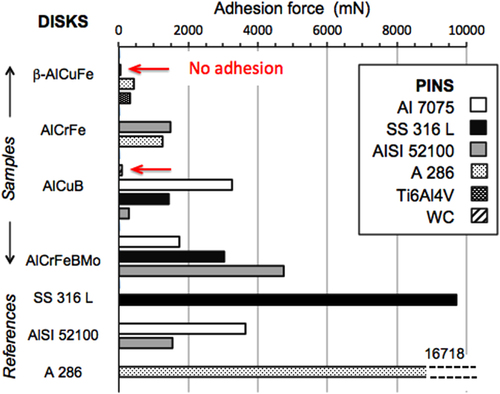
Figure reports a few examples [Citation40] of adhesion force measurements against various indenters as listed in the insets for single grain materials in the left-hand side column (a) and sintered multigrained materials in the right-hand side (b). A comparison with the reference materials is also shown. Adhesion of icosahedral AlPdMn against both steel (in black in the figure) and aluminum-based alloys (white and grey) is virtually absent, and even more so, for the ξ′-AlPdMn approximant, which is a CMA containing a few hundred atoms per unit cell [Citation41]. In strong contrast, conventional materials like the SS316L steel and the AISI 52 100 aluminium alloy produce far larger adhesion forces when placed in contact with themselves (the average adhesion force measured for the final fretting tests is indicated in mN in the figure). Similarly, in figure (b), sintered icosahedral samples present reduced adhesion against a large variety of counterparts, except against the AI7075 alloy that sticks more to the disks, which also contain Al as a majority constituent, but with an adhesion force that is significantly lower than the one observed against the reference samples (figure (a)). Comparing now reference samples and crystalline CMAs that contain various concentrations of mid-row transition metals, like Cr, Fe or Mo demonstrates again that the stick force is dramatically enhanced on such materials (figure ). This tendency is especially well illustrated with two samples of the γ-brass phase that forms in the AlCrFe system [Citation42] and in which addition of Mo to replace Cr may be achieved.
Figure 20 (a, left) Stick force extracted from fretting tests in a vacuum on single grain materials as shown along the y-axis against the antagonists coded in the inset. Reference tests performed on the indenter materials in contact with a counterpart of identical materials are reported for the sake of comparison. Arrows point to samples that show no adhesion. (b, right) Same as in (a), but for sintered icosahedral samples of the Al-based systems indicated along the y-axis.
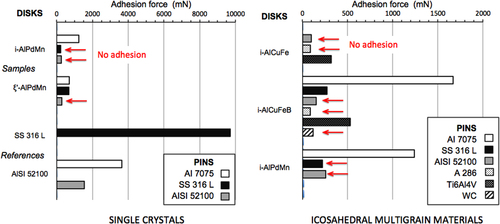
Figure 21 Stick force extracted from the same type of measurement as reported in figure for various crystalline CMAs, with different transition metal contents, compared to reference measurements. AlCrFe denotes a γ-brass phase that forms in this system and AlCrFeMoB, a similar crystal compound with Cr partly replaced by Mo. AlCuB is for a B2-CsCl phase with 3 at. % of boron. The stick force against A 236 reference material against itself is shown on top of the histogram bar.
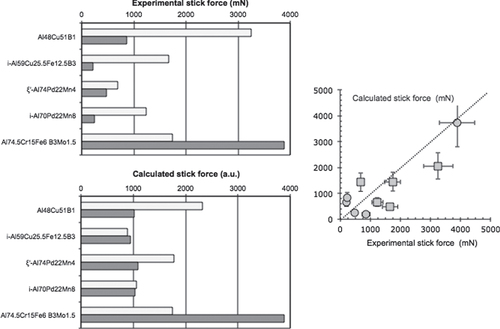
We may understand in a first approach the most salient features extracted from these measurements of the stick force as it is summarized in figure . To this end, we anticipate on the DOS measurements reported on in the coming section, on the one hand, and we rely on a fairly crude model of adhesion: we assume that the stick force is proportional to the charge transfer from disk to pin in a rigid band model. The difference in nature of the indenter—Al-based or Fe-based—therefore changes the transfer. In the former case, all electrons at the Fermi energy participate to the transfer, whereas in the second case, only those electrons that may complete the d-band of Fe have to be taken into account. More specifically, d electrons of Cu and Pd do not bind to Fe, as is already well known from Cu–Fe and Fe–Pd phase diagrams, while d-states of Al participate in the transfer. The main features of the stick force for various CMA substrates and two distinct indenters are then roughly reproduced (figure ). We will address more accurately the role of the DOS in the coming section.
Figure 22 Left-hand side column, top part (a): experimental stick force obtained as described in the text for a series of substrates in contact with an Al-based indenter (light grey bars) and an Fe-based indenter (dark grey). The bottom part of the column (b) is for the adhesion force estimated as the result of a charge transfer in a rigid band model, assuming that the transfer occurs between all types of states present at the Fermi energy in the disk sample and spd-states of Al in the case represented by the histogram in light grey, and only between d-states of iron and d-states of the compound, which is shown in dark grey. DOS at the Fermi energy is taken from the study described in section 8 is shown a comparison between the two sets of data is shown in the right-hand side column.
Discussion in the light of DOS measurements
Partial densities of states in the ω-Al7Cu2Fe CMA
To begin, we illustrate the response of SXES measurements regarding the determination of partial densities of states. To this end, we refer to the computed DOS obtained for the ω compound of composition Al70Cu20Fe10 and tetragonal structure (P4/mnc; a = 0.6336 nm; c = 1.4870 nm) [Citation43]. Ab initio computation of the DOS was based on the linear muffin-tin orbital (LMTO) method in the augmented plane wave approximation, see [Citation43] for details. Figure presents an overview on the computed partial DOSs together with the total DOS while the inset is for the same partial DOSs after broadening by a Lorentzian line shape that accounts for the finite lifetime of the core hole and finite resolution of SXES spectroscopy. These are typical results that can be compared to experimental data supplied by the technique. Comparison to the total DOS is excluded since transition matrix elements are unknown. Furthermore, all DOSs are normalized to their respective maximum intensity, a situation that makes a clear difference with respect to the raw computed curves with no normalization. The vertical line at zero binding energy marks the Fermi energy, which is accurately derived from separate x-ray photoelectron spectroscopy (XPS) experiments [Citation17].
Figure 23 Calculated DOS for the ω-Al7Cu2Fe compound (partial and total DOSs are shown as indexed in the figure) [Citation43]. The inset presents the same data, but after broadening to account for the SXES limitations, and normalization to their respective maximum intensity. Due to the lack of knowledge of the transition matrix elements involved in the SXES process, the total DOS cannot be computed (inset).
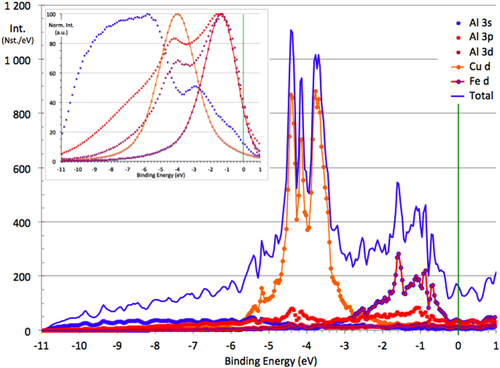
We shall assume in the following that only the fraction kBT (kB Boltzmann constant, T temperature) of states that sit at the Fermi energy EF is involved in the adhesion process. Furthermore, since the counterpart is hard steel, i.e. essentially a 3d metal with uncompleted d-band, adhesion is the result of transfer of d-electrons from the sample disk to the pin. The partial DOSs of interest will therefore be the Al d and Fe 3d ones because the density of Cu3d states at EF is negligible since the peak of Cu 3d states is located far below EF on the one hand (figure ), and the Al s contribution to the Al s, d DOS (s and d states of Al cannot be separated by SXES) is small compared to that of the d contribution, as computations teach us on the other hand. Typical numbers taken from the inset in figure are n(EF) = 35% for the Fe3d DOS and n(EF) = 40% for the Al s, d one, both given in arbitrary units, which a priori cannot be intermixed due to the intrinsic limitation of SXES. Following the evolution of those numbers when the nature of the phase is changed among Al-based CMAs makes sense, however, since one may assume that the transition matrix elements, although unknown for each specific partial DOS, change smoothly with the composition. This is what we will do now for the B2-CsCl type of phases.
The case of the B2-CsCl phases
B2 phases, also noted β-Al1 − xTMx, with x in the vicinity of 50 at.% and TM = Ti, Fe, Ni, Co, Cu and Zr, are pretty abundant in Al-based CMAs. They exhibit frequently super-structuring due to vacancy ordering [Citation34] or distortion from the cubic lattice like in the h-AlCu phase [Citation33]. Ternary B2 cubic phases such as β-Al55Cu30Fe15 play a very significant role in the present context since they may be considered as approximants of the quasicrystal [Citation34] to which they are related as being its average lattice [Citation44].
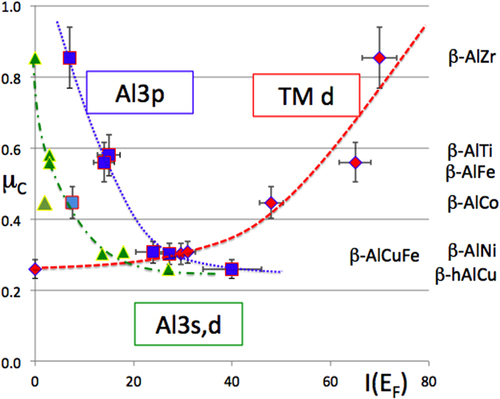
We have undertaken a systematic survey of the friction coefficient in a secondary vacuum against hard steel for several β-phases. The corrected friction coefficient μC is shown in figure as a function of the intensity at Fermi energy of the three partial DOSs of interest: Al3s,d, Al3p and TM3d. It clearly increases with the enhanced density of TM3d states at the Fermi energy, but shows the opposite behaviour if the partial DOSs of Al are considered. This finding leads us to conclude, in a first approximation, that adhesion is the result of the formation of a (rigid) band between the disk and the (steel) pin. This conclusion is consistent with our previous one deduced from fretting tests. Unfortunately, we could not produce experiments with different pin materials, as we did in section 7 for fretting tests, and therefore, we cannot test our conclusion further.
Friction, chemical composition and lattice complexity
An immediate consequence of the previous section is that the chemical composition matters more to reduce friction than the lattice structure, or complexity. Yet, investigating the possible role of complexity is worth a bit more attention. Complexity may be reduced to one single number, however paradoxical this process may appear [Citation4]. To this end, we use a complexity index defined as the (natural) logarithm of Nuc, the number of atoms in the unit cell, which, by the way, is very similar to the Shannon entropy of the information needed to build the lattice:(5)
Figure 24 Friction coefficient corrected from the ploughing component and plotted as a function of the respective densities of Al3s,d, Al3p and TM3d present at the Fermi energy in each of the β-AlTM compounds listed in the right-hand part of the figure. The Ti3d data point is absent because the Ti3d DOS cannot be measured by SXES due to the too poor signal-to-noise ratio. Diamonds are for the TM 3d DOS, triangles for the Al3s,d and squares for the Al 3p DOS.
Although a quasiperiodic lattice is considered infinite, such a definition is applicable to a quasicrystal because any sample has a finite size, say for instance one Avogadro number of atoms (βC ≍ 54) in the case of a single grain material, or the size of one grain in a multi-grained specimen (βC ≍ 45). Similarly, the average complexity of a decagonal quasicrystal is related in a simple way to that of the icosahedral quasicrystal [Citation4].
A plot of the corrected friction coefficient is shown in figure as a function of βC. Once more, the data for the icosahedral quasicrystal falls slightly below all other values, but, owing to the experimental error, it is not actually smaller than that of the Al–Cu γ-brass phase. On average, and to a first order approximation only, there is a tendency for the data points to obey a decrease of μC with increasing complexity. This trend is made more easily visible in the inset of figure , which shows a blow-up of the low complexity index region and uses a double logarithmic plot, as was already done in figure for electron transport. The solid line is drawn with a slope −1/4.
Figure 25 Friction coefficient corrected for the contribution of ploughing as a function of the complexity index defined in the text. The inset shows a double logarithm plot of the same property. The line is drawn with a slope of −1/4 to guide the eyes. Symbols are defined as in previous figures, except for Al13TM4 (TM = Co and Fe) compounds that are shown by open dots.
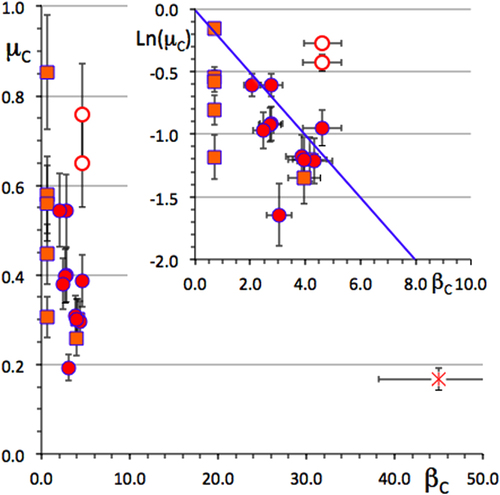
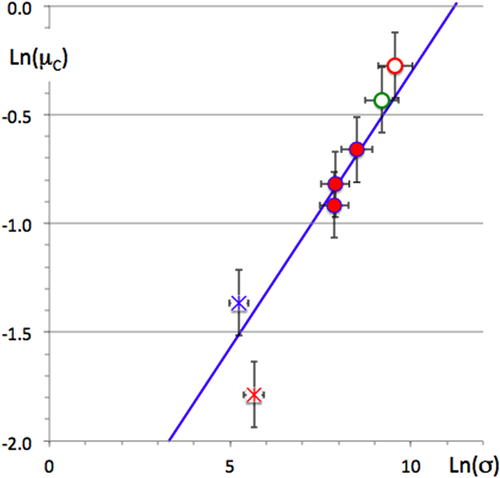
Many data points fall around this line, but not all, by far. For instance, the two Al13TM4 compounds (TM = Fe, Co), with a bit more than 100 atoms per unit cell (open dots in figure ) are found significantly above the line, whereas γ-Al4Cu9 lies below, like the quasicrystal (the star in figure ). Electron transport in Al-based CMAs is found to be inversely proportional to βC (figure ), a key result that is consistent with electron critical localization and hopping conduction, at least in sufficiently complex compounds (βC > 5). As a consequence, the electronic conductivity is expected to vary in inverse proportion to the square of the DOS at EF: σ ∝ n(EF)−2, at least in a range of crystal unit cell sizes above a certain threshold, called the Julia thresholdFootnote 8 βC = βJ = 5, i.e. typically above 100 atoms per primitive unit cell. This result was first sorted out by Mizutani [Citation46], and experimentally confirmed by our study of the conductivity of a large number of CMAs, including a few of those used in this study (see figure in [Citation4]). Accordingly, we expect to observe in this range of complexity (βC > βJ) a link between friction and electron transport, thus given by: μC ∝ σ 1/4. Experimental verification of this prediction can only be partial because the transport properties of most of the very specimens used for friction measurements are missing. Nevertheless, such a correlation is obvious (figure ) for the few samples for which such data are available.
Figure 26 Correlation observed between corrected friction coefficient and electronic conductivity at 300 K for a few samples with βC > βJ = 5 for which both friction and conductivity data are available. Symbols represent the same CMAs as in previous figures. The line guides the eye with a slope + 1/4.
This correlation sheds new light on the anisotropy of friction discussed in section 4.2 because electron transport is anisotropic as well and shows an anisotropy factor of about 8 [Citation47]. The two measurements—friction and electron conduction—are made on macroscopic samples and are therefore consistent: 1.5 ≍ 81/4. The most plausible mechanism to explain the anisotropy of friction is thus related to the anisotropy of the surface energy, which for a solid crystal is a tensorial property that determines its equilibrium shape [Citation48]. Decagonal single grains grow at near equilibrium in the shrinkage cavities of ingots with a pronounced needle shape, which tells us that the symmetry of the surface energy tensor is (nearly) cylindrical and elongated in the direction of the periodic axis. At macroscopic scale, pin-on-disk tests the average friction over a contact area that is large enough to integrate the effects of both the elongated principal axis of the (elliptic) tensor, and the other perpendicular axis, but weighted differently when the pin runs along the periodic direction or perpendicular to it. This effect smooths out the anisotropy of the tensor, which in contrast is fully probed in the AFM experiment.
At smaller unit cell sizes (βC < βJ), the transport mechanism evolves from hopping conductivity in high complexity CMAs to ballistic in metallic aluminium. Its scaling with the DOS at EF changes with lattice complexity, although it stays close to σ ∝ n(EF)−6 [Citation4]. In this range, correlation between transport and friction data is far less obvious because of the broad scatter of the data.
Assessment of the practical usefulness of CMAs for tribological devices
Hardness, toughness and friction
The hardness of complex intermetallics is generally high and contributes to minimize ploughing on such compounds. Unfortunately, toughness of the same materials varies in inverse proportion and is found to be low to very low for all CMAs used in this study. Typical numbers are significantly below 1 MPa m1/2, which represents a rather poor resistance to crack propagationFootnote 9 It is as low as 0.1 MPa m1/2 for single grain icosahedral quasicrystals, which excludes any practical usage in a mechanical device. As a consequence, friction can be assessed only using very peculiar conditions like in an AFM or with a reduced load in a secondary vacuum such that no wear is produced. Realistic applications require one to either improve the toughness of the material, which we will examine in the coming two sub-sections, or rely upon the preparation of surface coatings [Citation3, Citation10, Citation49, Citation50]. Thin enough coatings of hard and brittle materials are well-known technological solutions, but they face a supplementary drawback in the case of quasicrystals that comes from their low surface energy and therefore their intrinsically poor adherence to the substrate [Citation51]. Adaptation bond coats are then necessary [Citation35]. To the best of our knowledge, no successful utilisation of a CMA coating has been achieved so far in contact mechanics. Therefore, we prefer to concentrate in the following sub-sections on an attempt to increase the toughness of those materials and on a commercially available solution with good tribological properties. This latter application is the focus of a full article in this special collection of articles in Science and Technology of Advanced Materials [Citation52].
Self-lubricating metal-matrix composites
Self-lubrication may be induced in a sintered quasicrystalline material by adding a small amount of a low-melting point, soft metal that furthermore does not dissolve in the lattice. This solution, first suggested by Singh and Tsai [Citation53], was widely studied by different authors [Citation54, Citation55]. It can also teach us something about the surface energy of the quasicrystal, as we show now.
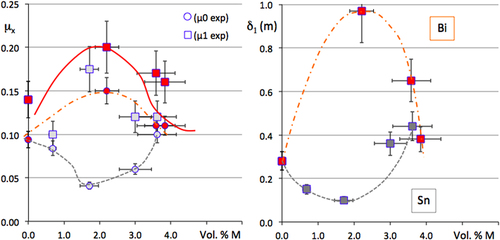
Multigrained pellets of Al59Cu25Fe13B3 quasicrystal powder were sintered under uniaxial pressure using either a conventional sintering machine [Citation8] or a spark plasma sintering device. The powder was first prepared from an atomised batch, sieved in the range 45–70 μm, and mixed by mechanical alloying under an argon atmosphere with either tin or bismuth. The temperature profile applied during sintering was selected in such a way as to transform any metastable phase inherited from the atomisation process into the stable phase, which is the icosahedral quasicrystal itself, as could easily be assessed by powder x-ray diffraction applied to the final pellet. The fraction of metal addition was varied between 0 and 15 Vol. %. Hardness was assessed using a Vickers indenter under a load of 0.5 N, which in turn allowed us estimate the toughness constant from the length of the Palmqvist cracks [Citation56]. Data are presented in figure for the two metals M = Sn or Bi used in this study [Citation55]. Clearly enough, the addition of one or the other metal is beneficial: hardness decreases whereas toughness is significantly improved up to the range characteristic of the technical ceramics used in mechanical devices. Figure reports the dependence on the volume of metal M added to the pellet for the initial friction coefficients μ0 and μ1 and delay δ1 before wear sets in (these symbols are defined in figure ). Surprisingly, the two metals have essentially different influences: the initial friction coefficient μ0 increases with Bi addition, but decreases with that of Sn, which is reflecting the different lubricating properties of the Bi and Sn oxides, respectively (left-hand side of figure ). Simultaneously, increasing the fraction of Bi enhances first the δ1 delay and then decreases it, whereas Sn does the opposite (right-hand side of figure ) while μ1 exhibits the same trend for both metals (left-hand side of figure ). Metallographic observation of the polished pellets indicates that the metals, which do not dissolve in the quasicrystal, decorate the powder grain boundaries, forming a continuous medium above a certain fraction threshold. This threshold may be deduced from microscopy observations and is estimated to lie in the vicinity of 3 Vol. %. Assuming then that the surface energy of Bi and Sn is preserved in this experiment [Citation36], despite the metallurgical processing applied to the samples, allows us to interpret the data. Bi has a surface energy γS = 0.5 J m2, slightly below or very similar to that of the quasicrystal powder, whereas Sn has γS = 0.7 J m2, above that of the Al–Cu–Fe quasicrystal (figure ). Wetting of the quasicrystal by metal M will therefore be different: Bi wets more than Sn and forms a continuous coating on the grains in an easier way. The mechanical strength of the composite will accordingly change around the percolation threshold, depending on the surface energy of the associated metal: disrupting the coating/grain boundary is easier with Sn than with Bi until continuous wetting by the soft metal, i.e. above the percolation threshold, renders the composite softer. Alternatively, the conclusion from this experiment is consistent with our findings about the surface energy of the Al–Cu–Fe quasicrystal (section 6.3), which it confirms in an indirect way. Such a confirmation is actually a practical application of the composite, although not yet of technological relevance.
Figure 27 Evolution of the Vickers hardness HV and toughness constant KIC with the volume fraction of metal M = Bi or Sn added by mechanical alloying before sintering the quasicrystalline powder. Bi samples are represented by symbols in red and Sn by symbols in grey. Squares are for KIC and dots for HV. Redrawn from [Citation55].
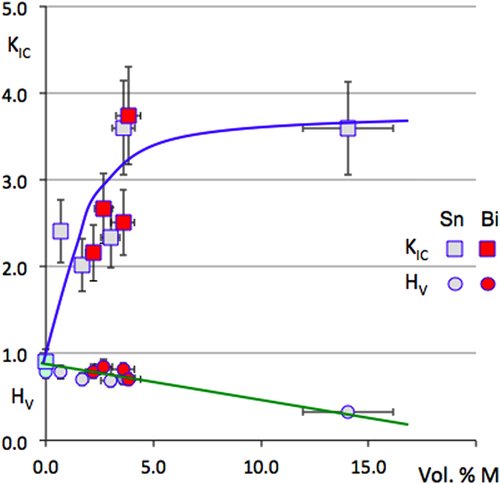
Figure 28 Change with volume fraction of metal M = Bi or Sn of the μ0, μ1 and δ1 parameters defined in figure . Dark symbols: Bi, light grey: Sn.
Polymer-matrix composites
Polymer-matrix composites reinforced with atomized quasicrystalline powder particles were invented by Sheares and Bloom [Citation57]. It so happens that such reinforcement particles are especially suited for additive manufacturing using an infrared (IR) laser beam. The process, which is described in full detail elsewhere [Citation52], consists in irradiating the flat surface of a batch of polymer powder blended with the reinforcement material using a beam of IR light whose position is computer monitored in such a way as to melt locally the polymer, thus producing a solid thin layer on top of the batch. A new layer is then deposited above the solidified one and the process restarted while the batch moves downwards by a distance equal to the layer thickness. A solid emerges, layer by layer, which can be of any possible shape. Additive manufacturing has become an industrial process that has many different options, including three-dimensional printing, and can be applied in a very versatile way to the fabrication of an immense variety of mechanical parts. Most often, however, reinforcement of the polymer is mandatory to achieve respectable mechanical performance, which can be obtained using various reinforcing materials like minerals, steel or alloys, oxides, etc. Addition of quasicrystalline powders proves superior in this respect [Citation52].
The reason for such a better performance lies in the specific electron transport properties of quasicrystals. Since conduction is achieved by hopping electrons, the Drude peak that characterizes the optical conductivity of metals in the low frequencies region has disappeared in a quasicrystal [Citation58]. As a result, the absorption of IR light is far higher in a quasicrystal in comparison to pure aluminium, its alloys, or other metals like steel, for which it comes close to R = 1, instead of R = 0.6 for a quasicrystal. A straightforward computation shows then that the elevation of temperature in a quasicrystal grain is around 30–40 K, which ensures good melting of the surrounding polymer [Citation59]. The consequences are manifold: the resulting parts are leak tight, and therefore do not need any supplementary treatment for usage under pressure, the toughness of the material is improved, and as we show in this section, tribological performance and wear resistance are significantly higher in comparison to the state of the art results using conventional filling particles. The reader is urged to have a look at the figures in [Citation52] for examples of pin-on-disk and abrasion tests that demonstrate the superior performance of quasicrystalline reinforcement in comparison to conventional state-of-the-art solutions. To the best of our knowledge, this is the first fully successful commercial application of atomized quasicrystalline powders [Citation60].
Conclusions
We have presented in this article a few series of experimental data that are significant to understand friction and solid–solid adhesion at the surface of complex metallic alloys and especially quasicrystals. We used, to this end, our own results and material from the literature. We addressed several issues, including friction in a secondary and ultra-high vacuum, fretting and cold welding, and plausible application niches for those materials in contact mechanics. Other potential application niches are addressed elsewhere [Citation4, Citation5, Citation61]. We insisted on several pieces of experimental evidence that link transport properties, on the one hand, and partial densities of states at the Fermi energy, on the other hand, to the adhesion part of friction in a vacuum. Despite not being able to directly observe electron transfer through the contact area, we showed convincing evidence that the root of solid–solid adhesion is to be found in the lowered surface energy manifested on complex Al-based intermetallics, and more specifically, the surface tension that establishes the equilibrium shape of those crystals. The balance between contributions to friction that arise from hardness, chemical composition, and complexity, via the density of states, was examined. It turns out that for simple crystals like the B2-CsCl phases of composition in the vicinity of Al50TM50, the major contribution to reduce friction comes from the choice of the TM element: TM = Cu or Pd ends up in far less friction against steel than any other TM element from the centre of the TM row. Complexity however adds a further decrease of friction, which reaches its minimum with the Al–Cu–Fe quasicrystal. On such highly complex crystals, friction happens to correlate with electronic conductivity, which sheds light on the origin of anisotropic friction observed on decagonal quasicrystals.
Many unknowns remain of course, especially at the nanoscopic scale. Here, we just mention a few. What is the effect of lattice corrugation and lattice mismatch between pin and sample? Does bulk truncation and/or lattice reconstruction, which is virtually absent on quasicrystals, but not on simpler crystals like λ-Al13TM4 [Citation62, Citation63], play any role? Do surface phasons [Citation64] interfere? Beyond the interaction between naked surfaces, which kind of response is to be expected from CMA surfaces covered by molecules like fullerenes [Citation65] or a single element quasicrystal like the three-dimensional Pb films recently uncovered by Sharma et al [Citation66]? Altogether, the new world of quasicrystalline alloys that was disclosed by Shechtman et al [Citation67] is far from being totally exploited, and more importantly, understood from the point of view of contact mechanics.
Acknowledgements
We thank Dr Julian Ledieu (IJL, Nancy) for a careful reading of the manuscript. We wish to express our gratitude towards the many collaborators who contributed to the present work either in preparing samples at Institut Jean Lamour, Nancy and Peter Grünberg Institute, Juelich, or helping during the experimental work at IJL, Nancy, LCPMR, Paris, T U Wien, Vienna, and Austrian Research Centre, Seibersdorf. The hospitality of the two latter institutions is gratefully acknowledged as well as the continuous support over the years by CNRS, Communauté Urbaine du Grand Nancy and Région Lorraine. Part of the present work was achieved in the frame of contracts HPR1-CT-1999-00024, G5RD-CT-2001-00584, NMP3-CT-2005-500140 and FP7-NMP-2007-SMALL-1 of the European Commission.
Notes
3 There are several types of quasicrystals: those which are aperiodic in the three directions of space, and are called icosahedral because they show the same point group symmetry as the icosahedron, and quasicrystals that are periodic in one direction of space, and aperiodic along the two perpendicular directions. These are coined decagonal quasicrystals. More complex situations are also known.
4 Purchased from CSEM Company in Switzerland.
5 A so-called approximant is a CMA compound that may be related to a specific quasicrystal using the same high dimensional reference frame, but according to a rational projection onto the usual 3D space, see [Citation5] for details.
6 A decagonal quasicrystal consists of a periodic stacking along a 10-fold direction of aperiodic sheets of atoms. Their symmetry is 10-fold around the periodic axis and 2-fold perpendicular to it.
7 As a matter of fact, we deal with the average value of the surface energy, neglecting its scatter on the various vicinal facets of a single crystal.
8 The existence of this threshold was derived from a critical analysis of lattice structure data by Dr Julia Dschemuchadse [Citation45].
9 In comparison, conventional metallic alloys offer toughness constants that are at least an order of magnitude larger.
References
- TsaiA PInoueAMasumotoT 1987 Jpn J. Appl. Phys. 26 1505 10.1143/JJAP.26.L1505
- TsaiA PInoueAMasumotoT 1989 Mater. Trans. Jpn Inst. Metals 30 463
- DuboisJ MWeinlandP 1988 French Patent 2635117 1993 US Patent 5204191
- DuboisJ M 2012 Chem. Soc. Rev. 41 6760 10.1039/c2cs35110b
- DuboisJ M 2005 Useful Quasicrystals Singapore World Scientific
- DuboisJ MBelin-FerréE 2011 Complex Metallic Alloys, Fundamentals and Applications Weinheim Wiley-VCH
- DuboisJ M 2009 Properties and Applications of Complex Intermetallics Belin-FerréE Singapore World Scientific 1
- BrunetPZhangLSordeletD JBesserMDuboisJ M 2000 Mat. Sc. Eng. 294-296 74 10.1016/S0921-5093(00)01202-8
- Gottlieb-SchoenmeyerSAssmusWPrud’hommeNVahlasC 2011 Complex Metallic Alloys, Fundamentals and Applications DuboisJ MBelin-FerréE Weinheim Wiley-VCH 207
- DuboisJ MPronerABucailleBCathonnetPDongCRichardVPianelliAMassianiYAit-YaazzaSBelin-FerréE 1994 Ann. Chim. Fr. 19 3
- MerstallingerA 2007 Tribological Devices Issue 1.7 Seibersdorf Austrian Research Centre MerstallingerASemeradE 1995 Test Method to Evaluate Cold Welding under Static and Impact Loading Issue 1 Seibersdorf Austrian Research Centre MerstallingerASemeradE 1998 Test Method to Evaluate Cold Welding under Static and Impact Loading Issue 2 Seibersdorf Austrian Research Centre
- DemangeVAndereggJ WGhanbajaJMachizaudFSordeletD JBesserMThielP ADuboisJ M 2001 J. Non-Cryst. Solids 173 327
- WeisbeckerPBonhommeGBottGDuboisJ M 2005 J. Non-Cryst. Solids 351 1630 10.1016/j.jnoncrysol.2005.04.053
- VeysDWeisbeckerPDomenichiniBWeberSFournéeVDuboisJ M 2007 J. Phys.: Condens. Matter 19 376207 10.1088/0953-8984/19/37/376207
- ParkJ YSalmeronM 2014 Chem. Rev. 114 677 10.1021/cr200431y
- ParkJ YThielP A 2008 J. Phys.: Condens. Matter 20 314012 10.1088/0953-8984/20/20/204105
- Belin-FerréE 2002 J. Phys.: Condens. Matter 14 R1
- DuboisJ MKangS Svon StebutJ 1991 J. Mat. Sci. Lett. 10 537 10.1007/BF00726930 KangS SDuboisJ Mvon StebutJ 1993 J. Mater. Res. 8 2471 10.1557/JMR.1993.2471
- SingerI LDuboisJ MSoroJ MRouxelDvon StebutJ 1998 Quasicrystals TakeuchiSFujiwaraT Proc. 6th Int. Conf. on Quasicrystals Singapore World Scientific 769
- DuboisJ MBrunetPBelin-FerréE 2000 Quasicrystals, Current Topics Belin-FerréEBergerCQuiquandonMSadocA Singapore World Scientific 498
- WittmannRUrbanKSchandlMHornbogenE 1991 J. Mater. Res. 6 1165 10.1557/JMR.1991.1165
- KangS SDuboisJ M 1992 Phil. Mag. A 66-1 151 10.1080/01418619208201520
- KoJ SGellmanA JJenksC JLograssoTThielP A 1999 Surf. Sci. 423 243 10.1016/S0039-6028(98)00911-X
- MancinelliCJenksC JThielP AGellmanA J 2003 J. Mater. Res. 18-6 1447 10.1557/JMR.2003.0199
- ParkJ YOgletreeD FSalmeronMRibeiroR ACanfieldP CJenksC JThielP A 2005 Science 309 1354 10.1126/science.1113239
- WuJ SBrienVBrunetPDongCDuboisJ M 2000 Phil. Mag. A 80-7 1645 10.1080/01418610008212141
- ParkJ YOgletreeD FSalmeronMJenksC JThielP ABrennerJDuboisJ M 2008 J. Mater. Res. 23-5 1488 10.1557/JMR.2008.0187
- RabsonD A 2012 Prog. Surf. Sci. 87 253 10.1016/j.progsurf.2012.10.001
- ParkJ YOgletreeD FSalmeronMRibeiroR ACanfiledP CJenksC JThielP A 2005 Phys. Rev. B 71 144203 10.1103/PhysRevB.71.054511
- ChernikovM AOttH RBianchiAMiglioriT WDarlingA 1998 Phys. Rev. Lett. 80 321 10.1103/PhysRevLett.80.321
- FilippovA EVanossiAUrbakhM 2010 Phys. Rev. Lett. 104 074302 10.1103/PhysRevLett.104.074302
- DuboisJ Mde WeerdM CBrennerJSalesMMozdzensGMerstallingerABelin-FerréE 2006 Phil. Mag. 86-6-8 797 10.1080/14786430500251848
- PearsonW B 1964 A Handbook of Lattice Spacings and Structures of Metals and Alloys Oxford Pergamon
- DongCZhangQ HWangD HWangY M 1998 Euro Phys. J. B 6 25 10.1007/s100510050522
- DuguetTKenzariSDemangeVBelmonteTDuboisJ MFournéeV 2010 J. Mater. Res. 25 764 10.1557/JMR.2010.0101
- VitosLRubanA VSkriverH LKollarJ 1998 Surface Science 411 186 10.1016/S0039-6028(98)00363-X
- GaoJLuedtkeW DGourdonDRuthsMIsraelachviliJ NLandmanU 2004 J. Phys. Chem. B 108 3410 10.1021/jp036362l
- ParkJ YOgletreeD FSalmeronMJenksC JThielP A 2004 Tribology Lett. 17-3 629 10.1023/B:TRIL.0000044513.85505.60
- JohnsonK LKendallKRobertsA D 1971 Proc. R. Soc. London A 324 301 10.1098/rspa.1971.0141
- SalesMMerstallingerABrunetPde WeerdM CKhareVTraxlerGDuboisJ M 2006 Phil. Mag. 86 965 10.1080/14786430500313838
- BeharaLDuneauM 1996 Acta Cryst. A 52 391 10.1107/S0108767395016953
- DemangeVGhanbajaJMachizaudFDuboisJ M 2005 Phil. Mag. 85-12 1261 10.1080/14786430500037049
- Trambly de LaissardièreGDolkaziZBelinESadocADucN MMayouDKeeganM APapaconstantopoulosD 1995 Phys. Rev. B 51-20 14035
- SteurerW 2000 Mater. Sci. Eng. 294–296 268 10.1016/S0921.5093(00)01334-4
- DschemuchadseJ 2012 PhD Thesis DschemuchadseJSteurerW 2012 MRS Proc. 1517 1 10.1557/opi.2012.1584
- MizutaniU 1998 J. Phys. Condens. Matter 10 4609 10.1088/0953-8984/10/21/017
- ZangD LCaoS CWangY PLuLWangX MMaX LKuoK H 1991 Phys. Rev. Lett. 66-21 2778
- KoisoMPalmerB 2013 Anisotropic Surface Energy Preprint www.isu.edu/~palmbenn/PDF/Osaka10.pdf
- SordeletD JKramerM JÜnalO 1995 J. Ther. Spray Technol. 4-3 235 10.1007/BF02646966
- FleuryEKimY CKimJ SAhnH SLeeS MKimW TKimD H 2002 J. Mater. Res. 17-2 492 10.1557/JMR.2002.0069
- PolishchukSBouletPMézinAde WeerdM CWeberSLedieuJDuboisJ MFournéeV 2012 J. Mater. Res. 27-5 837 10.1557/jmr.2011.415
- KenzariSBoninaDDuboisJ MFournéeV 2014 Sci. Technol. Adv. Mater. 15 024802 10.1088/1468-6996/15/2/024802
- SinghATsaiA P 1999 Quasicrystals: Preparation, Properties and Applications DuboisJ MThielP ATsaiA PUrbanK (Warrendale: Materials Research Society) p 213
- FleuryEKimY CKimD HKimD HKimW T 2004 J. Non-Cryst. Sol. 334-35 449 10.1016/j.jnoncrysol.2003.12.022
- Guedes de Lima CavalcanteD 2011 Desenvolvimento de compsitos auto-lubrificantes de ligas quasicristalinas/Bi, Sn PhD Thesis UFPB, Joao Pessoa, Brazil
- SpieglerRSchmauderSSiglL S 1990 J. Hard Mater. 1-3 147
- ShearesV VBloomP D 2000 Quasicrystal-polymer composite materials and methods Patent WO 005,653,8
- DemangeVMilandriAde WeerdM CMachizaudFJeandelGDuboisJ M 2002 Phys. Rev. B 65 144205 10.1103/PhysRevB.65.144205
- KenzariSBoninaDDegiovanniADuboisJ MFournéeV 2014 Acta Physica Polonica at press
- Sold under trademark PAQc® by Cini S.A., see www.cini.fr
- DuboisJ M 2011 Isr. J. Chem. 51 1168 10.1002/ijch.v51.11/12
- AddouR 2009 Phys. Rev. B 80 014203 10.1103/PhysRevB.80.014203
- LedieuJGaudryÉSerkovic LoliL NAlarćon VillasecaSde WeerdM CHahneMGillePGrinYDuboisJ MFournéeV 2013 Phys. Rev. Lett. 110 076102 10.1103/PhysRevLett.110.076102
- DuguetTÜnalBLedieuJDuboisJ MFournéeVThielP A 2011 Phys. Rev. Lett. 106 076101 10.1103/PhysRevLett.106.076101
- FournéeVGaudryÉLedieuJde WeerdM CWuDLograssoT 2014 ACS Nano 8-4 3646 10.1021/nn500234j
- SharmaH SNozawaKSmerdonJ ANugentP JMcLeodIDhanakV RShimodaMIshiiYTsaiA PMcGrathR 2013 Nature Commun. 4-2715 1 10.1038/ncomms3715
- ShechtmanDBlechI AGratiasDCahnJ W 1984 Phys. Rev. Lett. 53 1951 10.1103/PhysRevLett.53.1951