
Abstract
Numerous cracks can be observed in the top coat of thermal barrier coatings (TBCs) deposited by the atmospheric plasma spraying (APS) method. These cracks can be classified into vertical and horizontal ones and they have opposite impact on the properties of TBCs. Vertical cracks reduce the residual stress in the top coat and provide strain tolerance. On the contrary, horizontal cracks trigger delamination of the top coat. However, monitoring methods of cracks generation during APS are rare even though they are strongly desired. Therefore, an in situ, non-contact and non-destructive evaluation method for this objective was developed in this study with the laser acoustic emission (AE) technique by using laser interferometers as a sensor. More AE events could be detected by introducing an improved noise reduction filter and AE event detection procedures with multiple thresholds. Generation of vertical cracks was successfully separated from horizontal cracks by a newly introduced scanning pattern of a plasma torch. Thus, generation of vertical cracks was detected with certainty by this monitoring method because AE events were detected only during spraying and a positive correlation was observed between the development degree of vertical cracks and the total AE energy in one experiment.
Introduction
Thermal barrier coatings (TBCs) are one of the most widely applied coating systems to improve thermal, oxidation and corrosion resistances of metallic components which are used in the high temperature sections of industrial equipment such as gas turbines and aero-engines [Citation1, Citation2]. TBCs typically consist of three layers: yttria-stabilized zirconia (YSZ) top coat, MCrAlY (M is typically Ni, Co or their mixture) bond coat and Ni- or Co-based superalloy substrate. There are two major deposition methods in industry for the top coating: atmospheric plasma spraying (APS) and electron-beam physical vapor deposition (EB-PVD). APS provides advantages such as low cost, high deposition rate and applicability over large areas whereas EB-PVD is capable of producing columnar-structured coatings with high strain tolerance. The deposits fabricated by APS generally consist of a multitude of pancake-like lamellae called ‘splats’, formed by flattening and solidification of liquid droplets.
Defects such as pores and cracks are commonly found within/between the lamellae. Cracks in the top coat can be classified into vertical and horizontal ones, which are perpendicular or parallel to the surface of the substrate, respectively. These two types of cracks have different influences on the reliability and the durability of TBCs. The generation of vertical cracks reduces the residual stress in the top coat, which is generated during the cooling period due to the difference in the thermal expansion coefficient between the ceramic top coat and the metal substrate, and therefore improves the strain tolerance of the coatings [Citation3]. Vertical cracks with a length of at least a half of the top coat thickness are called ‘segmentation cracks’ and there are many reports about their effects on the coating properties and densification behavior at high temperature [Citation4]. In contrast, horizontal cracks tend to degrade the thermal cycle life of TBCs because they induce delamination of the top coat.
Since these cracks in the top coat have a great influence on the coating performance, a technique to detect the cracks is strongly required. There are several non-destructive evaluation (NDE) methods to detect the cracks such as ultrasonic and x-ray inspection [Citation5, Citation6]. However, these techniques cannot be applied in situ as a process monitoring tool. On the other hand, the acoustic emission (AE) method is one of the in situ NDE methods to detect various high speed physical phenomena, e.g. cracking, impact and friction in/on solid materials in real time. Piezo-electric transducers (PZT) are generally utilized as a sensor for AE measurement. However, it is difficult to apply at the elevated temperatures above their Curie point (170–360 °C). Therefore, a conventional PZT sensor is not suitable to monitor the thermal spraying process, in which the operation temperature is much higher than the Curie point of PZT. Our research group has developed a non-contact AE method utilizing a laser interferometer as an AE sensor [Citation7, Citation8] and tried to apply the laser AE method to monitor the APS process [Citation9–Citation12]. The results showed that AE events could be successfully detected by this technique. However, since extremely large noise was generated during the spraying period, only AE events generated during the cooling period after spraying could be detected.
An improvement of the system is still required to enable AE detection in such a noisy environment. An effort to improve signal processing has been made. Generally, a pre-setting of threshold voltage and configuration of noise filter are required for a conventional AE detection system. Therefore, the detected AE events are results of a fixed threshold and cannot be altered after the measurement. However, some AE events might be discarded if an excessive threshold value is set. To overcome this problem a more flexible signal processing system has been developed by our group and named ‘continuous wave memory’ (CWM) [Citation13], which provides an ability to record AE waveforms continuously over the experimental time and the flexibility to change analysis parameters, e.g. threshold voltage and noise filter through/after the measurement. This CWM was successfully applied with the laser AE method to detect AE during spraying of Al2O3 top coat [Citation14]. However, AE detection during spraying of the YSZ top coat of TBCs is still awaiting solution because weaker signal amplitudes are expected due to the smaller mismatches in thermal expansion coefficient between the top coat, bond coat and substrate and higher strength of the YSZ top coat than that of the alumina top coat.
In the present study, further improved signal processing and AE detection methods were developed to enable AE monitoring of the APS process of the YSZ top coat. A detailed description of the new method is given in the following section. A torch scanning pattern, by which only vertical cracks are generated in the top coat was also discovered and used to interpret the observed AE events.
Experimental procedure
Specimen preparation and experiment set-up
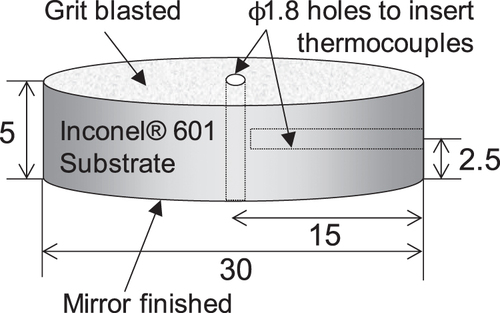
The substrate was a disk of Inconel® 601 nickel based superalloy (Nilaco, Japan) with a diameter and a thickness of 30 mm and 5 mm, respectively. The disk shape was selected instead of square or rectangular ones in order to get rid of any effect of stress concentration at the corners, which may cause undesirable cracks in the top coat. Two holes with a diameter of 1.8 mm were prepared for temperature monitoring by thermocouples as shown in figure . The top surface of the substrate was grit blasted by abrasive alumina powder of about 500 μm diameter (F36 grain size distribution, ISO 8486-1:1996 and JIS R6001:1998 compliant) to increase the adhesion strength between the substrate and the bond coat. On the other hand, the bottom surface of the substrate was mirror finished to maximize reflectance of laser light for better AE detectivity.
Figure 1 Schematic of the specimen for APS. Dimensions are in mm.
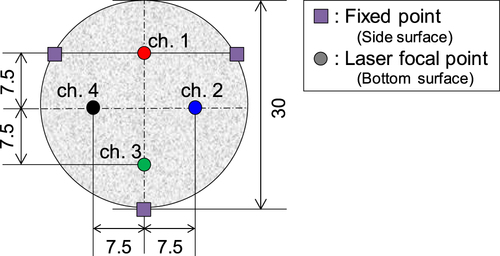
At first, CoNiCrAlY powder (AMDRY 9954, Sulzer Metco) was sprayed onto the blasted top surface of the substrate to form a bond coat with a thickness of 0.12 mm using high velocity oxygen fuel spray process with conditions shown in table . Then, the specimen was installed to the experimental equipment as shown in figure for AE monitoring during the deposition of the top coat by APS process. Vibration isolation was carefully considered in the experimental equipment. An external jig worked as a protective cover for the internal equipment against any superfluous plasma jet. Meanwhile, an internal jig worked as a holder of the specimen and a pyramid shaped mirror. These two jigs were completely separated to minimize any vibration. Furthermore, rubber vibration isolators were also attached under the both jigs. The specimen was fixed from the side surface at the positions shown in figure to inhibit any influence on AE wave propagation. All these components were carefully aligned to prevent any superfluous plasma jet from hitting the internal jig.
Table 1 Condition of the bond coat process.
Figure 2 Experimental equipment for APS and laser AE monitoring.
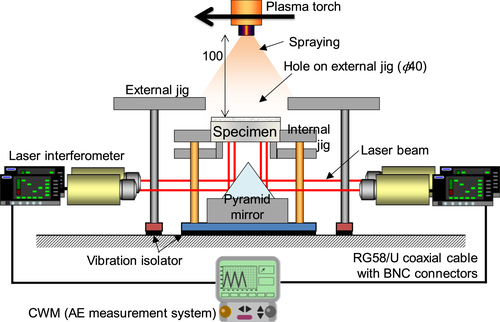
Figure 3 Fixed points and laser focal points on the specimen.
APS
ZrO2–8 mass%Y2O3 powder (SHOCOAT K-90, Showa Denko) was sprayed to deposit a top coat by the APS process. A type 3600 APS system with an SG-100 plasma spray torch (Praxair Surface Technology) was used in this study. The torch was gripped and driven over the specimen by an industrial robot arm (YR-UP20-A00, Yaskawa Electric). Two torch driving patterns named ‘loop’ and ‘zigzag’ were used in this study. Schematic diagrams showing the driving paths of these patterns are shown in figure . The loop pattern was newly introduced to drive the torch on the 100 mm × 50 mm path (figure (a)) repeatedly. An uncomplicated temperature history of the specimen was expected from this pattern. In contrast, the conventional zigzag pattern scanned over a 90 mm × 80 mm area with 5 mm pitch in the y-axis (figure (b)) and it was the same as our previous study [Citation14]. The heating area of 50 mm in diameter and spraying area of 20 mm in diameter were almost concentric circles. Various spraying conditions were tested to study the effect of spraying parameters such as plasma power and pre-heating temperature. The details of the experiments are given in table . Some experiments were conducted twice to evaluate the variability of the result. The spraying distance was kept constant at 100 mm. The target thickness of the top coat was approximately 1.0 mm for all the experiments except for experiment L7, in which spraying was conducted with very low plasma power.
Figure 4 Paths of the plasma torch in (a) loop pattern and (b) zigzag pattern.
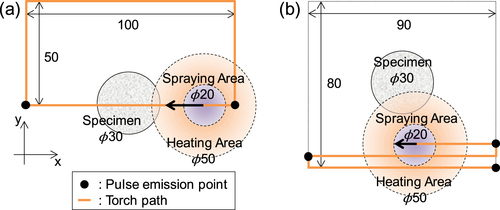
Table 2 Conditions of the top coat process.
In the following manuscript, one-time scanning of the torch in the deposition area is called ‘one pass’, i.e., one time go-round in the loop pattern or 17 lines of scanning in the zigzag pattern. The zigzag pattern was always started from the bottom right corner in figure (b) and the first pass ended at the top left corner. The second pass was the reverse run on the same path as the first pass. Subsequent passes were repetitions of these two passes. The position of the torch was monitored by pulse signals emitted from the robot arm when it passed the specific positions on the path. Since the powder was fed tangentially to the plasma jet, the center of the particle plume was somewhat deviated from the central axis of the plasma torch. Misalignment between the torch and the center of the spray area was preliminarily corrected by checking the actual sprayed stripe.
Temperature monitoring
Two type K thermocouples with 1.0 mm diameter (XS361RS, RS components) were inserted into the previously described (figure ) holes on the specimen to monitor the temperatures of the specimens. A through-thickness hole at the center of the substrate was for monitoring the temperature of the top coat, while the other was for monitoring the temperature of the substrate. Type K was selected because of its large electromotive force and sufficiently high upper limit temperature of about 1100 °C for the current experiments. The vertical thermocouple was projected about 2 mm from the surface of the bond coat to keep its projection during the top coat process. Its small diameter enabled a quick response to follow the rapid temperature fluctuation during the top coat process. The output voltages of the thermocouples were digitized by CWM with a sampling rate of 100 samples s–1, a range of ±1 V and a resolution of 16 bits to obtain an exact temperature with about 0.8 K resolution. Of course, the sheath of the thermocouple and deposited YSZ over the thermocouple would give some response delay and reduction of temperature fluctuation. However, it is a useful method for temperature monitoring during APS and its accuracy was acceptable [Citation15].
AE measurement and event detection
AE waveforms were monitored by four laser Doppler interferometers. A paired laser head unit (AT-0022, Graphtec) and heterodyne demodulation unit (AT-3600S, Graphtec) performed as one AE sensor. The probe laser was a continuous He–Ne laser beam with a power of 2 mW and a wavelength of 632.8 nm. These laser beams were focused on the bottom surface of the specimen as shown in figure . The reflected beams went back on the same light paths to the original unit and each of them was interfered with the reference signal. Then vibration with frequency range between dc to 400 kHz could be detected in the demodulation units with a sensitivity of 1 mm s–1 V–1. The output waveforms of the interferometers were continuously digitized by CWM with a sampling rate of 10 mega samples s–1 and a resolution of 12 bits, and recorded into parallelized hard disk drives. In this study, two drives with a capacity of 2 TB and a rotation frequency of 7200 rpm (HDS722020ALA330, Hitachi Global Storage Technologies) formed a RAID-0 unit to obtain the necessary speed of 80 MB s−1.
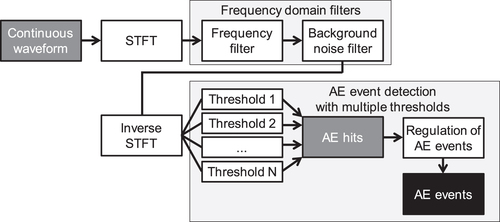
The recorded AE waveforms were analyzed by the internal software of CWM as shown in figure . At first, they were converted to a time-frequency-magnitude data set by the short time Fourier transform (STFT) method to recognize the characteristics of the effective AE signal and the noise components. In this study, the length of the Fourier transforming part of STFT was fixed at 210 samples to obtain a sufficient by fine frequency resolution as about 10 kHz (10 MHz/210). After that, an appropriate configuration of noise filter on this time-frequency-magnitude data was composed. The frequency filter in CWM enabled sharp frequency cut-off because it was conducted in the frequency domain [Citation16]. The background noise was also reduced by the soft-thresholding method [Citation17]. Then the filtered data were converted again to the time-domain waveforms. AE hits were detected by multiple thresholds to obtain better detectability. Generally, an appropriate threshold voltage can be simply determined by the noise level when the noise level is sufficiently low. However, the optimal threshold cannot be fixed at one level when the noise level is high and fluctuated. Then, the multiple thresholds method is effective. To avoid multiple counting of a single event, triggers from different threshold voltages with 100 μs were considered to be generated from the same events.
Figure 5 Analytical scheme for AE event detection in the CWM.
Results and discussion
Noise reduction and extraction of AE event
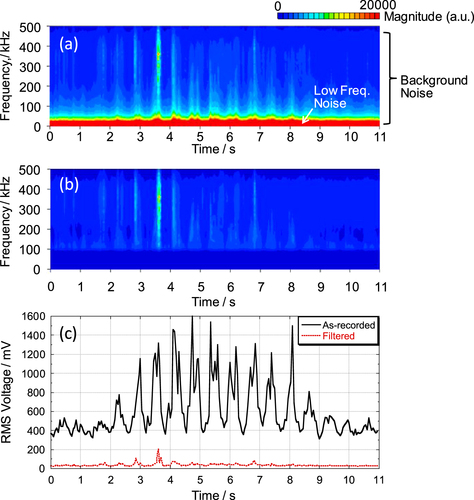
Figure shows an example of a frequency spectrogram and root mean square (RMS) voltage during the APS process with the zigzag pattern. A strong noise component with a frequency lower than 100 kHz was distinctive as shown in figure (a). Since this noise was observed continuously during the APS process and its frequency was lower than those of AE events at several hundreds of kilohertz generated from cracking in the ceramic coating [Citation12, Citation14], it was considered to be mechanical vibration of the specimen due to the plasma jet. A much weaker background noise component was also observed in figure (a), which was mainly generated from the internal circuit of the laser interferometer. The former low frequency noise could be removed using a high pass filter with a cut-off frequency of 100 kHz while the latter was removed by soft-thresholding [Citation17] with a magnitude of 3000 au in CWM. In other words, 3000 au was uniformly subtracted from all magnitude values. Negative values after the subtraction were overwritten by zero. In addition, the magnitude values below 100 kHz were also overwritten by zero. The frequency spectrogram and RMS voltage after noise reduction are shown in figures (b) and (c), respectively. In figure (c), periodical peaks of RMS voltage due to low frequency noise by spraying were observed from the as-recorded waveforms. Though they could be eliminated by the high pass filter, some transient peaks of RMS voltage remained from the filtered waveform and they could include AE events.
Figure 6 RMS voltage and spectrogram of laser AE waveform during APS (a) before noise reduction, (b) after noise reduction and (c) RMS voltages.
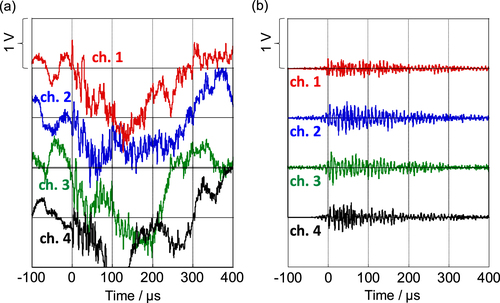
There was another type of noise that could not be removed by the filtering process as mentioned above. A typical waveform of this type of noise is shown in figure . It is only one cycle waveform that was not reasonable as an AE signal due to cracking because the elastic wave which is released in a small specimen continues for a number of cycles with multi reflection and gradually diminishes by wave propagation out of the specimen to the surroundings. Moreover, it was observed in the spraying period after the particles were injected into the torch. Therefore, this type of noise might be related to the spray particles. A confirmation test was conducted to identify the source of this noise by varying the powder feed rates (0, 7.5, and 15 g min−1). A plot of cumulative hit number with duration less than 5 μs of this noise as a function of time are shown in figure . There were a few hits detected in the preheating period where the particles were not fed and then the hits increased with time in the spraying period. No such hits were detected after spraying with all the feed rates. The effect of the powder feed rate was clearly observed, i.e. more particles lead to more hits. Based on this finding, it is reasonable that the source of this noise was from the spray particles. The similar short duration signal was observed when a ceramic particle was intentionally blown around the laser focal point. The particle might cause laser scattering when it crossed the laser beam and lead to the generation of short-duration noise. Since one particle can disturb only one laser beam at a certain time, this noise normally is detected by only one channel. Therefore, this noise can be removed by using multi-channel AE monitoring and an AE event detected by simultaneous hit of at least three of all four channels was considered as real and analyzed in the present study. Trigger timings of an AE event should be different among the channels due to the wave propagation time. Furthermore, there should be one or two cycles of delay on threshold crossing especially when the amplitude of AE waveform is small. Therefore, the upper limit of the differences of the trigger times were set as 15 μs in consideration of 15 mm of the maximum distance between AE measure points, about 3000 m s−1 of the speed of the shear wave in the substrate and two cycles time of typical AE waveform (15 mm/3000 m s −1 + 2/200 kHz = 15 μs). Figure shows typical waveforms of an AE event detected by all channels before and after the noise filtering. For the waveforms before noise filtering an appropriate threshold voltage to detect AE hits cannot be set because they contain large noise. However, the waveforms after noise reduction were sufficiently clear to detect an AE hit.
Figure 7 Typical waveform due to laser scattering by suspended particles.
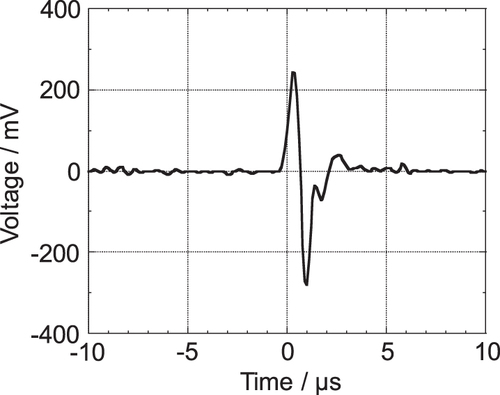
Figure 8 Cumulative hit number with 5 μs or shorter duration time.
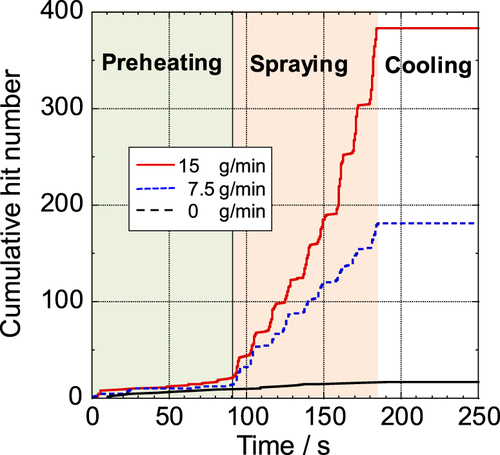
Figure 9 Typical waveform of one AE event (a) before and (b) after noise reduction filters.
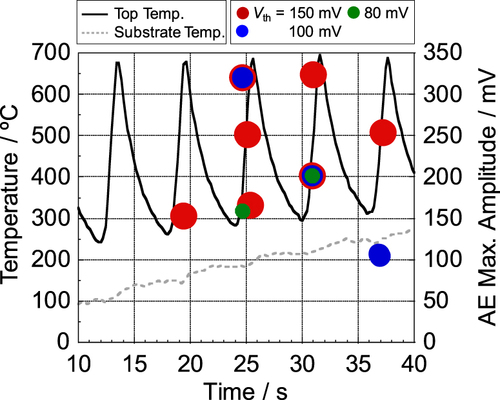
After the signal processing described above, the obtained AE events were further analyzed by the multiple threshold method. Various threshold values (50, 80, 100, 150 and 200 mV or 54, 58, 60, 63, 66 dB) were set for AE detection. Figure shows an example of event detection for experiment L1a during a duration time of 10–40 s by the multiple threshold method. The noise waveform frequently exceeded the lowest threshold voltage of 50 mV. Thus, no AE events were detected with this threshold because almost no time window was left to start the trigger from real AE hits. It means that the noise level was always over 50 mV during APS and smaller AE events below this threshold, if any, could have been missed. With the next lower threshold value of 80 mV, two events were detected in this case when the noise level was quite low. However, one of them at 24.6 s was an event with small amplitude which could not be detected with higher threshold values. The same was valid on the higher threshold values of 100 mV and 150 mV, and the numbers of detected events were three and seven, respectively. Meanwhile, events from the 200 mV threshold are not shown in this figure because all were also detected from the 150 mV threshold. Thus, the multiple thresholds with several decibel pitches provided more a detectable AE event by summation of all detected events from each threshold value. The results indicate that the multiple threshold method is very useful to extract AE events in an environment with fluctuating noise and low signal-to-noise (S/N) ratio. Furthermore, if no AE events were separately detected by the highest and lowest thresholds, i.e. 50 and 200 mV in this case, the dynamic range of the thresholds could be said to be sufficient.
Figure 10 Temperature history during APS and AE events which were detected by multiple thresholds.
Temperature history and AE behavior
Figure shows examples of temperature history and AE events as a function of time for experiments L1a, L7 and Z1. The temperature of the substrate for all experiments increased during spraying and then gradually decreased after the spraying finished. The highest substrate temperature tended to increase with increasing plasma power, i.e. it increased from 240 to 420 °C with increasing plasma power from 12 to 28 kW (figures (a) and (b)). The same trend was also observed for the top temperature. However, the highest substrate temperature in the Z1 experiment was about 600 °C (figure (c)), which was higher than that observed in the L1a experiment even if the plasma power was the same. The history of the top temperature of the specimens with the zigzag pattern was more complex than in the case of the loop pattern because both the X- and Y-coordinates of the torch would affect the top temperature. It would rise and fall in synchronization with the X-axis moving and the height of the peak would increase and decrease in association with the Y-coordinate (figure (d), a magnified view of one pass in figure (c)). Moreover, fluctuation of substrate temperature in the Z1 experiment was pronounced. These data show that the torch driving method has a strong effect on the temperature of the specimen.
Figure 11 Temperature and AE events of experiments (a) L1a (28 kW, loop), (b) L7 (12 kW, loop) and (c), (d) Z1 (28 kW, zigzag).
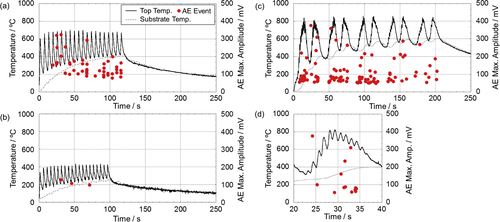
AE events by applying the previous signal processing are also shown in figure . It is noteworthy that all events were detected during the spraying period and no event was detected during the cooling period after spraying in all the experiments regardless of the different spraying parameters such as plasma power and torch driving method. It is remarkably different from the case of the alumina top coating where many AE events were detected both during spraying and cooling periods [Citation14]. The effect of plasma power on AE events was evident (figures (a) and (b)). The number of events detected in the L7 experiment was significantly less than that detected in the L1a experiment as the plasma power of the former experiment (12 kW) was lower than that of the latter one (28 kW).
Crack observation
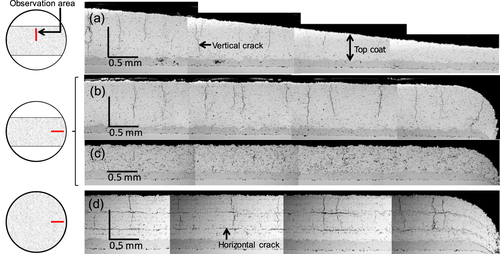
Figure shows scanning electron microscopy images of polished cross-sections of the top coats deposited from the same experiments in figure , i.e. experiments L1a, L7 and Z1. It should be noted that the thickness of the coating deposited by the loop pattern was not uniform in the direction perpendicular to the torch traveling direction due to the statistical profile of the powder distribution as shown in figure (a). The shape of the top coat was a stripe with a width of approximately 15 mm and the thickest portion was at the center. The vertical cracks were observed throughout the thickness at the center of the top coat stripe, while a few were observed around the edge of the top coat stripe (figures (a), (b)). The top coat deposited from experiment L7 had less thickness and a few vertical cracks. It should be noted that while only vertical cracks were observed in the top coats deposited by the loop pattern (figures (a)–(c)), both vertical and horizontal cracks were observed in those deposited by the zigzag pattern (figure (d)). This might be attributed to the complex temperature fluctuation of the latter. In addition, almost all of the AE events were detected during heating in experiments with the loop pattern (figure ). Probably it shows a tendency of vertical cracking to occur during heating (figures (a)–(c)). However, more careful experiments, analyses and considerations, e.g. estimation of delay of thermocouples and evaluation of temperature field in the top coat during APS are needed to confirm it.
Figure 12 Cross-sectional images of the top coat of experiments (a), (b) L1a (28 kW, loop), (c) L7 (12 kW, loop) and (d) Z1 (28 kW, zigzag).
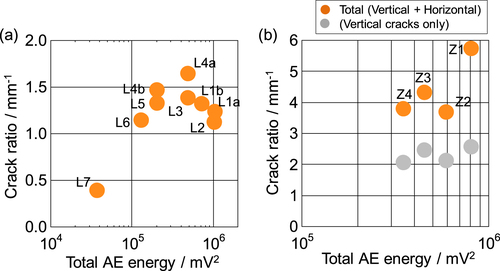
In order to quantitatively evaluate the development degree of these cracks, the ‘crack ratio’, which is defined as the total length of the cracks divided by the cross-section area of the observed top coat was derived from the cross-sectional images. Summaries of both vertical and horizontal crack ratio for all experiments are given in figure . Here, the total crack ratio was the summation of vertical and horizontal crack ratio. The contribution of vertical cracks was also displayed in figure (b) because both vertical and horizontal cracks were observed from the specimens with the zigzag pattern. In contrast, the contribution of vertical cracks was not displayed separately in figure (a) because the contribution of horizontal cracks was very small (between 1 and 9% of the total) in the loop pattern. The crack ratios of specimens deposited from the zigzag pattern (figure (b)) were higher than those deposited by the loop pattern (figure (a)) because of the horizontal cracks. The crack ratio tended to decrease with increasing preheating temperature in both the loop (experiments L4a–L6) and zigzag (experiments Z1–Z4) patterns. This is reasonable because preheating raises the temperature of the substrate, reduces the temperature difference between the top coat and the substrate and reduces the thermal stress during spraying, which is already known as a criterion of crack generation after spraying [Citation12]. The effect of plasma power was evident, i.e. lower plasma power yielded lower crack ratio. Low plasma power resulted in a smaller temperature difference between the top coat and the substrate (figure (b)) and made a more porous top coat with a thinner thickness (figure (c)) than other experiments.
Figure 13 Relationship between the total AE energy and the crack ratio of specimens with (a) loop and (b) zigzag pattern of the torch.
Relationship between AE and crack development
The previous sections have shown that spraying conditions affected both AE behavior and crack ratio of the top coat. In this section, an effort to relate AE parameter to crack ratio is made. A plot of crack ratio as a function of total AE energy is also shown in figure . Here, AE energy of an event was calculated by the square of maximum amplitude in this event and the total AE energy was a summation of energy of all events detected in one experiment. Considering the results from the loop pattern (figure (a)), a relatively better correlation between the total AE energy and the crack ratio was found in experiments L4a–L7, which were conducted with the same spraying interval but different plasma powers and pre-heating temperatures. Since only vertical cracks were generated in the loop patterns, it could be deduced that these vertical cracks were the main sources of AEs. It was not clear in our previous study [Citation14] because always vertical and horizontal cracks were generated simultaneously from the zigzag pattern. The lower crack ratio and AE energy of L7, in which the coating was made with low plasma power was acceptable. Especially, a variability of the results between experiments L4a and L4b which were conducted with the same conditions was reflected in this result. The total AE energy and the crack ratio of experiment L4a was equally larger than those of experiment L4b. It showed that the cracking in these experiments was precisely monitored by AE method in this study. The energy of each AE event and the crack area would have a strong positive correlation if they occurred due to the same mechanism because the energy release rate of these cracks were theoretically equal and the same ratio of the released energies was detected as an AE event. Similar correlation was observed from the specimens by the zigzag pattern (figure (b)). Crack generation was suppressed by pre-heating and it could be confirmed by the AE result.
However, actual energy release ratio would be different due to local variability of the mechanical properties and temperature field in the top coat. Also, the difference in positions of the cracks, noise in the AE waveform and the effect of the signal processing for noise reduction would be sources of error. In addition, it was indeterminate from the crack ratio value whether a crack was generated at a time or gradually propagated because it was only a summation of the length of cracks. Therefore, the correlation between the total AE energy and the crack ratio was not always so strong like experiments L1a–L3 in figure (a). Then, more detailed estimation of one-by-one AE events is needed in future study to clarify the mechanism of crack generation and propagation in the top coat of TBC during APS by effective utilization of the preciseness of the AE measurement in this study.
Conclusions
Selective generation of vertical cracks in the top coat of TBC during its deposition process by APS was enabled by a special driving pattern of the torch which drew a loop. An in situ, non-contact and non-destructive detection method of vertical cracking during plasma spraying was developed with laser AE measurement and a series of precise signal processing. An AE event was observed during the spraying period only and no event was detected during the cooling period after spraying. The total energy of the detected AE events showed a positive correlation with the development ratio of the vertical cracks. It showed the certainty of the detection of AE events due to the vertical cracks during an extremely noisy environment of plasma spraying. Therefore, the crack detection technique in this study could be an effective method for the development of sprayed coatings.
Acknowledgements
We thank to Mr Hiraoka and Mr Komatsu for supporting fabrication of our equipment and operation of the APS system. This work was partially supported by MEXT/JSPS KAKENHI Grant Number 23246124.
References
- PadtureN PGellMJordanE H 2002 Thermal barrier coatings for gas-turbine engine applications Science 296 280 284 280–4 10.1126/science.1068609
- MillerR A 1987 Current status of thermal barrier coatings—an overview Surf. Coat. Technol. 30 1 11 1–11 10.1016/0257-8972(87)90003-X
- KurodaSClyneT W 1991 The quenching stress in thermally sprayed coatings Thin Solid Films 200 49 66 49–66 10.1016/0040-6090(91)90029-W
- KargerMVaßenRStöverD 2011 Atmospheric plasma sprayed thermal barrier coatings with high segmentation crack densities: spraying process, microstructure and thermal cycling behavior Surf. Coat. Technol. 206 16 23 16–23 10.1016/j.surfcoat.2011.06.032
- KulkarniAGolandAHermanHAllenA JIlavskyJLongGDeCarloF 2005 Advanced microstructural characterization of plasma-sprayed zirconia coatings over extended length scales J. Therm. Spray Technol. 14 239 250 239–50 10.1361/10599630523818
- KulkariniAGolandAHermanHAllenA JDobbinsTDeCarloFIlavskyJLongG GFangSLawtonP 2006 Advanced neutron and x-ray techniques for insights into the microstructure of EB-PVD thermal barrier coatings Mater. Sci. Eng. A 426 43 52 43–52 10.1016/j.msea.2006.03.070
- PalmerC H 1986 Sensitive laser interferometer for acoustic emission and ultrasonic NDE Review of Progress in Quantitative Nondestructive Evaluation ed D O Thompson New York Springer 651 658 651–8 10.1007/978-1-4615-7763-8_67
- BruttomessoD AJacobsL JCostleyR D 1993 Development of interferometer for acoustic emission testing J. Eng. Mech. 119 2303 2316 2303–16 10.1061/(ASCE)0733-9399(1993)119:11(2303)
- WatanabeMEnokiMKishiT 2003 Fracture behavior of ceramic coatings during thermal cycling evaluated by acoustic emission method using laser interferometers Mater. Sci. Eng. A 359 368 374 368–74 10.1016/S0921-5093(03)00394-0
- NishinoiriSEnokiMTomitaK 2004 Evaluation of microfracture mode in ceramic coating during thermal cycle test using laser AE technique Mater. Trans. 45 92 101 92–101 10.2320/matertrans.45.92
- NishinoiriSEnokiMTomitaK 2003 In situ monitoring of microfracture during plasma spray coating by laser AE technique Sci. Technol. Adv. Mater. 4 623 631 623–31 10.1016/j.stam.2003.12.011
- TaniguchiKEnokiMWatanabeMKurodaSItoK 2009 In situ monitoring of cracking behaviors of plasma sprayed coatings by the laser acoustic emission technique J. Mater. Res. 24 3182 3189 3182–9 10.1557/jmr.2009.0364
- ItoKEnokiM 2007 Acquisition and analysis of continuous acoustic emission waveform for classification of damage sources in ceramic fiber mat Mater. Trans. 48 1221 1226 1221–6 10.2320/matertrans.I-MRA2007850
- ItoKOhmataSKobayashiKWatanabeMKurodaSEnokiM 2010 Crack monitoring during plasma spraying of ceramic coatings by non-contact acoustic emission method Mater. Trans. 50 1272 1276 1272–6 10.2320/matertrans.M2010004
- GanZNgH W 2004 Experiments and inelastic finite element analyses of plasma sprayed graded coatings under cyclic thermal shock Mater. Sci. Eng. A 385 314 324 314–24 10.1016/j.msea.2004.06.053
- AbbateAKoayJFrankelJSchroederS CDasP 1997 Signal detection and noise suppression using a wavelet transform signal processor: application to ultrasonic flaw detection IEEE Trans. Ultrason. Ferroelectr. Freq. Control 44 14 26 14–26 10.1109/58.585186
- DonohoD L 1995 De-noising by soft thresholding IEEE Trans. Inf. Theory 41 613 627 613–27 10.1109/18.382009