Abstract
This paper discusses recent experimental and numerical results from the authors' labs on the effects of moderate magnetic (B) fields in electrochemical reactions. The probably best understood effect of B fields during electrochemical reactions is the magnetohydrodynamic (MHD) effect. In the majority of cases it manifests itself in increased mass transport rates which are a direct consequence of Lorentz forces in the bulk of the electrolyte. This enhanced mass transport can directly affect the electrocrystallization. The partial currents for the nucleation of nickel in magnetic fields were determined using an in situ micro-gravimetric technique and are discussed on the basis of the nucleation model of Heerman and Tarallo. Another focus of the paper is the numerical simulation of MHD effects on electrochemical metal depositions. A careful analysis of the governing equations shows that many MHD problems must be treated in a 3D geometry. In most cases there is a complex interplay of natural and magnetically driven convection.
Introduction
It is generally accepted that a superimposed magnetic field can affect electrochemical processes [Citation1–8]. The majority of experimental results can be explained with magnetohydrodynamic (MHD) effects [Citation9, Citation10]. MHD effects are based on the action of the Lorentz force fL=j×B (j is the current density and B the magnetic flux density) which induces fluid flow in the cell and thus affects the transport rate of electroactive species towards the electrode. Typically the magnetic Reynolds number Rm=μσLU is small (μ; magnetic permeability, σ; electric conductivity of the electrolyte, L and U: characteristic length and velocity in the cell, respectively) and therefore induced magnetic fields can be neglected. Furthermore, induced electric fields, u×B (u is the velocity vector), are much smaller than the externally applied electric field and thus can be neglected, too.
If the electrochemical reaction is mass transport controlled, an increase of the limiting current density and of the deposition rate occurs in the majority of cases [Citation1, Citation11]. Usually thin concentration boundary layers develop near the electrodes due to the large Schmidt number, Sc=υ/D≈103 (υ kinematic viscosity, D diffusion coefficient). Consequently diffusion limits the mass transfer. The corresponding limiting current is proportional to the thickness of the concentration boundary layer. The idea behind stirring mechanically or forcing convection by external magnetic fields is to decrease the thickness of the concentration boundary layer and thereby to increase the limiting current. Some theoretical treatments describe the relation between the magnetic flux density and limiting current for simple geometries [Citation12]. In passing we notice that for some configurations the mass transport can be retarded [Citation2, Citation13, Citation14].
When discussing the effects induced by a magnetic field in an electrochemical cell, one must take into account the natural convection. Natural convection is driven by density gradients which appear as a consequence of the electrochemical reaction. For a cathodic deposition metal ions are removed from the electrolyte near the electrode, which generally causes a decrease of the density. In front of a vertically aligned cathode an upward flow of the electrolyte is generated. Due to the interplay between the MHD convection and the natural convection, deposits of uniform thickness can be obtained if one carefully designs the electrochemical process [Citation15].
A superimposed magnetic field can change the crystallization behavior and induce a more uniform deposited layer, and a more uniform current distribution. At the same time, the hardness of the deposit can increase, the macrostress of the layers can change, and their corrosion properties can be improved [Citation2]. The competition between nucleation and growth is a key parameter for the morphology of the deposited layers. If the nucleation rate is high, fine-grained materials will be obtained. If the growth rate of the nuclei is high, specific structures of the deposited layer will be generated. The frequency of the formation of new nuclei is given by the number of ad-atoms that are moving on the cathode surface. The latter depends on the flux of ions carried by the deposition current. Thus, the frequency of nucleation is influenced by the current density which in turn can be controlled by an external magnetic field.
Information about the nucleation and growth mechanism can be obtained from the current transients during potentiostatic depositions. There are models that describe the current transients in function of the number of nucleation sites (N0) and nucleation rate (A). In the present paper the Heerman–Tarallo model (HT) [Citation16] was chosen to fit the experimental data and thus extract information about N0 and A. Nucleation is often classified as instantaneous or progressive. The nuclei formed in instantaneous nucleation are considered to be born at the same moment and to grow at the same rates [Citation17]. In the case of progressive nucleation the nuclei appear at different times and grow at different rates.
In aqueous electrolytes the nickel electrodeposition is accompanied by the hydrogen evolution reaction (HER) and the measured current, j, is the sum of two partial currents, j=jNi+jHER. Most nucleation models are for the partial current of the metal reduction. This value can be obtained by differentiating the mass deposited on the electrode with respect to time, equation (1).
(1)
In equation (1) M is the molar mass of the deposited species (here MNi=58.7 g mol−1), z the number of transferred electrons (z=2), and F the Faraday constant.
Experimental details
Electrochemical Ni depositions were made at room temperature in a three-electrode electrochemical cell, which was lab-made from Teflon. A lab made quartz crystal microbalance [Citation18] was used to determine the mass of the Ni layer in situ. This information is needed to calculate dm/dt (equation (1)). The effective area of the working electrode (WE, made from Au) was around 0.22 cm2, but after each measurement the area was accurately determined from a digital photograph by using imaging software. The counter electrode (CE) was a Pt foil of approximately 3.7 cm2 area and 0.2 mm thickness, placed in parallel to the WE. The distance between the WE and the CE was approximately 2 cm. The WE was fixed vertical in the cell, parallel to the gravity. The reference electrode was a saturated calomel electrode (SCE, Sensortechnik Meinsberg GmbH, Meinsberg, Germany). In the following all potential values refer to the SCE. Nickel deposition was carried out from 0.01 M NiSO4+0.1 M Na2SO4(pH=3) at −1.1 V. All solutions were prepared from p.a. grade chemicals and highly purified water.
The magnetic field (with a flux up to 0.7 T) was superimposed from a water-cooled electromagnet (VEB Polytechnik, Phylatex, Chemnitz, Germany). The topography of the deposited layers was investigated with a contact mode AFM (atomic force microscopy, PicoSPM, Molecular Imaging, Phoenix, USA), using triangular cantilevers with sharpened pyramidal tip, made of silicon nitride (Olympus Corporation, Tokyo, Japan). The scan size was 6.6×6.6 m2.
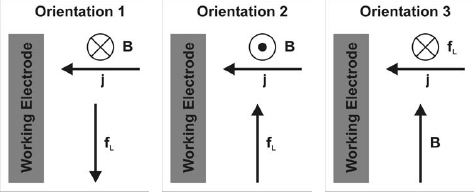
In the experiments we studied two orientations of the WE. In orientation 1 the Lorentz force (fL) is anti-parallel to the natural convection, in orientation 2 they are parallel (figure ). Orientation 3 in which the magnetic field is perpendicular to the gravity could be investigated only numerically.
Figure 1 Sketches of the different orientations of the working electrode and the magnetic field that were investigated in the present paper.
Numerical procedure
For the numerical simulation we followed the approach of Ngo Boum et al [Citation19] and Olivas et al [Citation20]. Due to the parallel hydrogen evolution the exact numerical simulation of Ni deposition is challenging. Therefore, we chose the copper deposition in 10 mM CuSO4+0.1 M Na2SO4 as a simpler model process. The momentum balance of the electrolyte which is assumed to be incompressible (∇·u=0) is described by the Navier-Stokes equation,
(2)
where ρ, η and p denote the density, the dynamic viscosity and the pressure, respectively. The Boussinesq approximation is used, and βc denotes the volume expansion coefficient associated with concentration changes (c0 is the bulk concentration). The diffusion equation of the copper ions is given by eqation (3).
(3)
The electric current density is defined as j=−σ∇Φ−zFD∇c, where Φ denotes the electric potential. With the generalized potential f=Φ+zFDc/σ, the current density can be written as j=−σ∇f, and by virtue of the conservation of charge ∇·j=0 the potential equation to be solved is Δf=0.
The boundary conditions applied are no slip at the walls and free slip at fixed free surfaces for the velocity. Limiting current conditions were assumed at the electrodes, i.e. ∂f/∂n=∂c/∂n zFD/σ,c=0 at the cathode and c=2c0 at the anode. At insulating walls the normal derivatives of c and f have to vanish, ∂f/∂n=∂c/∂n=0.
Typical dimensionless numbers for a cell of L=40 mm height are Sc=υ/D≈1450, Rayleigh number Ra=βcgc0L3/(Dυ)<109, and MHD parameter Nc=zFDB0/(ρβcgL)<10−1. The MHD parameter describes the ratio of electromagnetic to buoyancy forces.
Results and discussion
Nucleation of nickel in a magnetic field
The interplay between the natural convection (NC) and the additional convection imposed by the Lorentz force can be clearly seen in figures and . When both forces act in the same direction (orientation 2), an increase of the total limiting current (i.e. the value of j beyond 30 s), as well as of the nickel partial current, jNi is observed (figure ). This happens because the hydrogen and the nickel reduction are mass transport controlled in the chosen potential range. Therefore the primary effect of the additional convection of the electrolyte is to increase the limiting current density.
Figure 2 Transients of the total (A) and the partial current density (B) of Ni deposition for various magnetic flux densities in orientation 2. Black solid line: no B field, red dashed line: 0.42 T, green dotted line 0.60 T, blue dash-dotted line: 0.72 T.
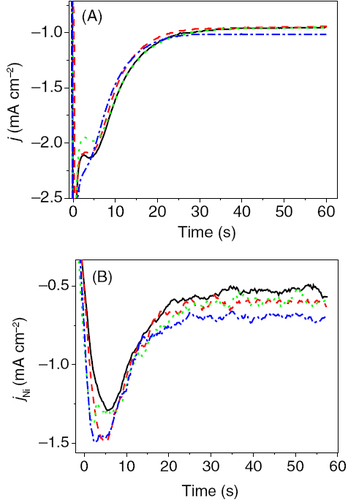
Figure 3 Transients of the total (A) and the partial current density (B) of Ni deposition for various magnetic flux densities in orientation 1. Black solid line: no B field, red dashed line: 0.42 T, green dotted line 0.60 T, blue dash-dotted line: 0.72 T.
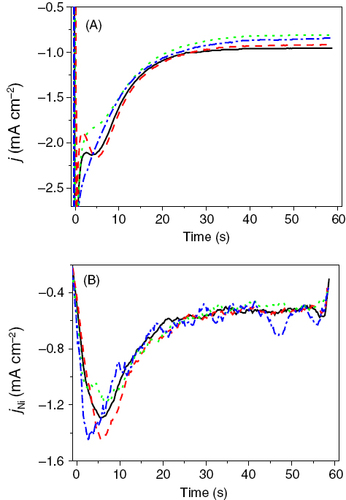
For the orientation 1, the Lorentz force opposes the NC. The differences in the current transients are obvious compared to those obtained for the orientation 2. With increasing the magnetic field, the total limiting current decreases (figure ). The partial current of nickel is affected just at short times.
The partial current of the nickel reductions is clearly affected by the magnetic field which indicates changes in the nucleation behavior. In order to quantify this effect we fitted our jNi curves to the functions given by Heerman and Tarallo [Citation16].
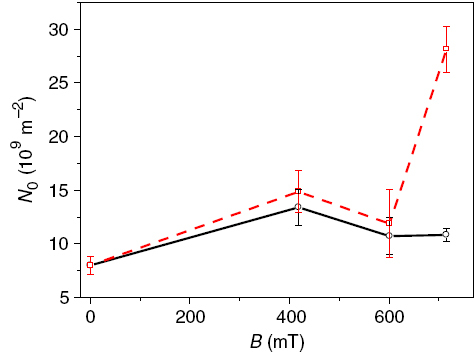
Figure shows the values of the nucleation site density (N0) as a function of the magnetic flux density in orientations 1 and 2. Only the part of the current transients between 8 and 50 s was selected for the fitting procedure. Fitting of the first part of the current transients gave usually relatively high errors. The average values of N0 and the nucleation rate A (not shown) were calculated from a series of 8 to 10 measurements, each of which was performed under identical conditions.
Figure 4 Nucleation site density (N0) for Ni deposition in orientation 1 (black circles) and orientation 2 (red squares) as a function of the magnetic flux density.
Instantaneous nucleation implies a high growth rate of the new phase and a small number of formed active nucleation sites, while the progressive nucleation implies a slow growth rate and a large number of new nuclei formed. Usually, A≪1 indicates progressive nucleation, while A≫1 is specific for instantaneous nucleation [Citation21].
The strongest effect of B on the nucleation was found for orientation 2: the number of nucleation sites increased strongly in a magnetic field. For orientation 1 no significant effects could be noticed (figure ). As mentioned before, the N0 values are the most sensible to changes of the experimental conditions. Therefore, the additional convection induced in orientation 2 (note, that Lorentz force and natural convection are parallel, figure ) gives the strongest effects. The N0 values obtained for our experimental conditions are around 109 m−2, and the A values were smaller than unity. These facts indicate that under the influence of a magnetic field the nucleation is progressive for the orientation 2.
In figure the AFM height images of the Ni layers are presented. One can see that the uniformity of the deposited layers increases in the orientations 1 and 2 with the magnetic field. Using standard AFM evaluation software, one can determine the total number of grains in the scanned area (table 1). The minimum dimensions of the grains counted were 14 nm in diameter and 18 nm in length and width. The number of grains deposited in orientation 2(B=0.7 T) is much higher compared to orientation 1 and the case of B=0 T. In addition the presence of a magnetic field seems to reduce the mean grain size of the Ni layers. If one compares the AFM results (figure and table 1) with the data shown in figure , one can conclude that the HT model is in accordance with the experimental data. Both the AFM information and the N0 values obtained from the HT model indicate a strong increase of the number of nuclei with the magnetic field in orientation 2.
Figure 5 AFM height images of the Ni layers deposited at −1.1 V without magnetic field (A), B=0.7 T T in orientation 1 (B) and B=0.7 T in orientation 2 (C).
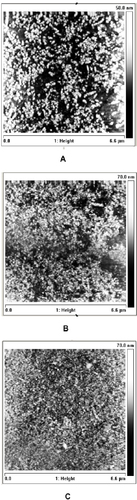
Number of grains and the mean grain size mean for the Ni layers deposited at −1.1 V for different orientations of the magnetic field (see figure for a sketch of the orientations).
Numerical simulation of MHD effects during copper electrolysis
Figure shows 2D simulation results for a rectangular cell with vertical electrodes. The natural convection which is driven by the concentration gradients in front of the electrodes is clearly visible. If an external field is applied perpendicular to the paper plane a Lorentz force will appear parallel to the electrodes (figure , orientation 2). The experiments discussed above showed a sizeable MHD effect, and we were optimistic to confirm this with our 2D simulations. Surprisingly we were not able to find any MHD effect with this numerical setup, no matter how large the magnetic field was made. Of course, there is natural convection and there is Lorentz force density in the electrolyte (figure ). But they do not interact, or in other words the Lorentz force does not induce convection. The explanation for that finding is that the irrotational part of the Lorentz force in general is balanced by pressure, and only the solenoidal part drives convection. By using div j=0 and div B=0, for homogeneous magnetic fields it follows
(4)
Figure 6 Results of the 2D numerical simulation of the electrolysis of copper sulfate in a rectangular cell in orientation 2. The cathode (copper deposition) is on the left side of the cell. Sc=2000; Ra=105; Nc=10−2. From left to right: velocity, concentration, Lorentz force and curl of the Lorentz force.
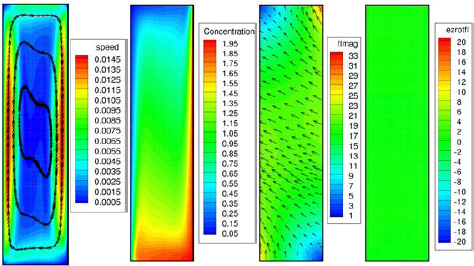
Now assuming a two-dimensional current density j(x, y), it can be shown that for orientation 2 the curl exactly vanishes. Note that this is in agreement with the numerical results (figure ). Thus the MHD effects (i.e. the increase of j for t>30 s, figure ) found in the experiments must be due to 3D effects, i.e. a z-component of the current density as it appears at cell walls in z-direction or due to transient flow effects. And indeed a 3D numerical treatment for orientation 2 shows that there is MHD flow associated with inhomogeneities of the concentration at the sidewalls of the cell (not shown). These are the origin of the experimental findings described above.
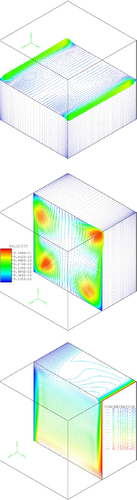
For orientation 3 the problem is three-dimensional anyway as the main Lorentz force vector points out of the 2D plane. 3D simulations for this orientation in a cubic cell with Sc=2000, Ra=106 show strong effects on convection and therefore on the limiting current (figure ). This can be easily understood from equation (4) as the vertical derivative of the current density should be much larger than derivatives in other directions because the thickness of the concentration boundary layer might vary considerably. Currently experiments are under way in our labs to confirm the numerical results for orientation 3.
Figure 7 Results of the 3D numerical simulation of the electrolysis of copper sulfate in a cubic cell in orientation 3. The cathode (copper deposition) is on the left side of the cell. The relatively strong magnetic field causes horizontal swirl (middle) which supersedes the concentration-driven convection (top). The bottom image shows the concentration profile under the conditions of MHD driven convection. Sc=2000, Ra=106, Nc=10−2.
The lesson to be learned from the numerical results is that MHD flow profiles in electrochemical cells can be rather complicated and arguing just with the direction of the Lorentz force might be misleading.
Conclusions
Our work shows that the interplay between the natural and the MHD convections must be taken into account. Thus, when the Lorentz force and the natural convection act in the same direction, an increase of the partial current due to Ni electrodeposition with the magnetic field was obtained. Due to the enhanced mass transport the nucleation site density increased with the magnetic field. The resulting Ni layers were more fine-grained as was verified with ex situ AFM measurements.
The MHD effect is three-dimensional and often cannot be explained with simplified two-dimensional models. Its quantitative understanding can be quite complex as only the solenoidal part of the Lorentz force contributes the MHD flow. More details on the numerical treatment of MHD in electrochemical reactions will be discussed in a forthcoming paper.
Acknowledgments
This work was supported by the German Science Foundation (DFG) within the framework of the collaborative research center 609 ‘Electromagnetic flow control in metallurgy, crystal growth and electrochemistry’. AB gratefully acknowledges financial support within the Heisenberg fellowship program of the DFG (grant BU 1200/9-1).
References
- FahidyT Z 1983 J. Appl. Electrochem. 13 553 http://dx.doi.org/10.1007/BF00617811
- TackenR AJanssenL J J 1995 J. Appl. Electrochem. 25 1 http://dx.doi.org/10.1007/BF00251257
- DevosOAaboubiOChopartJ-PMerienneEOlivierAAmblardJ 1998 J. Electrochem. Soc. 145 4135 http://dx.doi.org/10.1149/1.1838927
- DanilyukA LKurmashevV IMatyushkovA L 1990 Thin Solid Films 189 247 http://dx.doi.org/10.1016/0040-6090(90)90453-K
- BrillasERamblaJCasadoJ 1999 J. Appl. Electrochem. 29 1367 http://dx.doi.org/10.1023/A:1003852924383
- MatsushimaHNohiraTMogiIItoY 2004 Surf. Coat. Technol. 179 245 http://dx.doi.org/10.1016/S0257-8972(03)00860-0
- IspasAMatsushimaHPliethWBundA 2007 Electrochim. Acta 52 2785 http://dx.doi.org/10.1016/j.electacta.2006.10.064
- SchneiderOBundAIspasABorissenkoNAbedinS Z EEndresF 2005 J. Phys. Chem.B 109 7159 http://dx.doi.org/10.1021/jp044892r
- FahidyT Z 1973 Electrochim. Acta 18 607 http://dx.doi.org/10.1016/0013-4686(73)85026-1
- AogakiRFuekiKMukaiboT 1975 Denki Kagaku oyobi Kogyo Butsuri Kagaku 43 504
- FahidyT Z 2001 Prog. Surf. Sci. 68 155 http://dx.doi.org/10.1016/S0079-6816(01)00006-5
- LioubashevskiOKatzEWillnerI 2004 J. Phys. Chem.B 108 5778 http://dx.doi.org/10.1021/jp037785q
- BundAKuehnleinH H 2005 J. Phys. Chem.B 109 19845 http://dx.doi.org/10.1021/jp053341d
- WeierTEckertKMuhlenhoffSCierpkaCBundAUhlemannM 2007 Electrochem. Commun. 9 2479 http://dx.doi.org/10.1016/j.elecom.2007.07.026
- FahidyT Z 1974 Chem. Eng. J. 7 21 http://dx.doi.org/10.1016/0300-9467(74)80022-5
- HeermanLTaralloA 1999 J. Electroanal. Chem. 470 70 http://dx.doi.org/10.1016/S0022-0728(99)00221-1
- ScharifkerBHillsG 1983 Electrochim. Acta 28 879 http://dx.doi.org/10.1016/0013-4686(83)85163-9
- BundASchwitzgebelG 2000 Electrochim. Acta 45 3703 http://dx.doi.org/10.1016/S0013-4686(00)00463-1
- BoumG B NAlemanyA 1999 Electrochim. Acta 44 1749 http://dx.doi.org/10.1016/S0013-4686(98)00292-8
- OlivasPAlemanyABarkF H 2004 J. Appl. Electrochem. 34 19 http://dx.doi.org/10.1023/B:JACH.0000005609.07861.07
- HydeM EComptonR G 2003 J. Electroanal. Chem. 549 1 http://dx.doi.org/10.1016/S0022-0728(03)00250-X