Abstract
Direct current (DC) glow discharge plasma nitriding was carried out on three selected surface-roughened AISI 304 stainless steel samples at 833 K under 4 mbar pressures for 24 h in the presence of N2:H2 gas mixtures of 50 : 50 ratios. After plasma nitriding, the phase formation, case depth, surface roughness, and microhardness of a plasma-nitrided layer were evaluated by glancing angle x-ray diffractogram, optical microscope, stylus profilometer, and Vickers microhardness tester techniques. The case depth, surface hardness, and phase formation variations were observed with a variation in initial surface roughness. The diffraction patterns of the plasma-nitrided samples showed the modified intensities of the α and γ phases along with those of the CrN, Fe4N, and Fe3N phases. Hardness and case depth variations were observed with a variation in surface roughness. A maximum hardness of 1058 Hv and a case depth of 95 μm were achieved in least surface-roughened samples.
Introduction
To meet the growing demand of austenitic stainless steel for industrial applications, with improved properties such as surface hardness, reduced friction coefficient, improved wear and corrosion resistance properties, plasma nitriding has been considered as markedly efficient for improving such properties [Citation1–5]. These properties robustly depend on processing temperature, time duration and gas composition, thereby leading to different phase formations. For example, the plasma nitriding of austenite steel below 723 K forms an expanded austenite (γ N) or S-phase. In the S-phase, nitrogen remains in supersaturated solid solution without depleting chromium from an austenitic structure by the precipitation of chromium nitride (CrN). The supersaturated solid solution provides excellent wear and corrosion resistance properties in austenite steel [Citation6–9].
Moreover, when plasma nitriding is performed above 723 K, the precipitation of CrN occurs along with other nitride phases, such as Fe2–3N (ε) and Fe4N (γ′). At such a high temperature, the precipitation of CrN (β) results in the binding of chromium from the solid solution, thereby degrading the corrosion resistance properties. However, plasma nitriding at high temperatures imperatively enhances the surface hardness, nitrogen diffusion layer, and wear resistance properties [Citation10–15]. All these properties are not only affected by the temperature, pressure, gas composition, and geometry of the sample, but also by the final surface state. As a result, the effects of the original surface roughness level of the samples on the layer formation and subsequently the phase formation during nitriding would also be significant.
In the present investigation, an attempt was made to study the response of the selective initial surface roughness level of AISI 304 stainless steel during plasma nitriding for phase formation in correlation with nitrogen diffusion depth and surface hardness. After plasma nitriding, surface roughness, different phase formations, nitrogen diffusion layer thickness, and surface hardness were analyzed using a stylus profilometer, an x-ray diffractometer, an optical microscope, and a Vickers microhardness tester, respectively.
Experimental Procedure
Sample preparation and plasma nitriding
Disc shaped AISI 304 stainless samples (with a diameter of 25 mm and a thickness of 5 mm) of three selective surface roughnesses Ra, such as 0.05 μm (a), 0.475 μm (b), and 1.02 μm (c), were selected for glow discharge plasma nitriding (GPN). These Ra values were attained by employing different mechanical surface preparation methods, such as mirror polishing, machining, and grinding, respectively. The samples were identified as S1, S2 and S3 having Ra values of 0.05 μm, 0.475 μ m, and 1.02 μm, respectively. The samples were rinsed in acetone and air-dried before mounting on the sample holder of the reactor. The sample holder was then placed in a 500-mm-diameter and 500-mm-height bell-shaped stainless steel vacuum chamber for GPN.
GPN was performed on these roughened samples using the equal ratio (50:50) of nitrogen (N2) and hydrogen (H2) gas mixtures under a pressure of 4×10² Pa at 833 K for 24 h. Prior to GPN, sputter cleaning was carried out on the samples in the presence of Ar:H2 gas mixture in 80:20 ratios under a pressure of 1×10² Pa at 523 K for 1 h in the same vacuum chamber. This process was performed only to ensure the exposure of the active surface of the samples for GPN by removing the native oxide and contaminated layer over the surface, if present. The plasma was generated on the samples by D.C. pulsed power supply having a repetition rate of 10 kHz, and consequently, the temperature of the samples was monitored with a Fe-Constantan-Fe thermocouple (J-type), which was attached to the sample holder through a tubular support. After 24 h of GPN, the nitrided samples were cooled in the same vacuum chamber under the flow of the same gas mixture until the temperature decreased to 453 K. The cooling in the same environment is mostly performed to inhibit the oxidation of the samples.
Characterization techniques
The average surface roughness Ra measurements over the entire surface were performed on untreated and plasma-nitrided samples by applying a Hommelwork LV-100 made stylus profilometer tester, with a tracking length of 4.8 mm and least count of 0.01 microns. The untreated and plasma-nitrided samples were analyzed for phase determination using a Bragg-Brentano geometry x-ray diffractometer (Seifert XRD-3000 PTS Diffractometer) operated at 40 kV and 30 mA with a filtered CuKα radiation of 0.15418 Å wavelength.
The case depth of the nitrided layer was revealed using a 2% Nital etchant and examined with a Leitz-made optical microscope at a magnification of 100X. Microhardness measurements were performed on nitrided surfaces with a Leitz-made Vickers hardness tester using a load of 0.981 N, and five readings were taken to determine the exact value. The microhardness as a function of depth profile was determined from the edge to the core over the cross section of the samples.
Results and discussion
Phase formation in selected surface-roughened samples
Figures and show the x-ray diffraction patterns obtained before (untreated) and after the plasma nitriding of selected samples of AISI 304 steel with various Ra values in the diffraction angle range, 2θ, of 35–95°. The untreated samples S1 and S2 show four γ-Fe (austenite) peaks and one α-Fe (ferrite) peak, while S3 shows only γ peaks. The presence of an α peak in S1and S2 is due to the stress-induced transformation of γ to α during surface finishing, which is in good agreement with an earlier observation [Citation1]. However, the existence of only a γ peak in S3 could be possible owing to the removal of a stress-induced modified layer during grinding. The observed γ peaks correspond to the (111), (200), (220), and (322) reflection planes, and the α peak corresponds to the (110) plane, as shown in figure . The d-values of all the observed peaks are calculated using Bragg's equation 2dSinθ=nλ, and are shown in Table 1. These d-values (table 1) show that the 2θ positions of all the γ peaks shift towards higher 2θ values with an increase in initial Ra. However, the γ (220) and γ (322) peaks show a greater shift than the first two γ peaks, i.e., the (111) and (200) planes; in other words, the amount of expansion of the (220) and the (322) planes is larger than that of the (111) and (200) planes, which is clearly observed in figure This indicates that there seems to be a distortion relative to the fcc lattice.
Figure 1 X-ray diffractogram of as-prepared AISI 304 stainless steel samples.
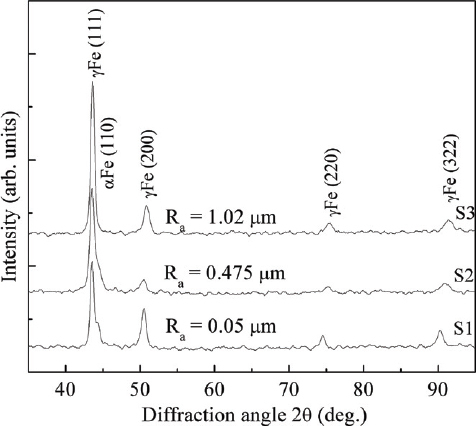
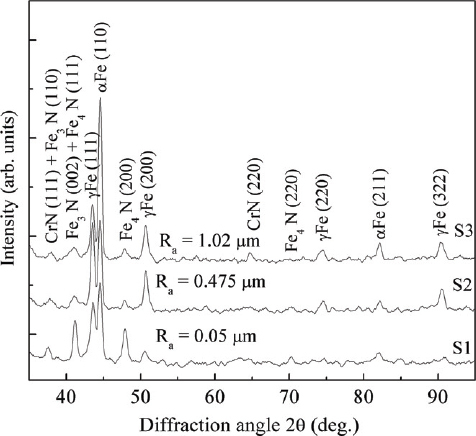
Figure 2 X-ray diffractogram of AISI 304 stainless steel samples after plasma nitriding.
Surface roughnesses (Ra) and lattice spacings (d) of untreated and plasma nitrided AISI 304 austenite stainless steel samples.
Furthermore, figure shows the x-ray diffraction patterns of S1, S2 and S3 after plasma nitriding. The plasma nitriding produces the well-resolved nitrided phases of CrN (220), Fe4N (200), Fe4N (220) and α (211), in addition to the two mixed nitride phases of CrN (111)+Fe3N (110) and Fe3N (002)+Fe3N (111) and five characteristic peaks (as shown in figure ). The additional nitride phase of Fe4N of the (220) plane and the CrN phase of the (200) and (220) planes are only observed in S1, S2, and S3, respectively, in addition to the mixed nitride phases. However, the γ (220) plane completely disappears from S1 after plasma nitriding. The relative intensity of these nitrided phases in S1 is higher than that in S2 and S3, as shown in figure . These findings indicate that the sample with the lowest Ra, i.e., S1 with an initial α phase facilitates the incorporation of more nitrogen into the matrix. However, as the initial Ra increases (small amount of the α phase present), the relative intensity of the nitride phases decreases. These observations lead to the possibility that a pure γ phase resists nitride phase formation, whereas the presence of the α phase facilitates nitride formation, resulting in an improved intensity in the sample with a low Ra. The γ phase has a fcc structure, whereas the α phase has a bcc structure. The fcc structured γ phase resists nitride formation due to high packing fraction compared with the α phase. On other hand, after plasma nitriding, the intensities of CrN and the initially unresolved α (110) phase gradually increase (in figure ) with increasing initial Ra. The intensity of α (110) is higher in S3 (absence of the α (110) phase under no treatment condition, as shown in figure ) than in S1 and S2, as shown in figure . Herein, in the plasma nitriding at 833 K, austenite may prefer to decompose into CrN and ferrite [Citation7].
Furthermore, the d-values of all the observed γ and α phases in the plasma-nitrided S1 decrease compared with those in the untreated S1, whereas in the cases of the plasma-nitrided S2 and S3, an opposite behaviour, except for the α phase, is observed, as shown in table 1. Hence, the reduction in d-value in the effectively surface-finished S1 with an initial Ra of 0.05 μm after plasma nitriding suggests that high nitrogen concentration (which reflects from the intensely nitrided phases) induces compressive stress rather than longitudinal stress, as observed in S2 and S3. However, the shift in γ phase (in figure ) is similar to that in the untreated samples (in figure ) with respect to Ra.
Surface roughness Ra measurement
The Ra values of the untreated and plasma-nitrided S1, S2 and S3 are shown in table 1. The obtained results show that Ra increases after plasma nitriding irrespective of the initial Ra. The plasma-nitrided S1 shows a 26.4-fold increase in Ra, while the plasma-nitrided S3 shows only a 1.9-fold increase in Ra compared with the untreated samples. The high amount of increment in the Ra of S1 (i.e., considered as an almost homogeneous surface finish) is possibly due to the efficient effect of differential sputtering induced by ion bombardment in two different grains, namely, bcc ferrite and fcc austenite phases compared with that in the case of pure fcc austenite phase in S3. This differential sputtering results of the formation of intense nitride phase in S1 are comparable to that in S3, as shown in figure . Such intense nitride phases mean more nitrogen constituents as a result of the more pronounced lattice deformation through the twining of grain and grain boundaries in S1, causing a more roughened surface after plasma nitriding. However, another possible reason for the least amount of increment in the Ra values of S2 and S3 is the more pronounced scattering of ions over the inhomogeneous surface, the less distinct lattice distortion due to the small amount of nitrogen incorporated in the present matrix, and the thermal gradient due to the inhomogeneous surface.
Surface hardness
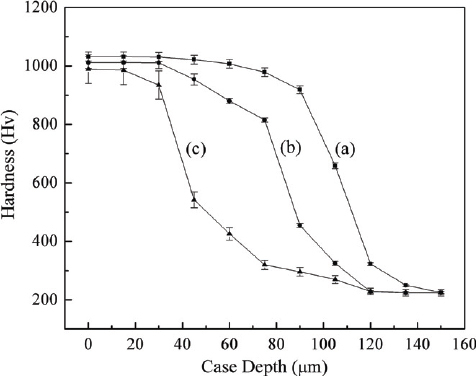
Figure shows the variations in microhardness as a function of the case depth of the three selected plasma nitrided AISI 304 stainless steel samples at 833 K for 24 h with equal ratios of N2 and H2. The microhardness profiles were obtained from the cross sections of all the processed samples. All the samples show high surface hardnesses (>950 Hv) that drop monotonically. A maximum surface hardness of 1058 Hv is achieved for S1 with an initial Ra of 0.05 μm. Therefore, the maximum hardness of S1 is attributed to the intense nitride phase (in figure ) as well as to the development of compressive stress by the reduction in d-value (table 1) after plasma nitriding. However, for S3, the hardness is attributed to the precipitation of CrN over the surface as well as the nitride layer.
Figure 3 Surface hardness as function of case depths of (a) S1, (b) S2 and (c) S3.
Case depth
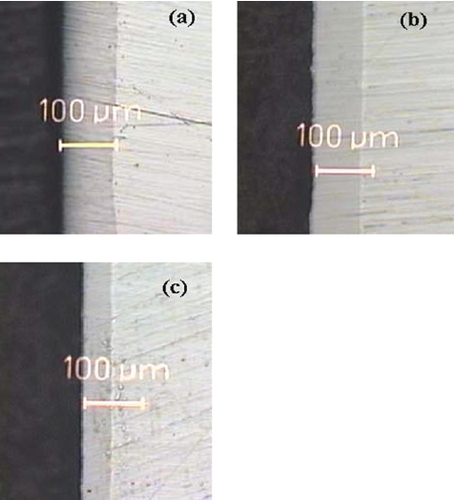
An optical micrograph of a cross-sectioned plasma-nitrided AISI 304 stainless steel of the three selected roughened samples is shown in figure . S1 with the least initial Ra, i.e. 0.05 μm has a maximum case depth of ∼95 μm compared with S3 with the highest Ra, i.e. 1.02 μm of ∼42 μm. The maximum case depth of S1 was attained owing to presence of an initial α phase that facilitates the incorporation of more nitrogen constituents during plasma nitriding at such an elevated temperature of 833 K, resulting in an intense nitride phase, as shown in figure . However, for sample S3, the low case depth is due to the precipitation of the CrN phase over the surface in the early stage of nitriding that hinders nitrogen diffusion in the matrix.
Figure 4 Optical micrograph of case depths of (a) S1, (b) S2 and (c) S3 after plasma nitriding.
Conclusions
The initial surface roughness and the presence of α phase have significant effects on the properties of steel during plasma nitriding. The low-surface-roughness S1 exhibits an initial α phase, which plays a crucial role in plasma nitriding in terms of the increments in final surface roughness, case depth, and surface hardness. The low-surface-roughness sample shows a 26.4-fold increment in surface roughness, whereas high-surface-roughness sample shows only a 1.9-fold increment after plasma nitriding. The sample having initial α phase produced a larger case depth and a higher surface hardness than those that have no initial α-phase signal in XRD analysis. This indicates that α-phase facilitates nitrogen incorporation, and that only the γ phase sample shows γ-to-CrN and α-phase transformations during plasma nitriding resulting in a small case depth and a low hardness.
References
- BlawertCWeisheitAMordikeB LKnoopF M 1996 Surf. Coat. Technol. 85 15 http://dx.doi.org/10.1016/0257-8972(96)02880-0
- ChengZLiC XDongHBellT 1999 Surf. Coat. Technol. 191 195 http://dx.doi.org/10.1016/j.surfcoat.2004.03.004
- LarischBBruskyUSpiesH J 1999 Surf. Coat. Technol. 116–119 205 http://dx.doi.org/10.1016/S0257-8972(99)00084-5
- BorgesC F MHenneckeSPfenderE 2000 Surf. Coat. Technol. 123 112 http://dx.doi.org/10.1016/S0257-8972(99)00506-X
- BorgioliFFossatiAGalvanettoEBacciT 2005 Surf. Coat. Technol. 200 2474 http://dx.doi.org/10.1016/j.surfcoat.2004.07.110
- MentheEBulakAOlfeJZimmermannARieK T 2000 Surf. Coat. Technol. 133–134 259 http://dx.doi.org/10.1016/S0257-8972(00)00930-0
- XuX LWangLYuZ WHeiZ K 2000 Surf. Coat. Technol. 132 270 http://dx.doi.org/10.1016/S0257-8972(00)00905-1
- LiangW 2003 Appl. Surf. Sci. 211 308 http://dx.doi.org/10.1016/S0169-4332(03)00260-5
- XioaoleiXLiangWZhiweiYZukunH 2005 Surf. Coat. Technol. 192 220 http://dx.doi.org/10.1016/j.surfcoat.2004.04.085
- CzerwiecTRenevierNMichelH 2000 Surf. Coat. Technol. 131 267 http://dx.doi.org/10.1016/S0257-8972(00)00792-1
- VenkatesanKSubramanianCGreenL KStraffordK N 1997 Surf. Coat. Corrosion 53 507
- LiangWBinXZihiweiYYaqinS 2000 Surf. Coat. Technol. 130 304 http://dx.doi.org/10.1016/S0257-8972(00)00713-1
- WangLJiSSunJ 2006 Surf. Coat. Technol. 200 5067 http://dx.doi.org/10.1016/j.surfcoat.2005.05.036
- GontijoL CMachadoRMiolaE JCastelettiL CAlcantaraN GNascenteP A P 2006 Mater. Sci. Engg. A 431 315 http://dx.doi.org/10.1016/j.msea.2006.06.023
- MingoloNTschiptschinA PPinedoC E Surf. Coat. Technol. at press