
Abstract
Optical coherence tomography is an imaging technology that has revolutionised the detection, assessment and management of ocular disease. It is now a mainstream technology in clinical practice and is performed by non‐specialised personnel in some settings. This article provides a clinical perspective on the implications of that movement and describes best practice using multimodal imaging and an evidence‐based approach. Practical, illustrative guides on the interpretation of optical coherence tomography are provided for three major diseases of the ocular fundus, in which optical coherence tomography is often crucial to management: age‐related macular degeneration, diabetic retinopathy and glaucoma. Topics discussed include: cross‐sectional and longitudinal signs in ocular disease, so‐called ‘red‐green’ disease whereby clinicians rely on machine/statistical comparisons for diagnosis in managing treatment‐naïve patients, and the utility of optical coherence tomography angiography and machine learning.
In a short 27-years, optical coherence tomography (OCT) has become an indispensable, modern‐day tool for the comprehensive evaluation of ocular disease and diseases of the visual pathway. It is a diagnostic imaging technology that provides a swift, high‐resolution, and non‐invasive cross‐sectional view of microscopic, anterior and posterior ocular structures.Citation1991 The technology has progressed from time domain to spectral domain, and swept‐source models are also now available. The shift from time domain to spectral domain OCT saw the removal of the need for mechanical movements of the reference arm, thus achieving faster, higher‐quality scans with fewer artefacts and greater resolution. OCT angiography (OCT‐A) represents the latest in the chain available in clinical practice, with the capacity to provide a unique, non‐invasive view of retinal and choroidal vasculature, and has demonstrated a further potential to alter clinical practice patterns.Citation2018
Several OCT adjuncts are available, including: options for fundus viewing (with some instruments providing a wide‐field option), enhanced depth imaging of the choroid and sclera, averaging to improve the signal‐to‐noise ratio, live tracking and image registration. Software analysis algorithms are also manifold, ranging from thickness or volumetric analyses (total or layer‐by‐layer), normative comparison, asymmetry analyses, automated landmark detection (of structures such as the fovea centre, optic cup and disc), visualisation options (colour rendering, en face, movie or three‐dimensional reconstructions), and integrity analyses specific to a single layer or band, for example, the Cirrus OCT ‘advanced retinal pigment epithelium (RPE) analysis’. In Australia, the ability to use and interpret OCT now forms an entry‐level competency criteria into the optometric profession.Citation2015
We can, but should we? The use of routine OCT for disease screening
OCT uses low‐coherence interferometry to generate a reflectivity profile in the axial direction, known as an A‐scan.Citation1991 Several adjacent A‐scans are compiled to produce a structural OCT B‐scan or histology‐like, cross‐sectional view of ocular topography. Finally, a volume of B‐scans may be assembled to produce a C‐scan, en face or front on view of the same tissue. OCT‐A images are formed using the decorrelation signal (amplitude and phase variables) of OCT B‐scans acquired in rapid succession and provide a non‐invasive ‘map’ of intrinsic ocular blood flow.Citation2015 Both en face OCT and OCT‐A images may also be tweaked to provide a discriminate, ‘dissected’ view of deeper retinal tissues with relatively little interference from inner structures. OCT may be generally applied for in vivo imaging of the cornea, anterior chamber, vitreous, retina, optic nerve head, macula and/or choroid, for a range of purposes, including: (1) the earlier detection of eye disease; (2) more accurate differential diagnosis of ocular disease, including more precise disease staging; or (3) change assessment over time.
The primary caveat regarding the use of OCT for any of these applications is that despite its resemblance, structural OCT B‐scans are not the same as histology. The resultant image is a representation of the optical rather than the histological staining properties of tissue structure and is bound by that same logic. For example, opaque structures will cause posterior shadowing, such as in the case of a melanotic choroidal naevus.Citation2012 Similarly, an irregular highly reflective surface such as drusen in the RPE/Bruch's membrane complex will backscatter and alter the visibility of Henle's fibre layer.Citation2011 Historically, there has also been considerable confusion regarding the origin of the layers and the descriptors for the various layers, bands and zones.Citation2014 For instance, the now dubbed ‘inner segment ellipsoid zone’ has been formerly described as the inner segment outer segment junction or the photoreceptor integrity line.Citation2014 Clinicians should also be wary of any quantitative data generated from these qualitative images. Each measurement may be compared against a normative database and using the manufacturers’ conventions, values colour‐coded green are interpreted as falling within normal limits. Red indicates a value outside of normal limits and as such could be described as abnormal or a ‘fail’ result. However, to use these tools effectively, clinicians should carefully consider the likelihood of false positives (red disease) or false negatives (green disease) in the context of the clinical view of the optic disc, macular and posterior pole, and take an active interest in scrutinising the raw data whenever available. Although time‐consuming, this step is key to avoiding errors in diagnosis and thus management. More recently, OCT‐A has been likened to fluorescein angiography. However, a key difference is that OCT‐A, although capable of visualising choroidal neovascularisation membranes, does not capture leakage.Citation2014
The purpose of this review is to provide a practical guide for the application of OCT to ocular disease assessment in treatment‐naïve patients, that is, patients most likely to be seen in a primary care setting who have not received any treatment for their chronic eye disease. Because the leading causes of blindness in Australia are age‐related macular degeneration (AMD), diabetic retinopathy (DR) and glaucoma,Citation2018 the application of OCT to these diseases forms the focus of this manuscript. Through illustrative cases of patients seen at the Centre for Eye Health,Citation2016 we describe both the advantages and limitations of its use. We also emphasise the importance of an evidence‐based, multimodal imaging approach to eye care. Finally, we discuss the role of OCT as a diagnostic versus a screening test. Research‐related variations on OCT, not yet widely available in clinical practice, including polarisation‐sensitive OCT, projection‐resolved OCT‐A or multi‐directional OCT, will not be discussed.
All case images herein were captured under a standardised testing protocol (varying by the eye condition in question) combining: monoscopic and stereoscopic fundus photography (Kowa WX 3D non‐mydriatic retinal camera, Kowa, Tokyo, Japan), Optomap ultra‐widefield and fundus autofluorescence imaging (Optomap Panoramic 200Tx, Optos, Dunfermline, Scotland, UK), OCT (Cirrus HD‐OCT, Carl Zeiss Meditec, Dublin, California, USA and/or Spectralis HRA2 + OCT, Heidelberg Engineering, Heidelberg, Germany) with scan spacing and density at the discretion of the examining clinician, and standard automated perimetry (Humphrey visual field analyzer, Carl Zeiss Meditec). Patient written consent was obtained in accordance with the Declaration of Helsinki and approved by a Biomedical Human Research Ethics Advisory Panel of the University of New South Wales, Australia.
Age‐related macular degeneration
Early to intermediate AMD
A current clinical classification scaleCitation2013 recommends subdividing AMD into three stages: early, intermediate and late. Large drusen (> 125 μm in diameter) and pigmentary abnormalities define the intermediate stage, while macular atrophy and/or neovascularisation marks the conversion to late‐stage disease (Figure 1A). Using OCT, drusen in intermediate AMD typically appear as nodular elevations of the RPE/Bruch's membrane complex with medium internal reflectivity.Citation2004 Pigmentary abnormalities, on the other hand, usually coincide with hyper‐reflective foci in the outer retina and variations in RPE thickness.Citation2013 The overlying outer nuclear layer and other photoreceptor layers (external limiting membrane and the ellipsoid zone) often exhibit associated attenuation and thinning. Scrutiny of the photoreceptor layers is important and may be considered in conjunction with drusen height, ultrastructure, area and volume as predictive ‘biomarkers’ of disease progression.Citation2009 For example, subretinal drusenoid deposits confer a 2–6‐fold higher risk of progression to late AMD.Citation2010 Choroidal thickness is also garnering increasing interest and may hold prognostic value for identifying patients who have or are at risk of developing AMD‐related macular atrophy (particularly if the subfoveal choroidal thickness is ≤ 124 μm).Citation2018 Using OCT‐A, non‐neovascular AMD may present with large areas of signal void and reduced flow signal in the choriocapillaris (due to flow velocities below the decorrelation threshold and/or decreased choriocapillaris vessel calibre and density).Citation2018
Figure 1. A: Optical coherence tomography (OCT) signs of age‐related macular degeneration (AMD). Drusen or elevations of the retinal pigment epithelium (RPE)/Bruch's membrane complex, hyper‐reflective foci in the outer retina and subretinal drusenoid deposits are key risk factors for progression, typical of intermediate AMD, and may be identified using OCT data acquired from a single patient attendance. In contrast, atrophy (in this instance, complete thinning of the outer nuclear layer and dropout of the ellipsoid zone and RPE with and without outer retinal tubulation; yellow arrowhead), incommensurate sub‐ or intra‐retinal fluid (appearing as optically empty spaces) and subretinal hyper‐reflective material represent OCT signs of advanced AMD. B: Four eyes illustrating the clinical application of OCT for change analysis in AMD. Each row shows a common sequence of events that precede progression to advanced disease: (i) the emergence of hyper‐reflective foci overlying drusen followed by pigment migration, (ii) confluence of drusen over time followed by regression, (iii) emergence of hyper‐reflective foci followed by the development of nascent geographic atrophy, (iv) shallow drusenoid pigment epithelial detachment with eventual development of drusen substructures and intra‐retinal fluid; examination dates appear at the bottom of each image.
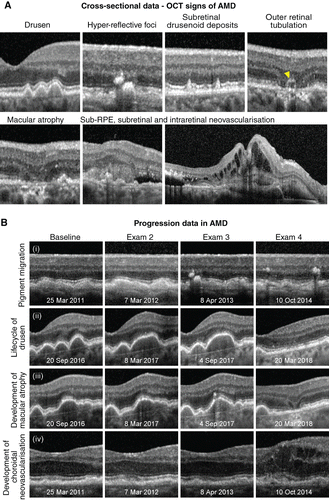
AMD‐related macular atrophy
AMD‐related macular atrophy (including geographic atrophy), on structural OCT, should span at least 250 μm and appears as thinning or dropout of the outer nuclear layer, ellipsoid zone and/or RPE with posterior hyper‐transmission.Citation2018 Incomplete and complete variations, with variable degrees of RPE loss and irregularity, have also been recently described.Citation2018 Incomplete denotes discontinuity in the findings, while complete describes more absolute homogeneity. In the junctional zones surrounding atrophy, OCT and OCT‐A provide an additional means of predicting the rate of disease progression by showing outer retinal and RPE alterations beyond the area of visible atrophy, much like fundus autofluorescence.Citation2018
Neovascular AMD
In neovascular AMD, OCT has been heralded as indispensable with a sensitivity of at least 90 per cent and high inter‐ and intra‐observer agreement.Citation2017 In suspecting neovascular AMD, the clinician should carefully evaluate the subretinal and sub‐RPE space for fluid or incommensurable hyper‐reflective material (blood or fibrovascular tissue). Any intra‐retinal fluid or cystic spaces are also untoward and a screening strategy based on a minimum inter‐scan distance of 240 μm using spectral domain or swept source OCT (rather than time domain) is ideal for the detection of treatment‐relevant exudative signs.Citation2017 Small pockets of subretinal fluid inbetween adjacent drusen not exceeding their peaks occurs in 11 per cent of eyes with intermediate AMDCitation2011 and should be interpreted as a subclinical variation of choroidal neovascularisation mandating close surveillance or referral. The progression of intermediate AMD to advanced disease over time may also be facilitated using OCT by combining a working background knowledge of these key signs and their significance, with careful simultaneous comparison of sequential B‐scans (Figure 1B).
Advancement of neovascular AMD is typified by widespread morphological changes in foveal contour, subretinal fluid, fibrosis, pigment epithelial detachment and/or a diffuse increase in retinal thickness > 250 μm.Citation2008 Outer retinal (nuclear) tubulation describes any round or ovoid hypo‐reflective space with hyper‐reflective surrounds in the outer nuclear layer, and should be readily distinguished from intra‐retinal cysts.Citation1996 Outer retinal tubulation is common although not specific to advanced AMD and is often recalcitrant to anti‐vascular endothelial growth factor therapy, while intra‐retinal cysts indicate active disease requiring treatment.Citation2015
The emergence of OCT‐A
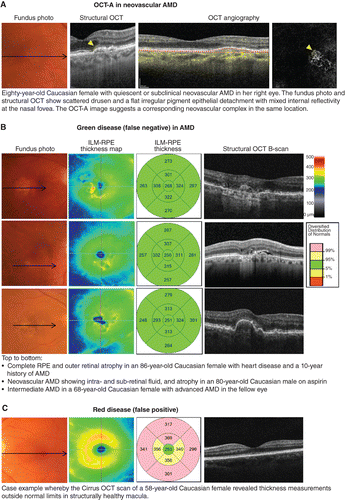
The gold standard to date for the diagnosis of neovascular AMD is fluorescein angiography; however, a limitation of both fluorescein angiography and structural OCT is that they enable only indirect visualisation of choroidal neovascularisation‐related signs and do not allow visualisation of the membrane itself.Citation2014 Dye studies are also invasive and carry a rare, albeit not negligible, risk of anaphylaxis. Using OCT‐A, choroidal neovascularisation can be visualised non‐invasively typically in the normally ‘avascular’ space between the outer border of the outer plexiform layer and Bruch's membrane. The evolution of OCT‐A has re‐invigorated the conversation regarding the sub‐group of conditions, known as quiescent, non‐exudative neovascular, or ‘subclinical’ choroidal neovascularisation (Figure 2A).Citation2013 These cases describe eyes with demonstrable choroidal neovascularisation using fluorescein angiography, indocyanine green angiography or OCT‐A without exudation that may be safely followed without treatment. The inverse scenario whereby choroidal neovascularisation may not be visible on OCT‐A despite the presence of exudative signs is common and may often be ascribed to projection artefacts, media opacities or a masquerading condition of choroidal neovascularisation, including other common causes of macular oedema, such as central serous chorioretinopathy, myopic maculopathy (haemorrhage in the absence of choroidal neovascularisation) or DR.Citation2018
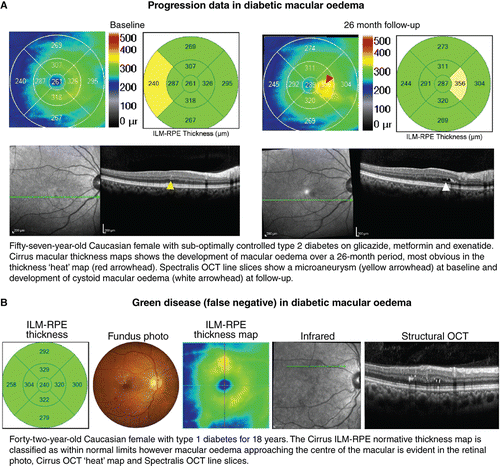
Figure 2. A: Case images illustrating the emerging application of optical coherence tomography angiography (OCT‐A) in age‐related macular degeneration (AMD). B: Examples of green disease (false negatives) that is cases where the internal limiting membrane (ILM)‐retinal pigment epithelium (RPE) thickness values fall within normal range despite the presence of significant AMD signs, reflecting that the injudicious reliance on macular thickness measurements is not recommended. C: Case example of OCT‐rendered red disease (false positives) at the macula.
The connection between clinical management and OCT signs of AMD
Current clinical guidelines recommend monitoring intermediate AMD and geographic atrophy every 6–18-months.Citation2015 Modifiable risk factors (such as smoking) should be addressed and Age‐Related Eye Disease Study 2 nutritional supplements and Amsler grid self‐monitoring should also be recommended. The defining features of at least large drusen and pigmentary abnormalities may be easily identified using OCT; however, both signs within themselves are non‐specific and occur in other macular diseases. Subretinal drusenoid deposits on OCT and/or macular atrophy may alert the clinician to a higher‐risk phenotype of AMD but also occur, albeit rarely, in the absence of AMD.Citation2009 Sub‐retinal, intra‐retinal, and sub‐RPE fluid as occurs in neovascular AMD should be managed urgently and referred to a specialist within two weeks.Citation2013 However, as with the other signs, sub‐retinal and sub‐RPE fluid can also occur in other self‐resolving presentations such as acute central serous chorioretinopathy. In contrast, once the diagnosis of AMD is established, OCT provides an invaluable adjunct and supplement to the core testing, particularly for early detection and monitoring. Thus, a multimodal approach to ocular assessment in AMD, and mimicking disorders, is recommended.
Limitations of OCT imaging in AMD
The signs of AMD, especially neovascular AMD, are commonly associated with OCT segmentation or centration errors.Citation2013 Both invalidate the automated thickness or volume measurements; the former does so by mis‐identifying either the inner or outer boundary while the latter implies inaccurate identification of the fovea and thus a misplacement of the calculation grid. These errors are likely to be more significant in the presence of low signal strength, advanced disease or increased retinal thickness.Citation2012 Thickness values between instruments should also not be compared, not least due to limitations in agreement that may relate to variations in the segmentation boundaries used and the segmentation error rate.Citation2017 In the absence of errors, change in macular thickness over time may inform management decisions. Specific to AMD, OCT software algorithms for the automated measurement of drusen load in intermediate disease (area and volume) and geographic atrophy in late disease (area and proximity to the foveal centre) may also be clinically meaningful, particularly for disease monitoring;Citation2017 however, they are prone to the same decentration and segmentation errors.
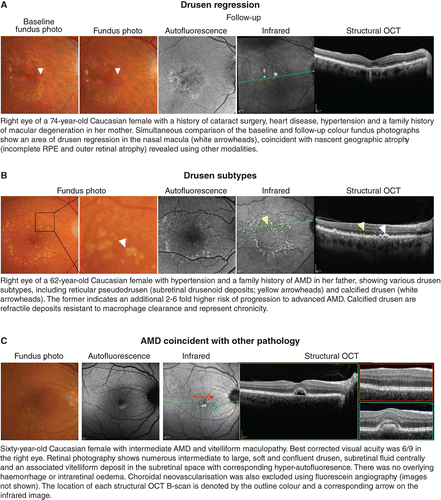
The signs of late AMD are often subtle and ill‐defined. To date, OCT‐A for the detection of choroidal neovascularisation has garnered interest but remains heavily user‐dependent, with sensitivities ranging between 50–85 per cent.Citation2018 Early detection using OCT still requires careful, systematic scrutiny of multiple layers. Injudicious reliance on global parameters, such as macular thickness values (Figure 2B, C), is not recommended, although other en face scans may be useful in providing a holistic view of the area and volume of involved regions. Significant signs, such as drusen regression,Citation2013 drusen subtypesCitation2010 or nascent geographic atrophyCitation2015 may also be better identified using other methods (Figure 3A, B). Finally, the accurate interpretation and differentiation of AMD from other mimicking disorders often requires scrupulous inspection by appropriately trained staff with a thorough understanding of the pathophysiology, epidemiology and clinical characteristics of each condition (Figure 3C).
Figure 3. A: Drusen regression and B: drusen subtypes, especially reticular pseudodrusen or calcified drusen, represent significant risk factors for progression in age‐related macular degeneration (AMD) and are better followed using en face imaging methods and a multimodal imaging approach. C: Mimicking disorders and mixed presentations of disease are also better identified using an evidence‐based, multimodal imaging approach.
Key points
OCT may be usefully applied to identify treatment‐naïve cases at high risk of progression to late AMD.
The OCT findings of cases suspected of neovascular AMD should be carefully examined for any sub‐retinal, sub‐RPE or intra‐retinal fluid using a minimum inter‐scan distance of 240 μm. OCT‐A is a useful adjunct for the detection of choroidal neovascularisation; however, sensitivity ranges between 50 and 85 per cent.
Limitations: The signs of AMD are commonly associated with OCT segmentation or centration errors. Certain significant signs, including drusen regression, drusen subtypes or nascent geographic atrophy, are better identified using a multimodal imaging approach than OCT alone.
Diabetic retinopathy (DR)
Clinically, DR is subdivided into non‐proliferative, proliferative, and diabetic macular oedema (DMO) which may occur at either the non‐proliferative or proliferative stage. The non‐proliferative sub‐type is characterised by specific ophthalmoscopic signs, including microaneurysms, dot or blot intra‐retinal haemorrhages, intra‐retinal microvascular abnormalities (IRMA), venous calibre abnormalities, cotton wool spots, and hard exudates (intra‐retinal lipid).Citation1991 Proliferative diabetic retinopathy is characterised by neovascularisation on the optic disc or elsewhere with or without pre‐retinal or vitreous haemorrhage.Citation2003 The number and distribution of lesions form the basis for current clinical classification systems.Citation1991 While dilated fundus examination is the recommended method of grading DR using classifications such as the International Clinical Diabetic Retinopathy and Diabetic Macular Edema Disease Severity Scales,Citation2003 these techniques are increasingly being supplemented by advanced en face and cross‐sectional imaging techniques such as widefield scanning laser ophthalmoscopy and OCT (Figure 4A). More recently, OCT‐A has demonstrated a number of potential roles in DR diagnosis and management, such as identifying areas of retinal non‐perfusion often invisible with funduscopy and identifying potential biomarkers for disease severity (Figure 4B).
Figure 4. A: Key signs of diabetic retinopathy (DR) as they appear using optical coherence tomography (OCT) data attained at a single visit. Dilated fundus examination forms the basis of grading DR but is being increasingly supplemented by OCT to assist in differential diagnosis. B: OCT‐A (angiography) signs of DR. As pictured, microaneurysms may take on a range of shapes varying from nodular to earlobe‐like.
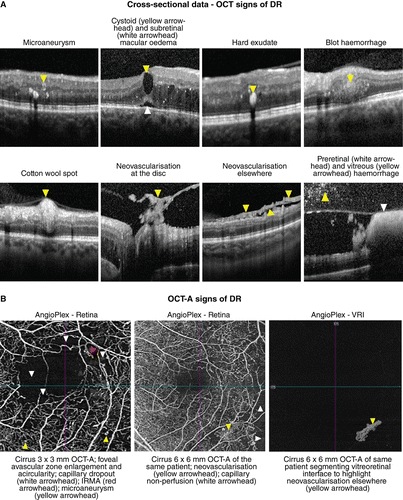
Microaneurysms are the earliest clinical sign of DR and may be undetectable using OCT, particularly if low‐density or low‐resolution volume scans are acquired. If visible, they typically appear on OCT as small round or oval lesions, usually within the inner nuclear layer, fully or partially capsulated in 56 per cent of cases.Citation2010 The majority of microaneurysms have moderate to highly hyper‐reflective lumen (81.4 per cent of cases)Citation2017 and are often located adjacent to intra‐retinal cystoid spaces. The hypo‐reflective variant occurs less commonly, in 18.6 per cent of cases. Microaneurysms are less visible with OCT‐A as compared to fluorescein angiography; as few as 62 per cent of microaneurysms detected with fluorescein angiography manifest within OCT‐A images, likely due to a lower rate of blood flow or absence of flow within the lesion.Citation2010 Within OCT‐A images, microaneurysms take on a range of shapes including nodular (65 per cent of cases), comma‐shaped, coil‐shaped, semilunar, crescent and earlobe‐likeCitation2018 and the majority of microaneurysms are located within the deep capillary plexus.Citation2017
Clinically, microaneurysms are difficult to distinguish from intra‐retinal dot/blot haemorrhages, although OCT imaging shows the latter is typically located deeper in the retina and has a more amorphous shape.Citation2010 Hard exudates are intra‐retinal protein and/or lipid deposits which tend to appear as numerous hyper‐reflective deposits in the outer retina using OCT, often associated with intra‐retinal oedema. OCT imaging can also identify small hyper‐reflective foci that cannot be visualised with fundus biomicroscopy but show similar hyper‐reflectivity to hard exudates; these may represent precursors of hard exudates.Citation2013
OCT for early detection of diabetic retinopathy and diabetic macular oedema
Diabetic macular oedema, defined as thickening of the macula due to accumulation of fluid resulting from a breakdown of the inner blood‐retinal barrier, is the most common vision‐threatening complication of DR. It can present in a focal, diffuse or cystic pattern of intra‐retinal oedema which may co‐exist with subretinal oedema.Citation1999 OCT can usefully show hypo‐reflective spaces within the inner and/or outer retinal layers or sub‐retinally when sufficient density scans are used. Alternatively, a diffuse or focal increase in retinal thickness may occur, better appreciated in the retinal thickness maps (Figure 5) or macular change analyses. With OCT‐A, pockets of intra‐retinal fluid may lead to decreased signal intensity or an apparent complete absence of flow.Citation2015
Figure 5. A: Case images illustrating the application of optical coherence tomography (OCT) for change analysis in diabetic retinopathy (DR). Note that the early detection of subtle cases such as these may be best appreciated using the retinal thickness maps. B: Green disease whereby other imaging modalities reveal consistent evidence of diabetic macular oedema although the normative analysis (left) using Cirrus OCT classifies all thickness values as within normal limits. Abbreviations: as with Figures 1.
Early detection is vital to the prevention of vision loss and due to its high sensitivity OCT, as an adjunct to fundus examination for DR, is now widely regarded as indispensable for the detection of DMO and monitoring response to treatment. The International Council of Ophthalmology Guidelines for Diabetic Eye Care, updated in 2017, emphasise that the definition and classification of DMO should take into account OCT findings, if available.Citation2018 However, the high costs and training required preclude its use outside of high‐resource settings. There are also a number of proposed OCT‐based classification systems for DMO, not yet widely adopted, which in turn evaluate various parameters including retinal thickness and/or volume, presence/absence of hard exudates, location, morphology, vitreomacular interface changes and microstructural alterations.Citation2013
The term subclinical DMO was first described using time domain OCT (Stratus, Zeiss) by the Diabetic Retinopathy Clinical Research Network (http://DRCR.net) as central retinal thickness beyond 225 μm (not greater than 299 μm) in the absence of centre‐involving macular oedema detectable using slitlamp fundus examination.Citation2012 Of importance, 38 per cent of patients with these subclinical findings progressed to DMO or required treatment by two years. Subclinical DMO was later redefined by Diabetic Retinopathy Clinical Research Network using spectral domain OCT (Cirrus, Zeiss) as retinal thickness > 260 μm and < 290 μm in women and > 275 μm and < 305 μm in men.Citation2015 Directly comparing measurements from different OCT imaging technologies is problematic, due to differences in scan resolution, speed of acquisition and algorithms for locating the boundary of the outer retina, bringing into question the clinical usefulness of a numerical definition of DMO or subclinical macular oedema for eye care professionals in clinical practice.Citation2012 Nevertheless, increased central retinal thickness in the absence of other structural abnormalities may provide a biomarker for future progression to DMO.
Structural OCT has limited value in evaluating signs of severe non‐proliferative DR such as venous calibre abnormalities and intra‐retinal microvascular abnormalities; however, OCT may assist in the differential diagnosis of cotton wool spots, seen as a hyper‐reflective thickening of the retinal nerve fibre layer, as well as in confirming the presence of neovascularisation and determining the location of vitreous and pre‐retinal haemorrhage.Citation2015 Using OCT, neovascularisation may appear as pre‐retinal hyper‐reflective material on the retinal surface or proliferating along the posterior vitreous interface. Vitreous haemorrhage can be seen as hyper‐reflective dots within the vitreous cavity and pre‐retinal (or sub‐hyaloid) haemorrhage may present as an area of hyper‐reflectivity trapped between the internal limiting membrane of the retina and the posterior vitreous interface.Citation2017
The emerging role and limitations of OCT in DR
OCT‐A has shown promise as a non‐invasive method of ascertaining the morphology of intraretinal microvascular abnormalities and neovascularisation,Citation2015 but outside the posterior pole the technique is limited by field of view and difficulty in off‐axis image acquisition. Akiyama et al.Citation2018 used OCT and OCT‐A to demonstrate that persistent vitreous attachment at the optic disc (that is absence of posterior vitreous detachment) is essential to the growth of neovascularisation at the optic disc, with neovascularisation proliferating along both sides of the posterior vitreous interface, and that neovascularisation arises from the neuroretinal rim or outside the optic disc margin rather than from the optic cup. Similarly, Vaz‐Pereira et al.Citation2017 found that 79 per cent of neovascularisation of the retina involved proliferation along the outer surface of the posterior vitreous interface, arising from areas of ischaemic retina with persistent vitreous attachment. Within the posterior pole, vitreous and pre‐retinal haemorrhage likely results from tractional forces and shear stress exerted on the area of neovascularisation bound to the retinal circulation.Citation2017
Prior to the emergence of OCT‐A, evaluation of early retinal ischaemia in DR was limited to ophthalmologists with access to fluorescein angiography. Current generation OCT‐A enables rapid, non‐invasive visualisation of areas of reduced capillary perfusion, enlargement and distortion of the foveal avascular zone (FAZ) and pruning of the arteriolar branches (Figure 4B). OCT‐A has also shown capillary impairment associated with intra‐retinal microvascular abnormalities, cotton wool spots or anomalous vascular loops and thus may be useful in staging disease severity.Citation2015 Areas of capillary non‐perfusion appear to be better delineated on OCT‐A than with fluorescein angiography or clinical examination.Citation2015 Capillary closure may occur in early stages of DR, worsening as DR progresses; thus measurements such as FAZ size could potentially represent biomarkers for DR progression.Citation2015 Krawitz et al.Citation2017 found a strong correlation between acircularity of the FAZ and the presence of DR.
Key points
DR is characterised by a diverse series of specific ophthalmoscopic signs. The appearance of these signs using OCT and OCT‐A has been well‐described in the literature; however, the specific application of OCT in eyes without DR on clinical examination has not been fully determined.
OCT is an indispensable adjunct for the detection and management of all sight‐threatening DMO.
Limitations: OCT and OCT‐A for the assessment of intra‐retinal microvascular abnormalities and neovascularisation is presently limited by field of view. The application of OCT and OCT‐A to DR assessment in treatment‐naïve patients is evolving and may, in the future, include routine evaluation of the posterior vitreous interface and FAZ.
Glaucoma
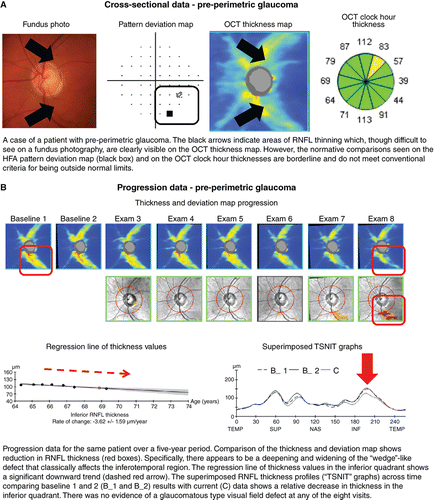
The definition of glaucoma has evolved considerably over the past few decades.Citation1998 Beginning in the early twentieth century with a simple definition of observable characteristic optic nerve head and retinal nerve fibre layer changes with corresponding visual field loss in the presence of elevated intraocular pressure, the definition has since developed into one that is multifaceted and complex.Citation2012 Recent definitions have revisited the notion that structural deficits characteristic for glaucoma must be present,Citation2009 even in the absence of other clinical features such as visual field deficits.Citation1991 In other words, there has been a paradigm shift toward definitions with a structural, rather than functional, emphasis, especially in light of structure–function discordance and the stage of disease known as ‘pre‐perimetric glaucoma’ (Figure 6A).Citation2014
Figure 6. A: Cross‐sectional and B: progression data acquired using Cirrus HD‐OCT (optical coherence tomography) in a case of pre‐perimetric glaucoma. Abbreviations: as with Figures 1; HFA, Humphrey visual field analyser; RNFL, retinal nerve fibre layer; TSNIT, temporal superior nasal inferior temporal.
Using OCT signs in glaucoma for clinical management
There are now several useful markers for identifying glaucomatous change in OCT results. Most commonly, optic nerve head parameters (such as the disc and rim area, cup‐to‐disc ratio, or cup volume), retinal nerve fibre layer thickness values or ganglion cell layer thickness at the macula are compared against normative data using algorithms inbuilt to each device. The clinician then uses those findings to guide their clinical decision making. Asymmetry in structural findings on OCT is another key marker of early stage disease. Characteristic structural defects in glaucoma include ‘wedge’‐like and ‘arcuate’‐like retinal nerve fibre layer defects that mimic and correspond with visual field loss, especially those in ‘classically’ affected anatomical areas (Figure 6A, B).Citation2012 These characteristic OCT structural changes are assumed to be surrogate measurements of the anatomical changes that underpin glaucoma. However, this has been challenged by studies examining the pathophysiology of glaucoma describing cellular changes of the retinal ganglion cells which may not be adequately captured by conventional OCT instruments which measure the optical properties to infer thickness values.Citation2013
One of the key advantages of OCT is the quantification of structural information, which is invaluable for longitudinal analysis.Citation2012 As glaucoma is typically progressive, and since progression rate is critical for treatment titration,Citation2013 this information is useful for guiding management decisions (Figure 6B). Longitudinal analysis is also dependent upon the fidelity of the measurement: in this case, this includes correct registration of the scan to account for subtle differences in optic nerve head position between visits and scans.Citation2011 With advancing disease, this registration may become difficult due to the loss of neuronal tissue and the neuroretinal rim at the optic nerve head.Citation2016
Non‐traditional indicators of glaucoma using OCT
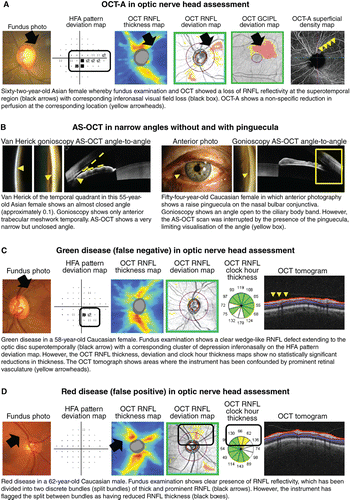
Ocular perfusion (both at the optic disc and peripapillary retina) may be visualised and measured using OCT‐A. The technology has recently garnered significant interest,Citation2015 because alteration in vascular perfusion has also been suggested as a potential pathway to glaucoma.Citation2013 However, the technique has met with limited success due to the significant overlap between normal and glaucoma subjects and the non‐specificity of disease signs (Figure 7A).Citation2016
Figure 7. A: Optical coherence tomography angiography (OCT‐A) for evaluating anomalies in vascular perfusion, and B: anterior segment (AS) OCT for adjunctive assessment of the angle. C, D: Examples of glaucoma‐related green and red disease (false negatives and false positives), respectively. Abbreviations: as with Figures 1; GCIPL, ganglion cell inner plexiform layer.
Another opportunity presented by OCT is that it makes some clinically ‘invisible’ structures visible. Two examples are the delineation of the anatomically true disc marginCitation2018 and the lamina cribrosa using a volume scan approach.Citation2013 Given the importance of optic disc size on describing optic nerve head parameters relevant for glaucoma,Citation2002 accurate delineation of the disc margin is critical to clinical decision making.Citation2013 The lamina cribrosa has also been hypothesised to play a role in the pathogenesis of the disease.Citation2015 New, high‐resolution OCT has been able to visualise the lamina cribrosa, describing parameters such as pore size and deformity.Citation2012 The significance of both of these parameters is still not fully known, but provides an exciting area for future study.
Aside from the optic nerve head, OCT is also used for assessment of the anterior segment.Citation2014 Anterior segment OCT has shown promise in identifying abnormalities in key features within the anterior chamber angle by highlighting eyes that can develop angle closure and glaucoma, particularly in high‐risk populations (Figure 7B).Citation2014 However, there remains a significant number of limitations in anterior segment OCT, including resolution, feature identification, obstructing structures and static viewing, for example, in comparison to methods such as ultrasound biomicroscopy and gonioscopy.Citation2011 Therefore, similar to examination of the posterior segment, anterior segment OCT remains an adjunct to gonioscopy, the current gold standard of anterior chamber angle assessment.Citation2013
OCT therefore appears to be an attractive option for visualising structural changes in a rapid manner, reinforced by recent studies that have provided precise visualisation of structural loss preceding significant visual field defects.Citation2013 It is not surprising that OCT has become indispensible for clinical glaucoma assessment, especially when its speed, precision and relative objectivity contrasts so heavily with the arduous, subjective and variable task of automated perimetry.Citation2014
Limitations of OCT imaging in glaucoma
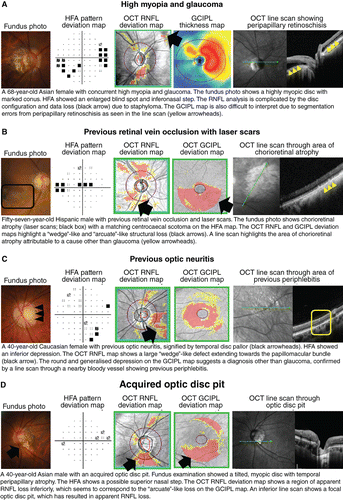
Given these advantages, is there still a place for tests aside from OCT for assessing glaucomatous damage? As mentioned already, there are a number of key limitations with using OCT imaging in glaucoma. OCT artefacts in glaucoma assessmentCitation2014 may contribute to the manifestation of red‐green disease (for example, Figure 7C, D),Citation2012 as determination of the statistical significance of structural loss is contingent upon the underlying normative database.Citation2014 This is particularly relevant in cases of patient demographics that are not well‐represented by the normative database (for example, high myopia; Figure 8A). There has been interest in developing normative data for these demographics but there remain challenges associated with the determination of normality in such patients.Citation2015
Figure 8. Case images illustrating the usefulness of optical coherence tomography (OCT) for differential diagnoses relating to glaucoma, including A: high myopia, B: retinal vascular occlusions, C: optic neuritis, and D: acquired optic disc pit. Abbreviations: as with Figures 1.
Another critical limitation of OCT is the instrument measurement floor in advanced disease.Citation2007 Remaining non‐neuronal cells or retinal vasculature produce a resultant thickness measurement that is not indicative of actual neuronal change relevant in glaucoma.Citation2016 In such cases, visual field results may be more reliable and informative. This has given rise to the idea of different utility of OCT and visual fields in different stages of glaucoma.Citation2012 More recent studies have clarified the discordance in early glaucoma by using different perimetric stimuli.Citation2018 However, the issue with current OCT results providing only limited dimensional information of optic nerve head structure remains. This is an inherent limitation of an optical impression of ocular structure that does not truly represent the underlying anatomy.
Unlike in AMD and DR, OCT imaging of treatment‐naïve eyes with glaucoma does not necessarily yield ‘classic’ signs, and instead displays significant overlap with other disorders affecting the optic nerve head, such as retinal vascular occlusions and ischaemic optic neuropathies (Figure 8B–D).Citation2017 This further reinforces the idea of glaucoma as a disease of statistical abnormality (for example, statistically depressed visual field or OCT results).Citation2007 As alluded to above, other optic nerve head appearances or variations may mimic glaucomatous damage, and provide a false impression of pathological changes that may be better assessed using alternative clinical techniques (for example, tilted disc syndrome or myopic optic discs).Citation2017 OCT in isolation, therefore, does not clearly provide a conclusive diagnosis of glaucoma.
Key points
There exist a number of useful OCT markers for diagnosing glaucoma, particularly in early stages, including structural asymmetry, characteristic ‘wedge’‐like and ‘arcuate’‐like defects, and change over time.
The measurement of optic disc and peripapillary perfusion using OCT‐A, structural OCT imaging of the lamina cribrosa, and anterior segment OCT applied for visualisation of the anterior chamber angle may be helpful in separating eyes with glaucoma from suspects.
Limitations: Glaucoma is a disease of statistical abnormality and thus, OCT in isolation cannot provide a conclusive diagnosis of glaucoma. The usefulness of OCT in advanced glaucoma is limited by the instrument measurement floor.
Future directions
Like retinal photography before it, OCT is now set to become a mainstay of primary eye care in developed nations. Already we are seeing the relegation of scan acquisition to non‐specialised personnel and injudicious use of the technology for disease screening rather than diagnostic purposes. Described thus far, there may be an immediate practical benefit to the identification of high‐risk AMD cases if the specific OCT signs are carefully predetermined and identified. Similarly, the diagnosis of early DMO using OCT may provide a stimulus for improved glycaemic control, thus imparting other benefits with regard to other systemic complications of diabetes, as well as prompting early referral to an ophthalmologist for closer monitoring. In glaucoma, an ideal screening test has remained elusive, but OCT purportedly offers several advantages over previously suggested screening methods such as intraocular pressure, cup‐disc ratio and screening visual field paradigms.Citation2004 But results for the use of OCT as a screening device in glaucoma have been mixed.Citation2018 As described above, there are no clear diagnostic ‘signs’ of glaucoma identifiable using OCT. Screening protocols are also contingent upon normative comparisons, which in turn are dependent upon a reference standard.
A corollary question is whether screening with OCT is analogous to lead‐time bias in diseases such as cancer, that is, is there a benefit in early case identification where the outcome may actually be the same?Citation2013 Major clinical trials have highlighted the benefits of treatment in early glaucoma,Citation2002 but these have not necessarily used or reported imaging technologies such as OCT in the case identification process. Several recent studiesCitation2014 have highlighted the benefits of treating pre‐perimetric glaucoma, but these again have focused on traditional methods of structural examination, for example, fundus photography. Integration of OCT into such clinical trials would be further informative, specifically for determining its suitability as a potential endpoint. Thus, while OCT is a powerful technique for visualising structures in ocular disease and shows great promise as a potential screening tool in primary care settings,Citation2014 there are a significant number of limitations that relegate it to an adjunctive tool. From a pool of 10,000 patients and assuming a glaucoma prevalence of 3.4 per cent, 340 will have glaucoma. Assuming 80 per cent sensitivity and 95 per cent specificity (the average across four studies),Citation2018 272 cases and 9,177 normal patients will be correctly identified. Yet, 483 normal patients will be falsely identified as glaucoma and 68 cases with glaucoma will be missed. Hence, screening for ocular disease using OCT alone is not recommended and the interpretation of OCT needs to be performed in conjunction with other clinical data (for example, in glaucoma, stereoscopic optic nerve head, fundus photography, intraocular pressure, visual fields, gonioscopy, pachymetry et cetera).
OCT as a diagnostic rather than a screening tool
The sensitivity for neovascular AMD and DMO may be higher than in glaucoma but is similarly not infallible. When using OCT alone and without knowing what to look for, neovascular AMD may be difficult to distinguish from other presentations, such as subretinal fibrosis, acquired vitelliform lesions or sub‐RPE haemorrhage, such as arising from polypoidal choroidal vasculopathy. Macular oedema and retinal nerve fibre layer loss can also arise from several causes, not just DR or glaucoma. A multimodal, evidence‐based imaging approach is therefore more informative and minimises the likelihood of diagnostic error. Although time‐consuming, numerous automated and semi‐automated strategies are evolving to make this process easier and more accessible in routine clinical practice (Figure 9).Citation2018
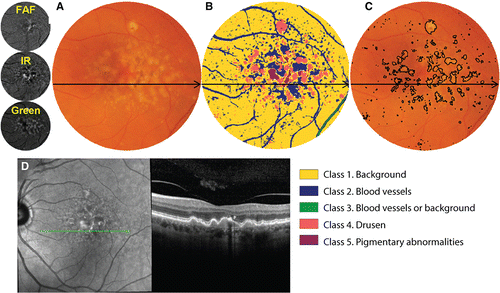
Figure 9. Demonstrative example of a semi‐automated strategy for integrating results of multiple imaging modalities. In this instance, a computational approach (unsupervised clustering) has been applied to the combination of infrared, autofluorescence and green scanning laser ophthalmoscopy findings to classify lesions in age‐related macular degeneration (AMD).Citation2018 A: Colour fundus photograph, cropped and masked to include the macular area only and B: corresponding classified image using this ‘pattern recognition approach’. Each distinct colour corresponds to a specific anatomical structure, as indicated by the figure legend. C: The class corresponding to drusen may then be outlined as a reflection of overall drusen load, which is an established risk factor for progression in AMD. D: Although colour fundus photography is the current standard of care in AMD grading, an additional optical coherence tomography (OCT) line scan has been provided to illustrate the drusen and pigmentary abnormalities. The same approach may also be applied for change analysis, that is for the surveillance of drusen load over time.Citation2018 FAF, fundus autofluorescence; IR, infrared.
Machine learning in conjunction with OCT and other clinical data have been posited as a potential means to address challenges in chronic disease eye care, such as increasing prevalence, under‐diagnosis and workforce consumption.Citation2010 Intriguingly, machine and deep learning can provide a method for the interpretation of OCT by rapidly analysing aspects of the scan beyond that typically examined by human clinicians, such as volumetric A‐scan data. Deep learning algorithms are already able to automatically identify intra‐retinal and subretinal fluid.Citation2018 Given the importance of these signs, we are likely to see automated detection techniques incorporated to enhance the functionality of existing OCT devices in the near future. Automatic interpretation of OCT results and their combination with other aspects of the clinical examination provides another potential test in chronic eye disease.Citation2018 Could screening with OCT alongside at least fundus photography therefore provide a means to address the problem of under‐diagnosis while simultaneously reducing the manpower required to detect disease? One of the biggest factors contributing to resistance to this technology is the ‘black box’ nature of the algorithm: the method by which the machine ‘learns’ and ‘interprets’ the results to come up with the confidence of diagnosis is unknown.Citation2018 While human assessors are able to provide feedback regarding the decision‐making process, artificial intelligence systems may still be treated with some level of suspicion due to the number of hidden layers that underpin their decision‐making matrix. For the time being, clinicians using OCT should be able to apply the instrument judiciously and to translate their clinical observations into an appropriate management plan for the benefit of their patients.Citation2018 A number of resources are available to facilitate this translation, including printed education materials (https://centreforeyehealth.com.au/chairside‐references/).
Conclusion
It could be argued that we are at a cross‐roads regarding the use of OCT in clinical practice. It may be applied en masse, that is for the indiscriminate, opportunistic screening of all patients presenting for an eye examination, or alternatively in a more judicious, targeted manner as a supplementary, diagnostic procedure. The discourse above illustrates the myriad of signs and considerations in just three ocular conditions, AMD, DR and glaucoma, let alone the innumerable number of others that may present during routine primary care. Ultimately, our role as clinicians is to prevent or minimise vision‐related disability and improve vision‐related quality of life. The time taken to accurately interpret OCT, particularly the most recent iteration, OCT‐A, is not insignificant. Consequently, the time, costs, complexity and risks involved in applying OCT should be weighed carefully against the benefits. The decision of when to use OCT should and must be evidence‐based.
ACKNOWLEDGEMENTS
This work was supported, in part, by a grant from the National Health and Medical Research Council (NHMRC) of Australia (#1033224), Guide Dogs NSW/ACT is also a partner on the NHMRC grant and provided funding support for all the authors.
Additional information
Funding
REFERENCES
- Huang D, Swanson EA, Lin CP et al. Optical coherence tomography. Science 1991; 254: 1178–1181.
- Spaide RF, Fujimoto JG, Waheed NK et al. Optical coherence tomography angiography. Prog Retin Eye Res 2018; 64: 1–55.
- Ang M, Tan ACS, Cheung CMG et al. Optical coherence tomography angiography: a review of current and future clinical applications. Graefes Arch Clin Exp Ophthalmol 2018; 256: 237–245.
- Kiely PM, Slater J. Optometry Australia entry‐level competency standards for optometry 2014. Clin Exp Optom 2015; 98: 65–89.
- Spaide RF, Klancnik JM Jr et al. Retinal vascular layers imaged by fluorescein angiography and optical coherence tomography angiography. JAMA Ophthalmol 2015; 133: 45–50.
- Shah SU, Kaliki S, Shields CL et al. Enhanced depth imaging optical coherence tomography of choroidal nevus in 104 cases. Ophthalmology 2012; 119: 1066–1072.
- Lujan BJ, Roorda A, Knighton RW et al. Revealing Henle's fiber layer using spectral domain optical coherence tomography. Invest Ophthalmol Vis Sci 2011; 52: 1486–1492.
- Staurenghi G, Sadda S, Chakravarthy U et al. Proposed lexicon for anatomic landmarks in normal posterior segment spectral‐domain optical coherence tomography: the IN*OCT consensus. Ophthalmology 2014; 121: 1572–1578.
- Spaide RF, Curcio CA. Anatomical correlates to the bands seen in the outer retina by optical coherence tomography: literature review and model. Retina 2011; 31: 1609–1619.
- Jia Y, Bailey ST, Wilson DJ et al. Quantitative optical coherence tomography angiography of choroidal neovascularization in age‐related macular degeneration. Ophthalmology 2014; 121: 1435–1444.
- Schechet S, Hariprasad SM, Movahedan A et al. Use of optical coherence tomography angiography in masqueraders of wet age‐related macular degeneration and choroidal neovascularization. Ophthalmic Surg Lasers Imaging Retina 2018; 49: 80–85.
- Schneider EW, Fowler SC. Optical coherence tomography angiography in the management of age‐related macular degeneration. Curr Opin Ophthalmol 2018; 29: 217–225.
- Foreman J, Xie J, Keel S et al. Prevalence and causes of unilateral vision impairment and unilateral blindness in Australia: the National Eye Health Survey. JAMA Ophthalmol 2018; 136: 240–248.
- Ly A, Nivison‐smith L, Hennessy MP et al. Collaborative care of non‐urgent macular disease: a study of inter‐optometric referrals. Ophthalmic Physiol Opt 2016; 36: 632–642.
- Jamous KF, Kalloniatis M, Hennessy MP et al. Clinical model assisting with the collaborative care of glaucoma patients and suspects. Clin Experiment Ophthalmol 2015; 43: 308–319.
- Ferris FL 3rd, Wilkinson CP, Bird A et al. Clinical classification of age‐related macular degeneration. Ophthalmology 2013; 120: 844–851.
- Roquet W, Roudot‐thoraval F, Coscas G et al. Clinical features of drusenoid pigment epithelial detachment in age related macular degeneration. Br J Ophthalmol 2004; 88: 638–642.
- Christenbury JG, Folgar FA, O'connell RV et al. Progression of intermediate age‐related macular degeneration with proliferation and inner retinal migration of hyperreflective foci. Ophthalmology 2013; 120: 1038–1045.
- Folgar FA, Chow JH, Farsiu S et al. Spatial correlation between hyperpigmentary changes on color fundus photography and hyperreflective foci on SDOCT in intermediate AMD. Invest Ophthalmol Vis Sci 2012; 53: 4626–4633.
- Schuman SG, Koreishi AF, Farsiu S et al. Photoreceptor layer thinning over drusen in eyes with age‐related macular degeneration imaged in vivo with spectral‐domain optical coherence tomography. Ophthalmology 2009; 116: 488–496.e2.
- Michalewski J, Nawrocki J, Trebinska M et al. Spectral‐domain optical coherence tomography features preceding new‐onset neovascular membrane formation. Can J Ophthalmol 2014; 49: 339–344.
- Sadigh S, Cideciyan AV, Sumaroka A et al. Abnormal thickening as well as thinning of the photoreceptor layer in intermediate age‐related macular degeneration. Invest Ophthalmol Vis Sci 2013; 54: 1603–1612.
- Zweifel SA, Imamura Y, Spaide TC et al. Prevalence and significance of subretinal drusenoid deposits (reticular pseudodrusen) in age‐related macular degeneration. Ophthalmology 2010; 117: 1775–1781.
- Joachim N, Mitchell P, Rochtchina E et al. Incidence and progression of reticular drusen in age‐related macular degeneration: findings from an older Australian cohort. Ophthalmology 2014; 121: 917–925.
- Ly A, Yapp M, Nivison‐smith L et al. Developing prognostic biomarkers in intermediate age‐related macular degeneration: their clinical use in predicting progression. Clin Exp Optom 2018; 101: 172–181.
- Fan W, Abdelfattah NS, Uji A et al. Subfoveal choroidal thickness predicts macular atrophy in age‐related macular degeneration: results from the TREX‐AMD trial. Graefes Arch Clin Exp Ophthalmol 2018; 256: 511–518.
- Lauermann JL, Eter N, Alten F. Optical coherence tomography angiography offers new insights into Choriocapillaris perfusion. Ophthalmologica 2018; 239: 74–84.
- Roisman L, Goldhardt R. OCT angiography: an upcoming non‐invasive tool for diagnosis of age‐related macular degeneration. Curr Ophthalmol Rep 2017; 5: 136–140.
- Sadda SR, Guymer R, Holz FG et al. Consensus definition for atrophy associated with age‐related macular degeneration on OCT: classification of atrophy report 3. Ophthalmology 2018; 125: 537–548.
- Brar M, Kozak I, Cheng L et al. Correlation between spectral‐domain optical coherence tomography and fundus autofluorescence at the margins of geographic atrophy. Am J Ophthalmol 2009; 148: 439–444.
- Ravera V, Giani A, Pellegrini M et al. Comparison among different diagnostic methods in the study of type and activity of choroidal neovascular membranes in age‐related macular degeneration. Retina 2017; https://doi.org/10.1097/iae.0000000000001960.
- Wilde C, Patel M, Lakshmanan A et al. The diagnostic accuracy of spectral‐domain optical coherence tomography for neovascular age‐related macular degeneration: a comparison with fundus fluorescein angiography. Eye 2015; 29: 603–609.
- Fang PP, Domdei N, Herrmann P et al. Minimal optical coherence tomogrpahy B‐scan density for reliable detection of intraretinal and subretinal fluid in macular diseases. Retina 2017; https://doi.org/10.1097/iae.0000000000001918.
- De niro JE, Mcdonald HR, Johnson RN et al. Sensitivity of fluid detection in patients with neovascular AMD using spectral domain optical coherence tomography high‐definition line scans. Retina 2014; 34: 1163–1166.
- Major JC Jr, Wykoff CC, Mariani AF et al. Comparison of spectral‐domain and time‐domain optical coherence tomography in the detection of neovascular age‐related macular degeneration activity. Retina 2014; 34: 48–54.
- Sikorski BL, Bukowska D, Kaluzny JJ et al. Drusen with accompanying fluid underneath the sensory retina. Ophthalmology 2011; 118: 82–92.
- Kozak I, Morrison VL, Clark TM et al. Discrepancy between fluorescein angiography and optical coherence tomography in detection of macular disease. Retina 2008; 28: 538–544.
- Curcio CA, Medeiros NE, Millican CL. Photoreceptor loss in age‐related macular degeneration. Invest Ophthalmol Vis Sci 1996; 37: 1236–1249.
- Schaal KB, Freund KB, Litts KM et al. Outer retinal tubulation in advanced age‐related macular degeneration: optical coherence tomographic findings correspond to histology. Retina 2015; 35: 1339–1350.
- Querques G, Srour M, Massamba N et al. Functional characterization and multimodal imaging of treatment‐naive "quiescent" choroidal neovascularization. Invest Ophthalmol Vis Sci 2013; 54: 6886–6892.
- Carnevali A, Cicinelli MV, Capuano V et al. Optical coherence tomography angiography: a useful tool for diagnosis of treatment‐naive quiescent choroidal neovascularization. Am J Ophthalmol 2016; 169: 189–198.
- Capuano V, Miere A, Querques L et al. Treatment‐naive quiescent choroidal neovascularization in geographic atrophy secondary to nonexudative age‐related macular degeneration. Am J Ophthalmol 2017; 182: 45–55.
- American Academy of Ophthalmology Retina/Vitreous Panel. Preferred Practice Pattern® Guidelines. Age‐Related Macular Degeneration. American Academy of Ophthalmology, San Francisco, CA, 2015.
- The Royal College of Ophthalmologists. Age‐Related Macular Degeneration: Guidelines for Management. The Royal College of Ophthalmologists, London, 2013.
- Smith RT, Sohrab MA, Busuioc M et al. Reticular macular disease. Am J Ophthalmol 2009; 148: 733–743.e2.
- Kim M, Lee SJ, Han J et al. Segmentation error and macular thickness measurements obtained with spectral‐domain optical coherence tomography devices in neovascular age‐related macular degeneration. Indian J Ophthalmol 2013; 61: 213–217.
- Song Y, Lee BR, Shin YW et al. Overcoming segmentation errors in measurements of macular thickness made by spectral‐domain optical coherence tomography. Retina 2012; 32: 569–580.
- Malamos P, Ahlers C, Mylonas G et al. Evaluation of segmentation procedures using spectral domain optical coherence tomography in exudative age‐related macular degeneration. Retina 2011; 31: 453–463.
- Hanumunthadu D, Ilginis T, Balaggan KS et al. Agreement of swept‐source and spectral‐domain optical coherence‐tomography retinal thickness measurements in neovascular age‐related macular degeneration. Clin Ophthalmol 2017; 11: 2121–2123.
- Schlanitz FG, Baumann B, Kundi M et al. Drusen volume development over time and its relevance to the course of age‐related macular degeneration. Br J Ophthalmol 2017; 101: 198–203.
- Folgar FA, Yuan EL, Sevilla MB et al. Drusen volume and retinal pigment epithelium abnormal thinning volume predict 2‐year progression of age‐related macular degeneration. Ophthalmology 2016; 123: 39–50.e1.
- Abdelfattah NS, Zhang H, Boyer DS et al. Drusen volume as a predictor of disease progression in patients with late age‐related macular degeneration in the fellow eye. Invest Ophthalmol Vis Sci 2016; 57: 1839–1846.
- Toy BC, Krishnadev N, Indaram M et al. Drusen regression is associated with local changes in fundus autofluorescence in intermediate age‐related macular degeneration. Am J Ophthalmol 2013; 156: 532–542.e1.
- Spaide RF, Curcio CA. Drusen characterization with multimodal imaging. Retina 2010; 30: 1441–1454.
- Wu Z, Luu CD, Ayton LN et al. Fundus autofluorescence characteristics of nascent geographic atrophy in age‐related macular degeneration. Invest Ophthalmol Vis Sci 2015; 56: 1546–1552.
- Schaal KB, Gregori G, Rosenfeld PJ. En face optical coherence tomography imaging for the detection of nascent geographic atrophy. Am J Ophthalmol 2017; 174: 145–154.
- Early Treatment Diabetic Retinopathy Study Research Group. Grading diabetic retinopathy from stereoscopic color fundus photographs‐‐an extension of the modified Airlie House classification. ETDRS report number 10. Ophthalmology 1991; 98: 786–806.
- Wilkinson CP, Ferris FL 3rd, Klein RE et al. Proposed international clinical diabetic retinopathy and diabetic macular edema disease severity scales. Ophthalmology 2003; 110: 1677–1682.
- Horii T, Murakami T, Nishijima K et al. Optical coherence tomographic characteristics of microaneurysms in diabetic retinopathy. Am J Ophthalmol 2010; 150: 840–848.
- Parravano M, De geronimo D, Scarinci F et al. Diabetic microaneurysms internal reflectivity on spectral‐domain optical coherence tomography and optical coherence tomography angiography detection. Am J Ophthalmol 2017; 179: 90–96.
- Couturier A, Mane V, Bonnin S et al. Capillary plexus anomalies in diabetic retinopathy on optical coherence tomography angiography. Retina 2015; 35: 2384–2391.
- Hamada M, Ohkoshi K, Inagaki K et al. Visualization of microaneurysms using optical coherence tomography angiography: comparison of OCT‐A en face, OCT B‐scan, OCT en face, FA, and IA images. Jpn J Ophthalmol 2018; 62: 168–175.
- Helmy YM, Atta allah HR. Optical coherence tomography classification of diabetic cystoid macular edema. Clin Ophthalmol 2013; 7: 1731–1737.
- Otani T, Kishi S, Maruyama Y. Patterns of diabetic macular edema with optical coherence tomography. Am J Ophthalmol 1999; 127: 688–693.
- Matsunaga DR, Yi JJ, De koo LO et al. Optical coherence tomography angiography of diabetic retinopathy in human subjects. Ophthalmic Surg Lasers Imaging Retina 2015; 46: 796–805.
- Wong TY, Sun J, Kawasaki R et al. Guidelines on diabetic eye care: the International Council of Ophthalmology Recommendations for screening, follow‐up, referral, and treatment based on resource settings. Ophthalmology 2018; 125: 1608–1622.
- Bolz M, Lammer J, Deak G et al. SAVE: a grading protocol for clinically significant diabetic macular oedema based on optical coherence tomography and fluorescein angiography. Br J Ophthalmol 2014; 98: 1612–1617.
- Panozzo G, Parolini B, Gusson E et al. Diabetic macular edema: an OCT‐based classification. Semin Ophthalmol 2004; 19: 13–20.
- Kang SW, Park CY, Ham DI. The correlation between fluorescein angiographic and optical coherence tomographic features in clinically significant diabetic macular edema. Am J Ophthalmol 2004; 137: 313–322.
- Diabetic Retinopathy Clinical Research Network, Bressler NM, Miller KM et al. Observational study of subclinical diabetic macular edema. Eye 2012; 26: 833–840.
- Vujosevic S, Varano M, Egan C et al. Relevance of retinal thickness changes in the OCT inner and outer rings to predict progression to clinical macular edema: an attempt of composite grading of macular edema. Ophthalmic Res 2015; 55: 19–25.
- Chalam KV, Bressler SB, Edwards AR et al. Retinal thickness in people with diabetes and minimal or no diabetic retinopathy: Heidelberg Spectralis optical coherence tomography. Invest Ophthalmol Vis Sci 2012; 53: 8154–8161.
- Hwang TS, Jia Y, Gao SS et al. Optical coherence tomography angiography features of diabetic retinopathy. Retina 2015; 35: 2371–2376.
- Vaz‐pereira S, Dansingani KK, Chen KC et al. Tomographic relationships between retinal neovascularization and the posterior vitreous in proliferative diabetic retinopathy. Retina 2017; 37: 1287–1296.
- Lupidi M, Fiore T, Cerquaglia A et al. Depth‐resolved imaging of papillary vitreoretinal neovascularization: OCT‐angiography assessment in ocular ischemic syndrome. Retina 2017; 37: e42–e44.
- Akiyama H, Li D, Shimoda Y et al. Observation of neovascularization of the disc associated with proliferative diabetic retinopathy using OCT angiography. Jpn J Ophthalmol 2018; 62: 286–291.
- Sambhav K, Grover S, Chalam KV. The application of optical coherence tomography angiography in retinal diseases. Surv Ophthalmol 2017; 62: 838–866.
- Krawitz BD, Mo S, Geyman LS et al. Acircularity index and axis ratio of the foveal avascular zone in diabetic eyes and healthy controls measured by optical coherence tomography angiography. Vision Res 2017; 139: 177–186.
- Bathija R, Gupta N, Zangwill L et al. Changing definition of glaucoma. J Glaucoma 1998; 7: 165–169.
- Casson RJ, Chidlow G, Wood JP et al. Definition of glaucoma: clinical and experimental concepts. Clin Experiment Ophthalmol 2012; 40: 341–349.
- Weinreb RN, Khaw PT. Primary open‐angle glaucoma. Lancet 2004; 363: 1711–1720.
- National Collaborating Centre for Acute Care (UK). Glaucoma: Diagnosis and Management of Chronic Open Angle Glaucoma and Ocular Hypertension. National Collaborating Centre for Acute Care, London, 2009.
- NHMRC. Guidelines for the Screening, Prognosis, Diagnosis, Management and Prevention of Glaucoma. Commonwealth of Australia, Canberra, 2010.
- Prum BE Jr, Lim MC, Mansberger SL et al. Primary open‐angle glaucoma suspect preferred practice pattern® guidelines. Ophthalmology 2016; 123: P112–P151.
- Prum BE Jr, Rosenberg LF, Gedde SJ et al. Primary open‐angle glaucoma preferred practice pattern® guidelines. Ophthalmology 2016; 123: P41–P111.
- Sommer A, Katz J, Quigley HA et al. Clinically detectable nerve fiber atrophy precedes the onset of glaucomatous field loss. Arch Ophthalmol 1991; 109: 77–83.
- Sommer A, Miller NR, Pollack I et al. The nerve fiber layer in the diagnosis of glaucoma. Arch Ophthalmol 1977; 95: 2149–2156.
- Jeong JH, Park KH, Jeoung JW et al. Preperimetric normal tension glaucoma study: long‐term clinical course and effect of therapeutic lowering of intraocular pressure. Acta Ophthalmol 2014; 92: e185–e193.
- Kim KE, Jeoung JW, Kim DM et al. Long‐term follow‐up in preperimetric open‐angle glaucoma: progression rates and associated factors. Am J Ophthalmol 2015; 159: 160–168.e1–2.
- Sawada A, Manabe Y, Yamamoto T et al. Long‐term clinical course of normotensive preperimetric glaucoma. Br J Ophthalmol 2017; 101: 1649–1653.
- Leung CK, Yu M, Weinreb RN et al. Retinal nerve fiber layer imaging with spectral‐domain optical coherence tomography: patterns of retinal nerve fiber layer progression. Ophthalmology 2012; 119: 1858–1866.
- Leung CK, Lam S, Weinreb RN et al. Retinal nerve fiber layer imaging with spectral‐domain optical coherence tomography: analysis of the retinal nerve fiber layer map for glaucoma detection. Ophthalmology 2010; 117: 1684–1691.
- Hood DC, Slobodnick A, Raza AS et al. Early glaucoma involves both deep local, and shallow widespread, retinal nerve fiber damage of the macular region. Invest Ophthalmol Vis Sci 2014; 55: 632–649.
- Hood DC, Wang DL, Raza AS et al. The locations of circumpapillary glaucomatous defects seen on frequency‐domain OCT scans. Invest Ophthalmol Vis Sci 2013; 54: 7338–7343.
- Leung CK, Choi N, Weinreb RN et al. Retinal nerve fiber layer imaging with spectral‐domain optical coherence tomography: pattern of RNFL defects in glaucoma. Ophthalmology 2010; 117: 2337–2344.
- Hwang YH, Kim YY. Glaucoma diagnostic ability of quadrant and clock‐hour neuroretinal rim assessment using cirrus HD optical coherence tomography. Invest Ophthalmol Vis Sci 2012; 53: 2226–2234.
- Fortune B, Reynaud J, Wang L et al. Does optic nerve head surface topography change prior to loss of retinal nerve fiber layer thickness: a test of the site of injury hypothesis in experimental glaucoma. PLoS One 2013; 8: e77831.
- Fortune B, Burgoyne CF, Cull G et al. Onset and progression of peripapillary retinal nerve fiber layer (RNFL) retardance changes occur earlier than RNFL thickness changes in experimental glaucoma. Invest Ophthalmol Vis Sci 2013; 54: 5653–5661.
- Fortune B, Burgoyne CF, Cull GA et al. Structural and functional abnormalities of retinal ganglion cells measured in vivo at the onset of optic nerve head surface change in experimental glaucoma. Invest Ophthalmol Vis Sci 2012; 53: 3939–3950.
- Wessel JM, Horn FK, Tornow RP et al. Longitudinal analysis of progression in glaucoma using spectral‐domain optical coherence tomography. Invest Ophthalmol Vis Sci 2013; 54: 3613–3620.
- Yu M, Lin C, Weinreb RN et al. Risk of visual field progression in glaucoma patients with progressive retinal nerve fiber layer thinning: a 5‐year prospective study. Ophthalmology 2016; 123: 1201–1210.
- Heijl A, Buchholz P, Norrgren G et al. Rates of visual field progression in clinical glaucoma care. Acta Ophthalmol 2013; 91: 406–412.
- De moraes CG, Liebmann JM, Park SC et al. Optic disc progression and rates of visual field change in treated glaucoma. Acta Ophthalmol 2013; 91: e86–e91.
- Zhu H, Crabb DP, Schlottmann PG et al. Aligning scan acquisition circles in optical coherence tomography images of the retinal nerve fibre layer. IEEE Trans Med Imaging 2011; 30: 1228–1238.
- Ye C, Yu M, Leung CK. Impact of segmentation errors and retinal blood vessels on retinal nerve fibre layer measurements using spectral‐domain optical coherence tomography. Acta Ophthalmol 2016; 94: e211–e219.
- Wang X, Jiang C, Ko T et al. Correlation between optic disc perfusion and glaucomatous severity in patients with open‐angle glaucoma: an optical coherence tomography angiography study. Graefes Arch Clin Exp Ophthalmol 2015; 253: 1557–1564.
- Jia Y, Wei E, Wang X et al. Optical coherence tomography angiography of optic disc perfusion in glaucoma. Ophthalmology 2014; 121: 1322–1332.
- Mozaffarieh M, Flammer J. New insights in the pathogenesis and treatment of normal tension glaucoma. Curr Opin Pharmacol 2013; 13: 43–49.
- Flammer J, Haefliger IO, Orgul S et al. Vascular dysregulation: a principal risk factor for glaucomatous damage? J Glaucoma 1999; 8: 212–219.
- Quigley HA. Neuronal death in glaucoma. Prog Retin Eye Res 1999; 18: 39–57.
- Rao HL, Pradhan ZS, Weinreb RN et al. Regional comparisons of optical coherence tomography angiography vessel density in primary open‐angle glaucoma. Am J Ophthalmol 2016; 171: 75–83.
- Rao HL, Pradhan ZS, Weinreb RN et al. A comparison of the diagnostic ability of vessel density and structural measurements of optical coherence tomography in primary open angle glaucoma. PLoS One 2017; 12: e0173930.
- Chung JK, Hwang YH, Wi JM et al. Glaucoma diagnostic ability of the optical coherence tomography angiography vessel density parameters. Curr Eye Res 2017; 42: 1458–1467.
- Yapp M, Rennie G, Hennessy MP et al. The impact of optic nerve and related characteristics on disc area measurements derived from different imaging techniques. PLoS One 2018; 13: e0190273.
- Iverson SM, Sehi M. The comparison of manual vs automated disc margin delineation using spectral‐domain optical coherence tomography. Eye 2013; 27: 1180–1187.
- Kim TW, Kagemann L, Girard MJ et al. Imaging of the lamina cribrosa in glaucoma: perspectives of pathogenesis and clinical applications. Curr Eye Res 2013; 38: 903–909.
- Wang B, Nevins JE, Nadler Z et al. In vivo lamina cribrosa micro‐architecture in healthy and glaucomatous eyes as assessed by optical coherence tomography. Invest Ophthalmol Vis Sci 2013; 54: 8270–8274.
- Spaeth GL, Henderer J, Liu C et al. The disc damage likelihood scale: reproducibility of a new method of estimating the amount of optic nerve damage caused by glaucoma. Trans Am Ophthalmol Soc 2002; 100: 181–185.
- Chauhan BC, O'leary N, Almobarak FA et al. Enhanced detection of open‐angle glaucoma with an anatomically accurate optical coherence tomography‐derived neuroretinal rim parameter. Ophthalmology 2013; 120: 535–543.
- Reis AS, O'leary N, Yang H et al. Influence of clinically invisible, but optical coherence tomography detected, optic disc margin anatomy on neuroretinal rim evaluation. Invest Ophthalmol Vis Sci 2012; 53: 1852–1860.
- Reis AS, Sharpe GP, Yang H et al. Optic disc margin anatomy in patients with glaucoma and normal controls with spectral domain optical coherence tomography. Ophthalmology 2012; 119: 738–747.
- Quigley HA. The contribution of the sclera and lamina cribrosa to the pathogenesis of glaucoma: diagnostic and treatment implications. Prog Brain Res 2015; 220: 59–86.
- Park SC, De moraes CG, Teng CC et al. Enhanced depth imaging optical coherence tomography of deep optic nerve complex structures in glaucoma. Ophthalmology 2012; 119: 3–9.
- Sharma R, Sharma A, Arora T et al. Application of anterior segment optical coherence tomography in glaucoma. Surv Ophthalmol 2014; 59: 311–327.
- Porporato N, Baskaran M, Aung T. Role of anterior segment optical coherence tomography in angle‐closure disease: a review. Clin Experiment Ophthalmol 2018; 46: 147–157.
- Masoodi H, Jafarzadehpur E, Esmaeili A et al. Evaluation of anterior chamber angle under dark and light conditions in angle closure glaucoma: an anterior segment OCT study. Cont Lens Anterior Eye 2014; 37: 300–304.
- Sakata LM, Lavanya R, Friedman DS et al. Comparison of gonioscopy and anterior segment ocular coherence tomography in detecting angle closure in different quadrants of the anterior chamber angle. Ophthalmology 2008; 115: 769–774.
- Nolan WP, See JL, Chew PT et al. Detection of primary angle closure using anterior segment optical coherence tomography in Asian eyes. Ophthalmology 2007; 114: 33–39.
- Park SB, Sung KR, Kang SY et al. Assessment of narrow angles by gonioscopy, Van Herick method and anterior segment optical coherence tomography. Jpn J Ophthalmol 2011; 55: 343–350.
- Narayanaswamy A, Sakata LM, He MG et al. Diagnostic performance of anterior chamber angle measurements for detecting eyes with narrow angles: an anterior segment OCT study. Arch Ophthalmol 2010; 128: 1321–1327.
- Hu CX, Mantravadi A, Zangalli C et al. Comparing Gonioscopy with Visante and cirrus optical coherence tomography for anterior chamber angle assessment in glaucoma patients. J Glaucoma 2016; 25: 177–183.
- Quek DT, Narayanaswamy AK, Tun TA et al. Comparison of two spectral domain optical coherence tomography devices for angle‐closure assessment. Invest Ophthalmol Vis Sci 2012; 53: 5131–5136.
- Smith SD, Singh K, Lin SC et al. Evaluation of the anterior chamber angle in glaucoma: a report by the American Academy of Ophthalmology. Ophthalmology 2013; 120: 1985–1997.
- Lisboa R, Paranhos A Jr, Weinreb RN et al. Comparison of different spectral domain OCT scanning protocols for diagnosing preperimetric glaucoma. Invest Ophthalmol Vis Sci 2013; 54: 3417–3425.
- Lisboa R, Leite MT, Zangwill LM et al. Diagnosing preperimetric glaucoma with spectral domain optical coherence tomography. Ophthalmology 2012; 119: 2261–2269.
- Hua R, Gangwani R, Guo L et al. Detection of preperimetric glaucoma using Bruch membrane opening, neural canal and posterior pole asymmetry analysis of optical coherence tomography. Sci Rep 2016; 6: 21743.
- Glen FC, Baker H, Crabb DP. A qualitative investigation into patients' views on visual field testing for glaucoma monitoring. BMJ Open 2014; 4: e003996.
- Malik R, Baker H, Russell RA et al. A survey of attitudes of glaucoma subspecialists in England and Wales to visual field test intervals in relation to NICE guidelines. BMJ Open 2013; 3: e002067.
- Asrani S, Essaid L, Alder BD et al. Artifacts in spectral‐domain optical coherence tomography measurements in glaucoma. JAMA Ophthalmol 2014; 132: 396–402.
- Chong GT, Lee RK. Glaucoma versus red disease: imaging and glaucoma diagnosis. Curr Opin Ophthalmol 2012; 23: 79–88.
- Kim KE, Jeoung JW, Park KH et al. Diagnostic classification of macular ganglion cell and retinal nerve fiber layer analysis: differentiation of false‐positives from glaucoma. Ophthalmology 2015; 122: 502–510.
- Rho S, Sung Y, Kang T et al. Improvement of diagnostic performance regarding retinal nerve fiber layer defect using shifting of the normative database according to vessel position. Invest Ophthalmol Vis Sci 2014; 55: 5116–5124.
- Knight OJ, Girkin CA, Budenz DL et al. Effect of race, age, and axial length on optic nerve head parameters and retinal nerve fiber layer thickness measured by cirrus HD‐OCT. Arch Ophthalmol 2012; 130: 312–318.
- Nakanishi H, Akagi T, Hangai M et al. Sensitivity and specificity for detecting early glaucoma in eyes with high myopia from normative database of macular ganglion cell complex thickness obtained from normal non‐myopic or highly myopic Asian eyes. Graefes Arch Clin Exp Ophthalmol 2015; 253: 1143–1152.
- Hood DC, Kardon RH. A framework for comparing structural and functional measures of glaucomatous damage. Prog Retin Eye Res 2007; 26: 688–710.
- Mwanza JC, Kim HY, Budenz DL et al. Residual and dynamic range of retinal nerve fiber layer thickness in glaucoma: comparison of three OCT platforms. Invest Ophthalmol Vis Sci 2015; 56: 6344–6351.
- Bowd C, Zangwill LM, Weinreb RN et al. Estimating optical coherence tomography structural measurement floors to improve detection of progression in advanced glaucoma. Am J Ophthalmol 2017; 175: 37–44.
- Radius RL, Anderson DR. The histology of retinal nerve fiber layer bundles and bundle defects. Arch Ophthalmol 1979; 97: 948–950.
- Medeiros FA, Zangwill LM, Bowd C et al. The structure and function relationship in glaucoma: implications for detection of progression and measurement of rates of change. Invest Ophthalmol Vis Sci 2012; 53: 6939–6946.
- Rountree L, Mulholland PJ, Anderson RS et al. Optimising the glaucoma signal/noise ratio by mapping changes in spatial summation with area‐modulated perimetric stimuli. Sci Rep 2018; 8: 2172.
- Kalloniatis M, Khuu SK. Equating spatial summation in visual field testing reveals greater loss in optic nerve disease. Ophthalmic Physiol Opt 2016; 36: 439–452.
- Phu J, Khuu SK, Zangerl B et al. A comparison of Goldmann III, V and spatially equated test stimuli in visual field testing: the importance of complete and partial spatial summation. Ophthalmic Physiol Opt 2017; 37: 160–176.
- Phu J, Khuu SK, Bui BV et al. A method using Goldmann stimulus sizes I‐V measured sensitivities to predict lead‐time gained to visual field defect detection in early glaucoma. Trans Vis Sci Technol 2018; 7: 17.
- Zangerl B, Whatham A, Kim J et al. Reconciling visual field defects and retinal nerve fibre layer asymmetric patterns in retrograde degeneration: an extended case series. Clin Exp Optom 2017; 100: 214–226.
- Danesh‐meyer HV, Yap J, Frampton C et al. Differentiation of compressive from glaucomatous optic neuropathy with spectral‐domain optical coherence tomography. Ophthalmology 2014; 121: 1516–1523.
- Phu J, Khuu SK, Yapp M et al. The value of visual field testing in the era of advanced imaging: clinical and psychophysical perspectives. Clin Exp Optom 2017; 100: 313–332.
- Phu J, Wang H, Miao S et al. Neutralizing peripheral refraction eliminates refractive scotomata in tilted disk syndrome. Optom Vis Sci 2018; 95: 959–970.
- Detry‐morel M, Zeyen T, Kestelyn P et al. Screening for glaucoma in a general population with the non‐mydriatic fundus camera and the frequency doubling perimeter. Eur J Ophthalmol 2004; 14: 387–393.
- Francis BA, Varma R, Vigen C et al. Population and high‐risk group screening for glaucoma: the Los Angeles Latino Eye Study. Invest Ophthalmol Vis Sci 2011; 52: 6257–6264.
- Ong HS, Levin S, Vafidis G. Glaucoma detection using optic disc images from the English national screening programme for diabetic retinopathy. J Glaucoma 2013; 22: 496–500.
- Liu MM, Cho C, Jefferys JL et al. Use of optical coherence tomography by nonexpert personnel as a screening approach for glaucoma. J Glaucoma 2018; 27: 64–70.
- Nakano T, Hayashi T, Nakagawa T et al. Applicability of automatic spectral domain optical coherence tomography for glaucoma mass screening. Clin Ophthalmol 2017; 11: 97–103.
- Bengtsson B, Andersson S, Heijl A. Performance of time‐domain and spectral‐domain optical coherence tomography for glaucoma screening. Acta Ophthalmol 2012; 90: 310–315.
- Li G, Fansi AK, Boivin JF et al. Screening for glaucoma in high‐risk populations using optical coherence tomography. Ophthalmology 2010; 117: 453–461.
- Blumberg DM, Vaswani R, Nong E et al. A comparative effectiveness analysis of visual field outcomes after projected glaucoma screening using SD‐OCT in African American communities. Invest Ophthalmol Vis Sci 2014; 55: 3491–3500.
- Dabasia PL, Fidalgo BR, Edgar DF et al. Diagnostic accuracy of Technologies for Glaucoma Case‐Finding in a community setting. Ophthalmology 2015; 122: 2407–2415.
- Jansen RJ, Alexander BH, Anderson KE et al. Quantifying lead‐time bias in risk factor studies of cancer through simulation. Ann Epidemiol 2013; 23: 735–741.
- Cucchetti A, Trevisani F, Pecorelli A et al. Estimation of lead‐time bias and its impact on the outcome of surveillance for the early diagnosis of hepatocellular carcinoma. J Hepatol 2014; 61: 333–341.
- Heijl A, Leske MC, Bengtsson B et al. Reduction of intraocular pressure and glaucoma progression: results from the early manifest glaucoma trial. Arch Ophthalmol 2002; 120: 1268–1279.
- Garway‐heath DF, Crabb DP, Bunce C et al. Latanoprost for open‐angle glaucoma (UKGTS): a randomised, multicentre, placebo‐controlled trial. Lancet 2015; 385: 1295–1304.
- Musch DC, Gillespie BW, Lichter PR et al. Visual field progression in the collaborative initial glaucoma treatment study the impact of treatment and other baseline factors. Ophthalmology 2009; 116: 200–207.
- Krupin T, Liebmann JM, Greenfield DS et al. A randomized trial of brimonidine versus timolol in preserving visual function: results from the low‐pressure glaucoma treatment study. Am J Ophthalmol 2011; 151: 671–681.
- Shelton RL, Jung W, Sayegh SI et al. Optical coherence tomography for advanced screening in the primary care office. J Biophotonics 2014; 7: 525–533.
- Ly A, Nivison‐smith L, Assaad N et al. Multispectral pattern recognition reveals a diversity of clinical signs in intermediate age‐related macular degeneration. Invest Ophthalmol Vis Sci 2018; 59: 1790–1799.
- Bizios D, Heijl A, Hougaard JL et al. Machine learning classifiers for glaucoma diagnosis based on classification of retinal nerve fibre layer thickness parameters measured by stratus OCT. Acta Ophthalmol 2010; 88: 44–52.
- Burgansky‐eliash Z, Wollstein G, Chu T et al. Optical coherence tomography machine learning classifiers for glaucoma detection: a preliminary study. Invest Ophthalmol Vis Sci 2005; 46: 4147–4152.
- Kim SJ, Cho KJ, Oh S. Development of machine learning models for diagnosis of glaucoma. PLoS One 2017; 12: e0177726.
- Schlegl T, Waldstein SM, Bogunovic H et al. Fully automated detection and quantification of macular fluid in OCT using deep learning. Ophthalmology 2018; 125: 549–558.
- Bartnik SE, Copeland SP, Aicken AJ et al. Optometry‐facilitated teleophthalmology: an audit of the first year in Western Australia. Clin Exp Optom 2018; 101: 700–703.
- Strouthidis NG, Chandrasekharan G, Diamond JP et al. Teleglaucoma: ready to go? Br J Ophthalmol 2014; 98: 1605–1611.
- Rahimy E. Deep learning applications in ophthalmology. Curr Opin Ophthalmol 2018; 29: 254–260.
- Chartrand G, Cheng PM, Vorontsov E et al. Deep learning: a primer for radiologists. Radiographics 2017; 37: 2113–2131.
- Ly A, Nivison‐smith L, Zangerl B et al. Advanced imaging for the diagnosis of age‐related macular degeneration: a case vignettes study. Clin Exp Optom 2018; 101: 243–254.