Abstract
The effect of green revolution (GR) technology during the period 1970–2003 on changes in a number of chemical properties of sawah soils was studied in Java, Indonesia. The term sawah refers to a leveled and bounded rice fields with an inlet and an outlet for irrigation and drainage. Soil samples taken by Kawaguchi and Kyuma in 1970 and new samples from the same sites or close to the original sites were analyzed and compared. For the 40 sites examined, mean soil pH and exchangeable sodium (Na) decreased from 6.90 ± 0.77 to 5.84 ± 0.90 and from 3.28 ± 2.76 to 1.67 ± 2.06 kmolc ha−1, respectively; while the exchangeable acidity and available phosphorus (P) significantly increased from 9.32 ± 3.09 to 13.23 ± 3.72 kmolc ha−1 and from 136.62 ± 154.72 to 255.75 ± 292.41 kg P2O5 ha−1, respectively. There were no significant differences in exchangeable calcium (Ca), magnesium (Mg) and potassium (K) contents and in effective cation exchange capacity (eCEC) during this period. Differences in land management practices may have affected the trends recorded in soil chemical properties in seedfarms where rice has been planted continuously using high doses of chemical fertilizers and in non-seedfarms where farmers use rotation patterns with low fertilizer application. The mean values of soil pH, exchangeable acidity, exchangeable Na and available P in the 0–20 cm soil layer in seedfarms changed by −1.25, 4.11 kmolc ha−1, −1.42 kmolc ha−1 and 194 kg P2O5 ha−1, respectively; while in non-seedfarms these soil properties changed by −0.90, 3.26 kmolc ha−1, −1.77 kmolc ha−1 and 57 kg P2O5 ha−1, respectively. The mean value of exchangeable K in seedfarms remained at the same level as that recorded in 1970 because of a sufficient supply of KCl as a potassium fertilizer during the study period. In contrast, in non-seedfarms where K fertilizer was applied infrequently, exchangeable K decreased by −0.30 kmolc ha−1. In comparison with results from Bangladesh over a similar period, Bangladesh lost more exchangeable base cations than Java. Available P content decreased by approximately 10% in Bangladesh, whereas in Java it increased almost twofold.
INTRODUCTION
Numerous studies have examined green revolution (GR) technology and explored various dimensions of what is clearly a complex topic. There are studies examining the impact of GR technology on changes in cropping pattern, agricultural productivity, economic growth, food self-sufficiency, diversification in investment and employment, and on wages in many countries, but few studies have been conducted in Indonesia (CitationDas 2002). Since GR technology was introduced to Indonesia, mechanization has been unsuccessful because of an abundance of cheap labor. Through the use of high yielding varieties of rice (HYVs) and chemical fertilizers and pesticides, rice production has increased sharply from 1.8 to 4.5 Mg ha−1 (approximately 250%) from 1968 to 1998. Rice production in Indonesia is higher compared with the Philippines,
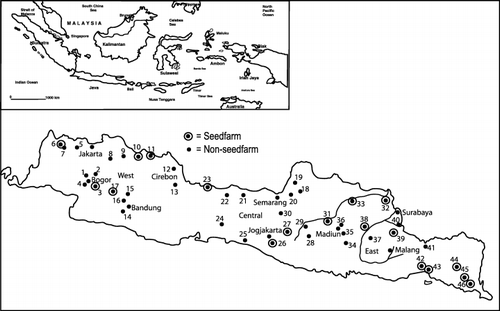
Figure 1 Map of Indonesia showing the location of Java Island and the distribution of the sampling sites in 1970 and 2003.
Although Indonesia is the most affected country by the application of GR technology among the Asian countries, there is little information about the effect of GR technology on changes in sawah soil properties in Indonesia. The term sawah refers to a leveled and bounded rice field with an inlet and an outlet for irrigation and drainage. As mentioned in a previous paper (CitationDarmawan et al. in press), Java was the first island to adopt GR technology because of a number of advantageous factors, such as climate condition, which appeared to be suitable for the intensive cultivation of rice (CitationKyuma 2004). The application of GR technology for more than three decades caused the accumulation of total carbon and nitrogen in the sawah soil and this was related to differences in land management practices in seedfarms and non-seedfarms, such as cultivation systems and the application rate of chemical fertilizers (CitationDarmawan et al. in press). In the present study, we discuss how GR technology affects sawah soil chemical properties other than carbon and nitrogen. For buffering of food security under government policy, seedfarms were planted with rice all year around in a monoculture system and chemical fertilizer was applied following the government recommendation (150 kg Urea [CO(NH2)2], 125 kg super-phosphate [Ca(H2PO4)2] and 100 kg potassium chloride (KCl) per hectare per cropping season) (CitationLansing et al. 2001). In contrast, non-seedfarms had cultivated rice and upland crops in rotation with low doses of fertilizers because of water and farmer budget limitations. The results of the present study will provide important information for the sustainable management of sawah soils in Indonesia in the future.
MATERIALS AND METHODS
Soil samples
Soil samples taken in 1970 by Kawaguchi and Kyuma were used as reference samples in this study. New samples were taken in 2003 from the same sites or from sites close to the 1970 sampling sites. shows the distribution of the sampling sites in 1970 and in 2003. Among 46 sampling sites in 1970, six were not sampled in 2003 because land use had changed during the 33 years since 1970. Therefore, soil samples were collected from 40 sites in 2003, 22 of these sites were located in non-seedfarms and the other 18 sites were in seedfarms.
Laboratory analyses
Chemical properties of soils
The air-dried soil samples were ground and passed through a 2-mm sieve. Soil pH was measured using the glass electrode method with a soil : water ratio of 1:2.5 (CitationIITA 1979; CitationMcLean 1982). Exchangeable acidity was determined by first extracting with 1 mol L−1 KCl and titrating with NaOH (CitationMcLean 1965). Exchangeable base cations (Ca, Mg, K and Na) were extracted using 1 mol L−1 neutral ammonium acetate (CitationThomas 1982) and exchangeable Ca and Mg were determined using Inductively Coupled Plasma-Atomic Emission Spectroscopy (Shimadzu ICPS 2000, Kyoto, Japan) and exchangeable K and Na were determined using an Atomic Absorption Spectrophotometer (Shimadzu AS 680). Effective cation exchange capacity (eCEC) represents the sum of the amount of exchangeable bases and the exchangeable acidity. Available P was extracted using the Bray 2 method and the content was determined by colorimetry with an UV/VIS Spectrophotometer (Jasco V-530, Tokyo, Japan) (CitationBray and Kurtz 1945).
Bulk density
The bulk density of samples taken in 2003 was used to convert the values of exchangeable acidity, exchangeable base cations and available P content from a weight to a volume basis. Bulk density data were presented in the previous paper (CitationDarmawan et al. in press).
Statistical analysis
SPSS version 11.0 for Windows was used to statistically examine the effect of GR on the changes in soil chemical properties during the period 1970–2003. The mean values for the samples taken in 1970 were compared with the 2003 samples by using the land management difference (seedfarms and non-seedfarms) as blocks and the results are presented in ,, in this paper. To examine the relationship among the soil properties, Pearson's coefficient correlation was calculated and the results presented in .
RESULTS AND DISCUSSION
Effects of green revolution technology on changes in the chemical properties of sawah soils
and show the effects of GR technology on changes in a number of chemical properties of sawah soils during the period 1970–2003 in Java. Changes in all properties examined varied greatly among the 40 sites. In general, soil pH and the contents of exchangeable acidity, available P and exchangeable Na were significantly different in both the 0–20 cm and 0–100 cm soil layers. In contrast, exchangeable K significantly changed only within the 0–100 cm soil layer. Effective cation exchange capacity (eCEC), exchangeable Ca and Mg showed no changes over the time period examined.
Mean pH values of soils decreased from 6.90 ± 0.77 to 5.84 ± 0.90 (−15%) and 7.12 ± 0.61 to 6.32 ± 0.68 (−11%) in the 0–20 cm and 0–100 cm soil layers, respectively. Mean values of exchangeable acidity increased from 9.32 ± 3.09 to 13.23 ± 3.72 kmolc ha−1 (42%) and from 32.66 ± 15.60 to 42.73 ± 14.48 kmolc ha−1 (31%) in the respective soil layers. Soil pH value and exchangeable acidity were negatively correlated both in 1970 (−0.897) and in 2003 (−0.728) (). This means that the increase in exchangeable acidity in the soils caused a decrease in the pH value, which agreed with a previous study in Bangladesh (CitationAli et al. 1997) (). The changes in soil pH and exchangeable acidity in the soil may be caused by a decrease in exchangeable base cations, particularly Na, and the application of nitrogen fertilizer over the study period. During 1970–2003, mean exchangeable Na content significantly decreased from 3.28 ± 2.76 to 1.67 ± 2.06 kmolc ha−1 (−49%) and from 14.26 ± 6.64 to 8.63 ± 9.10 kmolc ha−1 (−39%) in the 0–20 cm and 0–100 cm soil layers, respectively (). Application of urea [CO(NH2)2] as a nitrogen fertilizer with doses of 150 kg ha−1 per cropping season in Java may have contributed to declining soil pH and increased exchangeable acidity. CitationPierre et al. (1970) and CitationBrady and Weil (2002) reported that the long-term application of nitrogen fertilizer can cause acidification in the soil.
shows the changes in exchangeable base cations in both the 0–20 cm and 0–100 cm soil layers. Over three decades of GR application, mean exchangeable Ca and Mg contents in sawah soils showed slight increases from 61.11 ± 50.04 to 65.68 ± 62.23 kmolc ha−1 and from 15.71 ± 10.25 to 16.80 ± 10.57 kmolc ha−1, respectively, in the 0–20 cm soil layer, although these differences were not statistically significant (); while the exchangeable Ca and Mg in the 0–20 cm soil layer in Bangladesh slightly decreased from 187.1 ± 199.0 to 165.3 ± 165.4 kmolc ha−1 and from 58.9 ± 45.3 to 53.8 ± 45.0 kmolc ha−1, respectively, over a similar period (CitationAli et al. 1997). In the 0–100 cm soil depth in both Java and Bangladesh these two parameters decreased over time in the soils. CitationBrammer (1972) reported that frequent flooding in Bangladesh caused the loss of carbonate (approximately 2%) in young Ganges sediment over a 25-year period. In contrast, dolomite [CaMg(CO3)2] was applied every 4 years at a dose of 2.0 Mg ha−1 in some locations in Java (D. Darmawan, pers. comm. 2003.), which probably influenced the changing rates in the exchangeable Ca and Mg contents in the 0–20 cm soil layer in both countries.
Mean exchangeable K decreased marginally from 1.43 ± 0.71 to 1.33 ± 0.98 kmolc ha−1 (−7%) in the 0–20 cm
Table 1 Changes in pH, exchangeable acidity (kmolc ha−1), effective cation exchange capacity (eCEC) (kmolc ha−1) and available phosphorus (P) (kg P2O5 ha−1) in sawah in Java during the period 1970–2003
Table 2 The change in exchangeable calcium (Ca), magnesium (Mg), potassium (K) and sodium (Na) (kmolc ha−1) in sawah in Java during the period 1970–2003
Table 3 Correlation matrix of the mean values in 2003 (right to left) and in 1970 (up to down) of sawah soil properties in the 0–20 cm layer from soil samples taken in Java, Indonesia
Application of GR technology during the period 1970–2003 did not really affect the eCEC in soils in the 0–20 cm and 0–100 cm soil layers (). Mean eCEC in the 0–20 cm layer increased slightly from 90.85 ± 56.10 to 98.71 ± 66.36 kmolc ha−1 (9%), but slightly decreased from 420.00 ± 255.50 to 403.53 ± 230.63 kmolc ha−1 (−4%) in the 0–100 cm soil layer. As the eCEC value is the sum of exchangeable base cations and exchangeable acidity, changes in eCEC also depend on the changing patterns in soil properties in Java and Bangladesh ().
Mean available P significantly increased from 136.62 ± 154.72 to 255.75 ± 292.41 kg P2O5 ha−1 (87%) and from 459.85 ± 523.73 to 779.16 ± 893.80 kg P2O5 ha−1 (69%) in the 0–20 cm and 0–100 cm soil layers, respectively (). Continuous application of super-phosphate [Ca(H2PO4)2] as a P fertilizer with a dose of 125 kg ha−1 per cropping season (equal to 45 kg P ha−1 per cropping season) after the GR period caused an accumulation of P in the soils. This result was opposite to the case in Bangladesh, where the application of chemical P fertilizer was reduced compared with Java (20 kg P ha−1) (CitationAlam et al. in press). During the period 1967–1995, available P in Bangladesh decreased from 172.7 ± 105.9 to 156.8 ± 88.3 kg P2O5 ha−1 (−10%) in topsoil, but was maintained at approximately 520 kg P2O5 ha−1 within the soil profile (CitationAli et al. 1997) ().
Changes in the soil properties examined in this study (,) also affect the correlation among the properties (). However, in 1970 most of the soil properties were significantly correlated with each other. For example, the correlation coefficients of exchangeable Ca to Mg, K and Na in 1970 were 0.431, 0.411 and 0.600, respectively, which were statistically significant. However, a number of the correlation patterns changed in 2003, such as the correlation between exchangeable Ca to K and Na, and available P to exchangeable K and Na. Exchangeable K and Na were not significantly correlated with Ca and Mg in 2003 because of a sharp decrease in exchangeable Na from 1970 to 2003 (). Exchangeable K was supplied as K fertilizer at some sites and its content changed independently from the other exchangeable base cations. There was no significant correlation found between exchangeable K and available P in 1970, but the application of K and P fertilizers as an element of GR technology increased their mean values and caused a positive significant correlation (0.641) between these values in 2003 ().
Effect of land management on changes in soil chemical properties
The effects of land management differences between seedfarms and non-seedfarms on the changes in soil properties are presented in . The mean pH value in the 0–20 cm and 0–100 cm soil layers at both sites significantly decreased (P < 0.001). The mean values of soil pH in seedfarms decreased from 7.13 ± 0.66 to 5.88 ± 1.02 (−17%) and from 7.26 ± 0.46 to 6.38 ± 0.64 (−12%) in the 0–20 cm and 0–100 cm soil layers, respectively; while in non-seedfarms pH changed from 6.71 ± 0.81 to 5.81 ± 0.81 (−13%) and from 7.01 ± 0.70 to 6.28 ± 0.72 (−10%) within the respective soil layers. Although the percentage changes of mean pH between seedfarms and non-seefarms at both soil depths showed some differences, these differences were not statistically significant ().
Table 4 The effects of land management on changes in chemical properties of sawah soil in the 0–20 cm and 0–100 cm soil layers at seedfarm and non-seedfarm sites during the period 1970–2003 in Java, Indonesia
Mean exchangeable acidity showed the reverse trend to pH and significantly increased from 8.68 ± 3.40 to 12.80 ± 4.60 kmolc ha−1 (47%) and from 29.70 ± 12.00 to 41.40 ± 16.00 kmolc ha−1 (39%) in the 0–20 cm and 0–100 cm soil layers, respectively, in seedfarms (). A similar trend was also found in non-seedfarms, although the changes were not as great. Mean exchangeable acidity in non-seedfarms also significantly increased from 9.80 ± 2.80 to 13.60 ± 2.80 kmolc ha−1 (38%) and from 35.10 ± 17.90 to 43.80 ± 13.40 kmolc ha−1 (25%) in the respective soil layers (). The effect of land management differences between seedfarms and non-seedfarms on the changing rate of exchangeable acidity was not statistically significant. Although the application rate of nitrogen fertilizers that could act as an acid source in seedfarms always followed the government recommendation, the rate of application in non-seedfarms depended on the farmer's budget, creating dissimilarity in the change pattern of pH and exchangeable acidity. CitationBrady and Weil (2002) reported that the intensive application of nitrogen fertilizer has brought about significant acceleration in soil acidification.
The exchangeable base cations that showed certain distinctive trends as an effect of land management practice differed between seedfarms and non-seedfarms. Mean values of exchangeable Ca content in 1970 and 2003 were not statistically different in both the 0–20 cm and 0–100 cm soil layers in seedfarms and non-seedfarms, except in the 0–100 cm soil layer of non-seedfarms in which they decreased from 303.80 ± 268.50 to 261.00 ± 224.40 kmolc ha−1 (−14%) (). Mean values of exchangeable Mg content also showed a similar trend to Ca both in the 0–20 cm and 0–100 cm soil layers. Application of GR over three decades did not influence the exchangeable Ca and Mg content in both soil layers in seedfarms and non-seedfarms.
Mean values of exchangeable Na content decreased most significantly among the base cations in the studied sites. In seedfarms, exchangeable Na decreased from 3.50 ± 2.60 to 2.10 ± 2.90 kmolc ha−1 (−41%) and from 15.50 ± 4.80 to 10.60 ± 12.20 kmolc ha−1 (−31%) in the 0–20 cm and 0–100 cm soil layers, respectively; while within the same layers, exchangeable Na at non-seedfarms decreased from 3.10 ± 2.90 to 1.30 ± 0.90 kmolc ha−1 (−57%) and from 13.20 ± 7.80 to 7.00 ± 5.10 kmolc ha−1 (−47%) (). The difference in the change in exchangeable Na content from 1970 to 2003 in seedfarms and non-seedfarms may occur not only because of land management practices, but also because of topographical differences between the locations of seedfarms and non-seedfarms. Na is mainly supplied from the parent materials through weathering processes. It is well understood that Na is a highly soluble element and easily lost through water movement. During the rainy season from September to April, abundant water flow solubilizes Na and brings it from upland to lowland. As the non-seedfarm sites were mostly located upland, they lost more Na than the seedfarm sites, which were generally located in the low coastal plain areas (CitationVerburg et al. 1999).
Changes in mean values of exchangeable K from 1970 to 2003 showed significantly different trends in seedfarms and non-seedfarms. Over the study period, the exchangeable K content in seedfarms did not show a statistical difference and remained stable at approximately 2 kmolc ha−1 and 7–8 kmolc ha−1 in the 0–20 cm and 0–100 cm soil layers, respectively; while in non-seedfarms those values decreased significantly from 1.30 ± 0.60 to 1.00 ± 0.70 kmolc ha−1 (−23%) and from 6.00 ± 2.10 to 4.00 ± 2.60 kmolc ha−1 (33%) in the respective soil layers (). As an essential macronutrient, K had been added to the soil as potassium chloride (KCl) fertilizer at seedfarms, but not at non-seedfarms (CitationLansing et al. 2001). The chemical fertilizer used at non-seedfarm sites mostly depended on the farmer's budget, and among the three types of chemical fertilizers used (urea, super-phosphate and KCl), KCl was used less frequently by the farmers (D. Darmawan, pers. comm. 2003.). The removal of K through harvest or leaching without enough replacement may contribute to the decrease in exchangeable K at non-seedfarm sites where the application of K fertilizers was not as great as the application at seedfarms.
There were no clear effects of land management on the changes in eCEC values from 1970 to 2003. The mean values of eCEC increased insignificantly in the 0–20 cm and 0–100 cm soil layers, both at seedfarms and non-seedfarms (). An increase in the organic matter contents as shown by total carbon (TC) and total nitrogen (TN) accumulation in the soils (CitationDarmawan et al. in press) might contribute to the change in eCEC. The eCEC slightly increased from 1970 to 2003 at both seedfarms and non-seedfarms, although the changes were not statistically significant.
Available P content significantly increased from 198.5 ± 211.1 to 393.0 ± 382.3 kg P2O5 ha−1 (98%) and from 653.6 ± 690.5 to 1198.2 ± 1147.9 kg P2O5 ha−1 (83%) from 1970 to 2003 in the 0–20 cm and 0–100 cm soil layers, respectively (); while in non-seedfarms P increased from 86.0 ± 49.3 to 143.5 ± 105.6 kg P2O5 ha−1 (67%) and from 301.3 ± 254.8 to 436.3 ± 378.6 kg P2O5 ha−1 (45%) in the respective soil layers. The rate of increase was higher at seedfarms compared with non-seedfarms (). The results are obviously related to differences in land management practice, such as fertilizer application, between seedfarms and non-seedfarms as well as exchangeable K, which affected the change rates of available P during the period of study. Seedfarms, which were planted with rice and had P fertilizer applied following the government recommendation after the GR technology started, accumulated more available P than did non-seedfarms, where the application of P fertilizer was not as great as that at seedfarms. The excess of available P in Java sawah soils, particularly at seedfarms, appears to create an environmental problem. Water flow through run-off and drainage brought dissolved P into the water body downstream. During the field research in the present study, evidence of water pollution was observed (e.g. aquatic plants grew and covered the water surface on the drainage canals in lowland areas). According to CitationBrady and Weil (2002), runoff, leaching and erosion from agricultural land will move some P into streams, lakes, ponds and reservoirs, triggering the process of eutrophication. CitationLansing et al. (2001) found that the concentration of P in a stream increased gradually from upper to lower areas in Bali. These results were also in agreement with CitationZhang et al. (2003) who reported that P loss from sawah was a potential factor related to water eutrophication because P content in runoff and leachate were detachable, even when the sawah receive low doses of P fertilizer.
CONCLUSION
The application of GR technology during the period 1970–2003 dramatically increased rice production. However, it caused some adverse effects to the sawah soils in Java. Application of KCl at doses of 100 kg ha−1 per cropping season in seedfarms appeared sufficient to replenish the K removed through harvesting and leaching, thus, keeping rice production high. However, the application of chemical fertilizers of N and P appeared to accelerate acidification and accumulation of P in the soil. The application of chemical fertilizer without any consideration of the natural supply from the soils or (irrigation) water resulted in considerable variation in the changes in soils properties among the sites over the study period at both seedfarm and non-seedfarm sites. To avoid adverse effects of GR technology, such as soil degradation and environmental pollution through the leaching of excess nutrients, particularly N and P, and to increase fertilizer use efficiency, we aim to examine the nutrient mass balance at a number of specific sites and would like to establish a suitable and effective fertilizer recommendation for Indonesia.
ACKNOWLEDGMENTS
The authors would like to express their deep gratitude to the Ministry of Education, Science, Sport and Culture of Japan for financial assistance for this study. The deepest appreciation goes to Dr Fahmuddin Agus from the Center of Soils and Agro-climate Research and Development (CSARD) Bogor, Indonesia, for providing the necessary support during soil sampling in Java in 2003.
Related Research Data
REFERENCES
- Das , RJ . 2002 . The green revolution: a theoretical and empirical examination of the relation between technology and society . Geoforum , 33 : 55 – 72 .
- Indonesian Ministry of Agriculture . 2001 . Produksi Padi di Indonesia (The Rice Production of Indonesia) , Jakarta : Indonesian Ministry of Agriculture . (in Indonesian)
- Otsuka , K . 2000 . Role of agricultural research in poverty reduction: lesson from the Asian experience . Food Policy , 25 : 447 – 462 .
- Darmawan , Kyuma , K , Saleh , A , Subagjo , H , Masunaga , T and Wakatsuki , T . The effect of green revolution technology during the period of 1970–2003 on sawah soils properties in Java, Indonesia; I. Carbon and nitrogen distribution under different land managements practice and soils types . Soil SciPlant Nutr , 52 634 – 644 .
- Kyuma , K . 2004 . Paddy Soils Science , Melbourne : Kyoto University Press and Trans Pacific Press .
- Lansing , JS , Kremer , JN Gerhart , V . 2001 . Volcanic fertilization of Balinese rice paddies . EcolEcon , 38 : 383 – 390 .
- IITA . 1979 . Selected Methods for Soils and Plant Analysis , Manual Series No. 1 Ibadan : IITA .
- McLean , EO . 1982 . “ Soils pH and lime requirement ” . In Methods of Soils Analysis , Number 9, Part 2 Edited by: Page , AL . 199 – 209 . Madison : ASA, SSSA .
- McLean , EO . 1965 . “ Aluminum ” . In Methods of Soils Analysis , Number 9, Part 2 Edited by: Black , CA . 978 – 998 . Madison : ASA, SSSA .
- Thomas , GW . 1982 . “ Exchangeable cations ” . In Methods of Soils Analysis , Number 9, Part 2 Edited by: Page , AL . 159 – 165 . Madison : ASA, SSSA .
- Bray , RH and Kurtz , LT . 1945 . Determination of total, organic and available phosphorus in soils . Soils Sci , 59 : 39 – 45 .
- Ali , MM , Saheed , SM , Kubota , D , Masunaga , T and Wakatsuki , T . 1997 . Soils degradation during the period 1967–1995 in Bangladesh. II. Selected chemical characters . Soils SciPlantNutr , 43 : 879 – 890 .
- Pierre , WH , Meisinger , J and Birchett , JR . 1970 . Cation–anion balance in crops as a factor in determining the effect of nitrogen fertilizers on soils acidity . AgronJ , 62 : 106 – 112 .
- Brady , NC and Weil , RR . 2002 . The Nature and Properties of Soils , 10th edn , New York : Macmillan .
- Brammer , H . 1972 . “ Soils Survey Project ” . Technical Report 2 FAORome Bangladesh : Agricultural Development Possibilities .
- Alam , MM , Ladha , JK Foyjunnessa . 2006 . Nutrient management for increased productivity of rice–wheat cropping system in Bangladesh . Field Crops Res , 96 : 374 – 386 . in press
- Verburg , PH , Veldkamp , TA and Bouma , J . 1999 . Land use change under condition of high population pressure: the case of Java . Glob. Environ. Change , 9 : 303 – 312 .
- Zhang , HC , Cao , ZH , Shen , QR and Wong , MH . 2003 . Effect of phosphate fertilizer application on phosphorus (P) losses from paddy soils in Taihu Lake Region: I. Effect of phosphate fertilizer rate on P losses from paddy soils . Chemosphere , 50 : 695 – 701 .