Abstract
MicroRNA-200c (miR-200c) has been shown to suppress epithelial-mesenchymal transition (EMT), which is attributed mainly to targeting of ZEB1/ZEB2, repressors of the cell-cell contact protein E-cadherin. Here we demonstrated that modulation of miR-200c in breast cancer cells regulates cell migration, cell elongation, and transforming growth factor β (TGF-β)-induced stress fiber formation by impacting the reorganization of cytoskeleton that is independent of the ZEB/E-cadherin axis. We identified FHOD1 and PPM1F, direct regulators of the actin cytoskeleton, as novel targets of miR-200c. Remarkably, expression levels of FHOD1 and PPM1F were inversely correlated with the level of miR-200c in breast cancer cell lines, breast cancer patient samples, and 58 cancer cell lines of various origins. Furthermore, individual knockdown/overexpression of these target genes phenocopied the effects of miR-200c overexpression/inhibition on cell elongation, stress fiber formation, migration, and invasion. Mechanistically, targeting of FHOD1 by miR-200c resulted in decreased expression and transcriptional activity of serum response factor (SRF), mediated by interference with the translocation of the SRF coactivator mycocardin-related transcription factor A (MRTF-A). This finally led to downregulation of the expression and phosphorylation of the SRF target myosin light chain 2 (MLC2) gene, required for stress fiber formation and contractility. Thus, miR-200c impacts on metastasis by regulating several EMT-related processes, including a novel mechanism involving the direct targeting of actin-regulatory proteins.
INTRODUCTION
Expression of miR-200 family members is frequently downregulated in metastases compared to that in primary tumors (Citation11, Citation18, Citation30), and reduced miR-200 levels are associated with a poor outcome in several human epithelial malignancies (Citation16, Citation47, Citation49). Furthermore, overexpression of miR-200 was demonstrated to suppress metastasis in mouse models of lung adenocarcinoma and breast cancer (Citation1, Citation11). Metastasis-suppressing effects of miR-200 family members have thus far been attributed mostly to their ability to inhibit epithelial-mesenchymal transition (EMT), a process that is thought to be central in the metastatic progression of many cancer types (Citation42). This has been shown to be mediated via miR-200-induced downregulation of the transcriptional repressors ZEB1 and SIP1/ZEB2 (Citation13, Citation22, Citation31). While targeting of ZEB1 and ZEB2 by miR-200 and the resulting upregulation of E-cadherin were shown to contribute to inhibition of motility (Citation20), reexpression of E-cadherin by targeting both ZEB1 and ZEB2 was insufficient to fully reverse EMT, as characterized by failed remodeling of the actin cytoskeleton (Citation5). Two recently identified miR-200 targets, the cytoskeleton-associated protein moesin and the extracellular matrix protein fibronectin 1, have already been implicated in miR-200-induced suppression of migration in one endometrial and one breast cancer cell line (Citation15); however, the physiological relevance of this mechanism still remains to be demonstrated, and additional target genes are likely to be involved.
In this study, we demonstrated that miR-200c, the predominant member of the miR-200 family (Citation13, Citation17, Citation47), can inhibit migration and invasion of breast cancer cells in a ZEB1/ZEB2-independent manner by interfering with actin cytoskeletal organization. Using a combination of genome-wide expression profiling and computational and molecular biology approaches, we identified the actin-regulatory proteins formin homology 2 domain containing 1 (FHOD1) and protein phosphatase, Mg2+/Mn2+ dependent, 1F (PPM1F) as novel direct targets of miR-200c and demonstrated that they contribute to miR-200c-induced inhibition of migration and invasion through regulation of stress fiber formation and function by modulating several downstream mediators.
MATERIALS AND METHODS
Cell culture and growth factor stimulation.
Two human breast cancer cell lines (MDA-MB-231 and MCF-7) were obtained from the American Type Culture Collection (Manassas, VA). Culturing media and supplements for the two cancer cell lines were described previously (Citation33). For stimulation with transforming growth factor β (TGF-β), cells were starved in serum-free medium for 24 h and subsequently treated with 10 ng/ml TGF-β (Peprotech, Rocky Hill, NJ) for 5 h. HEK293FT cells were grown in D-MEM high-glucose medium (Invitrogen, Carlsbad, CA) containing 10% fetal bovine serum (FBS), 100 U/ml penicillin-streptomycin, and 500 μg/ml Geneticin. Transfection and starvation media were deprived of penicillin-streptomycin and FBS, respectively.
Transfection with siRNAs, miRNA mimics, miRNA hairpin inhibitors, and expression constructs.
All transfections were carried out using the Lipofectamine 2000 transfection reagent as described previously (Citation33). For silencing of genes of interest, either pools of four small interfering RNAs (siRNAs) per gene or individual siRNAs were used (for sequences, see Table S1 in the supplemental material). siRNAs, microRNA (miRNA) mimics (see Table S2), and miRNA hairpin inhibitors (see Table S3) (all from Dharmacon, Lafayette, CO) were used at final concentrations of 40, 25, and 100 nM, respectively. For efficient inhibition of the miR-200bc/429 cluster, equal amounts of inhibitors directed against miR-200c and miR-429 were combined. Expression vectors for FHOD1 (pCMV5-FHOD1-HA) and PPM1F (pCDNA-Dest47-PPM1F) open reading frames (ORFs), as well as respective empty-vector controls (pCMV6 and pCDNA-Dest47), were transfected at 200 ng per well of a six-well plate.
Cell lysis and Western blotting.
Preparation of protein lysates and Western blotting were done as previously described (Citation33). Fifteen micrograms of total protein was separated by sodium dodecyl sulfate-polyacrylamide gel electrophoresis and exposed to primary antibodies (see Table S4 in the supplemental material). Horseradish peroxidase-conjugated secondary antibodies were from Santa Cruz Biotechnology (Santa Cruz, CA).
Immunofluorescence staining and microscopy.
Cells were seeded on square coverslips in six-well plates and transfected as described above. Subsequently, cells were fixed with 2% paraformaldehyde for 15 min. For permeabilization, 0.2% Triton X-100 in phosphate-buffered saline (PBS) was applied for 5 min. Specimens were blocked for 30 min with 3% bovine serum albumin (BSA)-PBS. For detection of pMLC2 (Thr18/Ser19), specimens were incubated with anti-pMLC2 antibody (1:250; Cell Signaling Technology) overnight at 4°C. Alexa Fluor 647-labeled secondary antibody (Invitrogen) was diluted 1:1,000 and applied for 1 h at room temperature. For staining of filamentous actin, cells were incubated with Alexa Fluor 488-phalloidin (1:40; Invitrogen) for 30 min at room temperature. For nuclear staining, cells were treated with 1 μg/μl of 4′,6-diamidino-2-phenylindole (DAPI) for 10 min. All antibodies and staining reagents were diluted in 3% BSA-PBS, and cells were washed three times with PBS after each step of the staining procedure. Coverslips were mounted with ProLong Gold antifade reagent. Images were taken using a Zeiss LSM 510 Meta confocal microscope.
Plasmid construction and site-directed mutagenesis.
The 3′ untranslated regions (3′-UTRs) of the FHOD1 and PPM1F genes were amplified by PCR using genomic DNA of the MDA-MB-231 cell line and cloned downstream of the Renilla luciferase open reading frame in the psiCHEK-2 vector (Promega) using XhoI and NotI restriction sites. FHOD1 primers (GCGCGCCTCGAGGAGAAGGACGTTGAAGAGTG and GCGCGCGCGGCCGCGGATTAGCTAAGAAAATTTTATTTTG) were designed to bind to positions 17806 to 17825 and 18107 to 18131 of the FHOD1 genomic sequence (according to NC_000016.9); PPM1F primers (GCGCGCCTCGAGAGGCTCCACCAAGAAGCTA and GCGCGCGCGGCCGCGAGTTCAGAACTTGTGGTTTATTG) were designed to bind to positions 29766 to 29785 and 33433 to 33445 of the PPM1F genomic sequence (according to NC_000022.10). Four point mutations were introduced into each target site by mutagenesis PCR.
Luciferase reporter assay.
For luciferase reporter assays, cells were seeded in 96-well plates and cotransfected with either 25 nM miRNA mimics or 100 nM hairpin inhibitors together with 15 ng/well psiCHECK-2 reporter vectors. Forty-eight hours after transfection, luciferase activity was measured using the dual-luciferase reporter assay system kit (Promega) according to the manufacturer's instructions using a Tecan M200 luminescence reader. Values were double normalized to firefly luciferase activity and to cells transfected with empty psiCHECK-2 control vectors.
Measurement of SRF activity.
For the measurement of serum response factor (SRF) activity, luciferase reporter assays were performed using the pGL4.34 [luc2P/SRF-RE/Hygro] reporter vector (Promega), which drives transcription of a luciferase reporter gene under the control of the SRF response element (SRE). HEK293FT cells were seeded in 96-well plates and cotransfected with one of the following (per well): 20 nM siRNAs, 25 nM miRNAs, 100 nM miRNA inhibitors, or 20 ng/well overexpression vectors, together with 100 ng/well pGL4.34 and 10 ng/well pRL-TK vector (Promega). Twenty-four hours after transfection, cells were starved for 24 h and stimulated with 10 ng/ml TGF-β for 6 h before cell lysis. Luciferase activity was measured as described above. Values were normalized to Renilla luciferase activity.
Wound-healing assay.
Wound-healing assays were carried out using migration culture dish inserts from Ibidi (Martinsried, Germany). Cells were seeded in the chambers of the culture dish insert and transfected. Forty-eight hours after transfection, the insert was removed and fresh culture medium was added to start the migration process. Pictures were acquired after 0 h and 8 h (in the case of MDA-MB-231) or 36 h (in the case of MCF-7) using a Zeiss Axiovert 24 light microscope and an Axiocam MRc camera. Image analysis was performed using CellProfiler.
RTCA invasion and migration assays.
RTCA (real-time cell analyzer) invasion or migration assay measures the effect of any perturbations in a label-free real-time setting. As cells migrate or invade (when coated) from the upper chamber through the membrane into the bottom chamber in response to a chemoattractant, they contact and adhere to the electronic sensors on the underside of the membrane, resulting in an increase in the electrical impedance. The increase in the impedance correlates with increasing numbers of migrated or invaded cells on the underside of the membrane (Citation36).
For RTCA invasion or migration experiments, transfections were performed as described above. Cells were then starved in serum-free medium for 24 h and seeded in RTCA Cim-16 plates (RTCA; xCELLigence Roche, Penzberg, Germany) in serum-free medium. Full growth medium was used as a chemoattractant in the lower chamber. Measurements were performed in a time-resolved manner using the RTCA device (RTCA, xCELLigence Roche, Penzberg, Germany). For invasion assays, the Cim-16 plates were initially coated with Matrigel (BD Biosciences, Bedford, MA) diluted in serum-free medium at a ratio of 1:20. MDA-MB-231 cells were stimulated to invade in the presence of TGF-β.
Matrigel invasion assay.
Cells were transfected with siRNAs or miRNAs as described above and seeded in BioCoat Matrigel invasion plates (Becton Dickinson Bioscience, Franklin Lakes, NJ). TGF-β (10 ng/ml) was added to cells in the upper chamber, and after 24 h, the number of invaded cells was determined by flow cytometry.
Quantitative RT-PCR of mRNAs.
Total RNA was isolated using the RNeasy minikit (Qiagen), and cDNA was synthesized from RNA using the Revert Aid H Minus first-strand cDNA synthesis kit (Fermentas, St. Leon-Rot, Germany) according to the manufacturer's instructions. For reverse transcriptase PCRs (RT-PCRs), the TaqMan Abgene universal mix (Thermo Scientific, Rockford, IL) and probes from the Universal Probe Library (Roche, Penzberg, Germany) were used. Oligonucleotide primers were synthesized at MWG (Ebersberg, Germany). HPRT (hypoxanthine phosphoribosyltransferase) and ACTB or TFRC was used as a housekeeping-gene control. Sequences of primers and the respective Universal Probe Library (UPL) probe numbers are given elsewhere (see Table S5 in the supplemental material). Data were analyzed according to the ΔΔCT method (Citation23).
Quantitative RT-PCR of miRNAs.
For miRNAs, the TaqMan microRNA reverse transcription kit and TaqMaq gene-specific microRNA assays (Applied Biosystems, Weiterstadt, Germany) were used. For the quantitative RT-PCRs (qRT-PCRs), RNU44 and RNU48 were used as housekeeping controls. Data were acquired using a HT-7900 TaqMan instrument (Applied Biosystems) and analyzed with the delta-delta CT algorithm (ddCt; Bioconductor).
MRTF translocation assay.
MDA-MB-231 cells were transfected with miRNA mimics or siRNAs as described above. After washing with PBS, cells were fixed in 4% paraformaldehyde (PFA) for 20 min and permeabilized with 0.2% Triton X-100 in PBS for 5 min. Cells were blocked with 1% BSA in PBS for 1 h at room temperature and exposed to mycocardin-related transcription factor A (MRTF-A) antibody (Santa Cruz Biotechnology). Fluorescein-conjugated Alexa Fluor 488 secondary antibody (Invitrogen) was used. All antibodies were used at a 1:1,000 dilution in blocking buffer with 4°C overnight incubation. Nuclei were stained with DAPI dihydrochloride (Sigma-Aldrich, St. Louis, MO). Images for quantitative analysis at magnification ×20 were acquired using an Olympus ScanR high-content screening microscope (Olympus, Hamburg, Germany) from approximately 1,000 cells for each sample and analyzed by Olympus ScanR analysis software.
Computational target prediction.
For the identification of miR-200c targets, two different software algorithms were used to find conserved target sites throughout mammalian transcriptomes: TargetScan release 5.1 (http://www.targetscan.org) and the PITA target site catalogue from the Segal Lab of Computational Biology (http://genie.weizmann.ac.il). The two lists obtained from mRNA expression profiling upon miR-200bc/429 overexpression in MDA-MB-231 cell lines (Citation43) and in silico computational target predictions were compared. The intersection of both resulted in a list of 34 common genes as potential targets of miR-200c, depicted in Table S6 in the supplemental material.
Correlation analysis.
Expression data for 101 human primary breast tumors was obtained from a public data set deposited in the NCBI GEO database (GEO accession no. GSE19783 [Citation8]). miR-200c, FHOD1, and PPM1F expression data for 11 breast cancer cell lines (SK-BR-3, BT474, ZR7530, HCC1419, MCF-7, T47D, BT483, HCC202, UACC812, MDA-MB-231, and MDA-MB-468) and two mammary epithelial cell lines (MCF-10A and MCF-12A) were determined by qRT-PCR as described above. Expression data sets for FHOD1, PPM1F, and miR-200c in the cell lines of the NCI60 panel were obtained from http://dtp.nci.nih.gov/index.html (experiment IDs 372534, 124184, and 27785, respectively). Pearson correlation coefficients (r) and two-tailed P values of normalized, log2-transformed data sets were computed in the R statistical software program.
To study the association of microRNA and target gene expression levels with epithelial or mesenchymal characteristics, mammary epithelial and breast cancer cell lines were divided into epithelial, mesenchymal, and undefined groups based on data on their phenotypes, invasive behaviors and EMT marker gene expression (Citation2, Citation24, Citation29, Citation37) and on E-cadherin mRNA expression. BT474, ZR7530, MCF-7, T47D, BT483, HCC202, and UACC812 were scored as epithelial in accordance with all available data. SK-BR-3 cells and MDA-MB-468 cells are negative for the mesenchymal markers vimentin and fibronection (Citation2) but express low levels of E-cadherin (Citation2; also data not shown) and have been described to have either an epithelial cell-like or intermediate phenotype (Citation24, Citation37); they were thus placed in the undefined category. For HCC1419 cells, insufficient information was available to make a confident decision; they were thus also included in the undefined category. For the NCI60 panel, sorting of epithelial, mesenchymal, and undefined subclusters was based on data by Park and colleagues (Citation31), where the ratio of E-cadherin expression to vimentin expression was determined in these cell lines.
Statistical analysis.
A two-tailed Student t test was used to estimate intergroup differences if not otherwise stated (indicated in figures as follows: ∗, P < 0.05; ∗∗, P < 0.01; ∗∗∗, P < 0.001).
RESULTS
Overexpression of miR-200c in metastatic breast cancer cells inhibits invasion, migration, cell polarization, and stress fiber formation.
To study the role of the miR-200 family in cell invasion and motility, we first assessed the invasion capacity of metastatic MDA-MB-231 breast cancer cells after transfection with a miR-200c mimic in real time and in endpoint invasion assays using the RTCA (real-time cell analyzer) and Matrigel assays, respectively. Consistent with earlier observations (Citation3), overexpression of miR-200c had a strong inhibitory effect on the invasion of the MDA-MB-231 cell line in both assays (A and B). Similarly, overexpression of miR-200c also inhibited migration of MDA-MB-231 cells as assessed by a wound-healing assay (C). Fluorescence microscopy results revealed that upon transfection of miR-200c mimic, the loss of migratory capability was accompanied by a loss of cell polarization (D, left). To quantify this effect, the ratios of long to short axes of cells transfected with either control mimic or miR-200c mimic were calculated. Elongation of cells transfected with miR-200c mimic was significantly less than that of control cells (two-sided t test, P < 0.001) (D, right). Furthermore, actin cytoskeletal structures that are characteristic of mesenchymal cell migration, namely, the actin network at the leading edge and long fibers spanning the cell body, were replaced by a diffuse distribution of actin staining. It has been shown that overexpression of miR-200c induces apoptosis (Citation34, Citation43); however, the observed effect on migration is not due to apoptosis, since decreased cell viability became detectable only 48 h or more after transfection (Citation43). Furthermore, the nuclei of miR-200c-transfected cells were intact as visualized by DAPI stainings (D, left).
Fig 1 miR-200c regulates invasion, migration, elongation, and stress fiber formation in breast cancer cells. (A) An RTCA (real-time cell analyzer) invasion assay of MDA-MB-231 cells transfected with microRNA mimics. MDA-MB-231 cells were transfected, starved in serum-free medium for 24 h, and seeded in RTCA CIM-16 plates covered with Matrigel. Cells were stimulated to invade in the presence of TGF-β (10 ng/ml), and impedance measurements were performed in a time-resolved manner. Means for four replicates ± standard deviations are shown; a t test was performed for the last time point. (B) Matrigel invasion assay of MDA-MB-231 cells transfected with microRNA mimics. Cells were transfected, seeded in Matrigel-coated invasion plates, and stimulated to invade in the presence of TGF-β (10 ng/ml). Invaded cells were quantified by flow cytometry. (C) Wound-healing assay of MDA-MB-231 cells transfected with microRNA mimics. MDA-MB-231 cells were seeded in migration chambers and transfected with 25 nM control or miR-200c mimic. Images of the migration area were captured 0 h and 8 h after removal of the migration chamber. For migration area quantification, the cell-free area of pictures was defined manually and filled with black for a subsequent gray-black selection process performed by the CellProfiler software program (n = 2). (D) Analysis of cell elongation by fluorescence microscopy in MDA-MB-231 cells. Cells were transfected with control mimic or miR-200c mimic and fixed 24 h after transfection. Actin filaments were visualized by staining with Alexa Fluor 488-phalloidin (green), and cell nuclei were stained with DAPI (blue). Boxes in the upper left corners of the images illustrate cell morphology with higher resolution. Cell elongation was quantified by measuring the long and short axes of cells using the Zeiss LSM Image Examiner software. Box plots represent data from two independent experiments, with 40 cells measured for each condition. (E) TGF-β-induced stress fiber assay in MDA-MB-231 cells. Cells were transfected with control mimic or miR-200c mimic and starved for 24 h. Stress fibers were induced by treatment with TGF-β for 5 h, and cells were stained with Alexa Fluor 488-phalloidin and DAPI. Boxes in the upper left corners of the images demonstrate stress fibers with higher resolution. The percentage of stress fiber-containing cells was determined by counting 200 to 300 cells per experiment; data shown represent means for three independent experiments. (F) Analysis of cell elongation by fluorescence microscopy in MCF-7 cells. Cells were transfected with control microRNA hairpin inhibitor or miR-200c hairpin inhibitor, starved for 24 h starting 2 days after transfection, and stimulated with TGF-β for 5 h. Staining, microscopy, and image analysis were carried out as for panel D. (G) Stress fiber assay in MCF-7 cells. Cells were transfected with control microRNA hairpin inhibitor or miR-200c hairpin inhibitor and starved for 24 h starting 2 days after transfection. Stress fibers were induced by treatment with TGF-β for 5 h. Staining, microscopy, and image analysis were carried out as described for panel E.
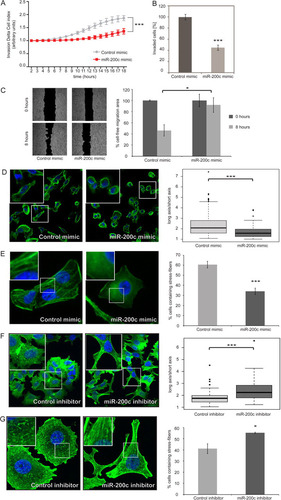
To further investigate the effect of miR-200c on cytoskeletal reorganization, we next tested the ability of MDA-MB-231 cells to form stress fibers, since these provide the contractile force required for mesenchymal cell-like motility. Upon stimulation with TGF-β, which has been demonstrated to induce stress fibers through activation of the RhoA signaling pathway (Citation6, Citation35), the majority of control-transfected MDA-MB-231 cells formed prominent stress fibers (E). However, in cells transfected with miR-200c mimic, actin filaments remained diffusely distributed in the cytoplasm. Analysis of activated RhoA levels in MDA-MB-231 cells by GTPase activation assays revealed that overexpression of miR-200c had no effect on RhoA activation (data not shown). This indicated that the regulatory effect of miR-200c on stress fiber formation was likely to act downstream of RhoA, potentially on the level of actin-regulatory effector proteins, rather than on upstream signaling events.
To further validate our observations with another cell line model, we inhibited miR-200c in noninvasive MCF-7 breast cancer cells, which express high endogenous levels of this microRNA, by transfection with hairpin inhibitors. Upon stimulation with TGF-β for 5 h, cells transfected with the miR-200c hairpin inhibitors indeed adopted a more elongated shape than control cells (F). Moreover, inhibition of miR-200c increased the ability of MCF-7 cells to form stress fibers (G). Taken together, these results indicate that the modulation of miR-200c levels impinges on cell invasion, migration, elongation, and stress fiber formation in breast cancer cells.
Actin-regulatory proteins FHOD1 and PPM1F are direct targets of miR-200c.
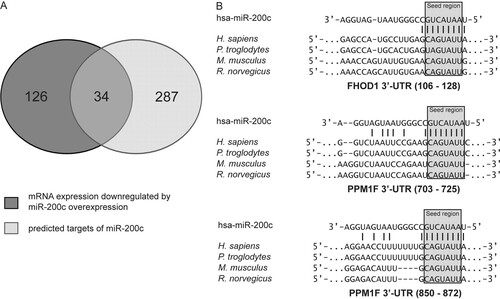
ZEB1 and ZEB2 are established direct targets of miR-200c, and these transcription factors impact on cell-cell contact formation as well as cell migration (Citation13, Citation22, Citation31). However, stress fiber organization was entirely unperturbed by depletion of these miR-200c target genes (). We thus reasoned that miR-200c would target additional genes mediating its effect on actin cytoskeletal organization. To identify novel candidate targets of miR-200c, we used genome-wide mRNA expression profiling data that we had obtained from MDA-MB-231 cells transfected with mimics of the miR-200bc/429 cluster sharing the same seed sequence (Citation43). We found 160 genes that were strongly downregulated by miR-200c overexpression (A). To identify direct miR-200c target genes, the data were merged with a list of potential miR-200bc/429 targets predicted by two microRNA target prediction tools, yielding 34 candidate target genes (see Table S6 in the supplemental material). Among those, the formin homology domain-containing protein 1 (FHOD1) and Mg2+/Mn2+-dependent protein phosphatase 1F (PPM1F) were of particular interest due to their described functions in the regulation of actin cytoskeletal organization (Citation9, Citation10, Citation19, Citation46, Citation48). The 3′-UTRs of FHOD1 and PPM1F are predicted to contain one and two miR-200c target sites, respectively, which all have a high degree of conservation among mammalian species (B).
Fig 2 Silencing of ZEB1 or ZEB2 does not interfere with stress fiber formation. (A) MDA-MB-231 cells were transfected with control siRNA (siAllStar) or siRNA directed against ZEB1 or ZEB2 and starved for 24 h. Stress fibers were induced by treatment with TGF-β for 5 h, and cells were stained for actin with Alexa Fluor 488-phalloidin (green), with the nucleus stained with DAPI (blue). (B) The percentage of stress fiber-containing cells was determined by counting 200 to 300 cells per experiment; data shown represents means of data from two independent experiments.
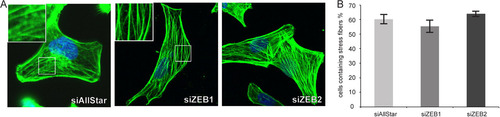
Fig 3 Identification of potential miR-200c target genes. (A) mRNA expression profiling of MDA-MB-231 cells transfected with miR-200c mimic was performed using the Illumina HumanWG-6 v3.0 expression array chip (Citation43). miR-200c targets were predicted using the TargetScan release 5.1 and PITA target prediction programs, and the lists of downregulated genes and predicted targets were merged, resulting in 34 genes as candidates for direct targeting by miR-200c. (B) miR-200c target sites in the 3′-UTRs of FHOD1 and PPM1F and interspecies conservation of seed matching sequences (gray box).
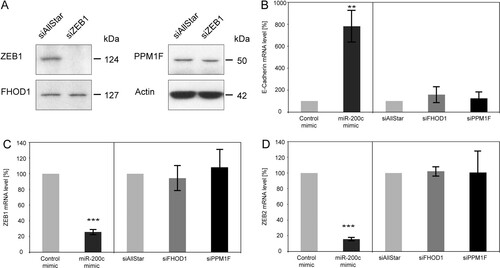
To validate regulation of FHOD1 and PPM1F by miR-200c, we first tested whether overexpression of miR-200c in MDA-MB-231 cells would have an effect on FHOD1 and PPM1F protein levels. To demonstrate the specificity of the antibodies and to evaluate the magnitude of the changes in FHOD1 and PPM1F protein levels after transfection of miR-200c mimic, nontargeting siRNA and siRNAs directed against FHOD1 or PPM1F were used as controls. The siRNAs significantly reduced levels of their target proteins after 24 h, and transfection of miR-200c mimic also led to a significant reduction in both FHOD1 and PPM1F protein levels within the same time frame (A). Conversely, inhibition of miR-200bc/429 cluster miRNAs in MCF-7 cells by transfection of microRNA hairpin inhibitors increased FHOD1 and PPM1F protein levels. These findings were also validated at the mRNA level upon miR-200c overexpression (in MDA-MB-231) or inhibition (in MCF-7) (B), confirming mRNA degradation mechanisms for miR-200c targeting of these two genes.
Fig 4 Validation of FHOD1 and PPM1F as direct targets of miR-200c. (A) MDA-MB-231 cells were transfected with microRNA mimics or siRNAs, and total protein was isolated after 24 h. MCF-7 cells were transfected for 48 h with microRNA hairpin inhibitors prior to protein isolation. FHOD1 and PPM1F were detected by Western blotting; β-actin was used as a loading control. (B) MDA-MB-231 cells were transfected with microRNA mimics or siRNAs for 24 h, and MCF-7 cells were transfected with microRNA hairpin inhibitors for 48 h. RNA was isolated, and FHOD1 and PPM1F transcript levels were quantified by qRT-PCR. ACTB and HPRT were used as housekeeping-gene controls. (C) MDA-MB-231 cells were cotransfected with microRNA mimics and psiCHECK-2 expression constructs containing the 3′-UTR of FHOD1 (n = 3) or PPM1F (n = 4) downstream of the Renilla luciferase gene. Forty-eight hours after transfection, luciferase activity was measured. Renilla luciferase activity was normalized first to firefly luciferase activity and then to the values measured for the parental vector psiCHECK-2. In the mutated constructs, the miR-200c target sites were disrupted by site-directed mutagenesis of four nucleotides within the seed sequence. (D) Luciferase assay with MCF-7 cells was carried out in the same manner as with MDA-MB-231 cells (n = 3 for FHOD1 3′-UTR; n = 2 for PPM1F 3′-UTR). (E) Luciferase assay with HEK-293FT cells was carried out in the same manner as with MDA-MB-231 cells (n = 2 for FHOD1 3′-UTR and PPM1F 3′-UTR). (F) MCF-7 cells were cotransfected with luciferase reporter constructs as before (n = 3 for FHOD1 3′UTR and PPM1F 3′-UTR) and microRNA hairpin inhibitors. Forty-eight hours after transfection, luciferase activity was measured.
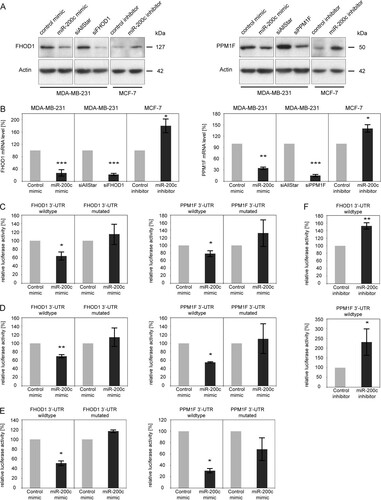
To validate FHOD1 and PPM1F as direct targets of miR-200c, we next performed luciferase reporter assays combined with site-directed mutagenesis. For this purpose, the 3′-UTRs of the candidate genes were cloned downstream of the Renilla luciferase ORF in a dual-luciferase reporter vector and cotransfected with control or miR-200c mimics into MDA-MB-231 cells. Relative luciferase activity was significantly reduced for both candidate genes' 3′-UTRs (C), indicating that FHOD1 and PPM1F are potential direct targets of miR-200c. Mutations in the predicted miR-200c target sites abrogated inhibition by miR-200c mimic, confirming the functionality of these target sites. We could further validate these results in MCF-7 cells (D) and in an unrelated nontumor cell line, HEK-293FT (E), showing that the observed effects are not restricted to our model systems. Finally, inhibition of miR-200c in MCF-7 cells resulted in an increase in relative luciferase activity (F). In conclusion, the results of the luciferase assay confirmed that FHOD1 and PPM1F are indeed novel direct targets of miR-200c.
Expression of miRNA-200c targets, FHOD1 and PPM1F, correlates with a mesenchymal cell-like phenotype in breast and other cancer cell lines.
To determine if targeting of FHOD1 and PPM1F is also relevant in vivo and particularly in the context of breast cancer, we performed a correlation analysis between the expression of miR-200c and its targets using expression data from breast cancer patients. For this purpose, publicly available mRNA and microRNA microarray data for 101 primary breast tumors was obtained from the NCBI GEO database (Citation8) (GEO accession no. GSE19783). Pearson correlation analysis showed a significant negative correlation between FHOD1 and miR-200c expression levels (r = −0.32; P = 9.81e−4) and between PPM1F and miR-200c expression levels (r = −0.45; P = 2.66e−6) (A). This suggests that miR-200c might also contribute to the regulation of FHOD1 and PPM1F in breast cancer patients.
Fig 5 Expression correlation of FHOD1 and PPM1F with miR-200c and with epithelial-mesenchymal states of the cells. (A) mRNA and microRNA profiling data for 101 breast cancer specimens was obtained from the NCBI GEO database (GEO accession no. GSE19783); expression levels were provided as log2-transformed, normalized data sets. Pearson correlation coefficients (r) and P values (two-tailed) were computed. Dashed lines indicate a first-order linear model fitting the data. (B) Transcript levels of miR-200c, FHOD1, and PPM1F in 13 breast cancer and mammary epithelial cell lines were quantified by qRT-PCR. Expression levels were normalized to data for MCF-7 cells and log2 transformed. Pearson correlation coefficients and P values were computed. (C) Breast cancer cell lines were divided into epithelial, undefined, and mesenchymal phenotypes based on published data (Citation2, Citation24, Citation29, Citation37), and expression levels from panel B were compared between the groups. (D) Data sets for the expression of miR-200c, FHOD1, and PPM1F in the NCI60 panel of cancer cell lines were obtained from http://dtp.nci.nih.gov/index.html (experiment IDs 372534, 124184, and 27785). Data were log2 transformed, and Pearson correlation coefficients and P values were computed. (E) NCI60 cell lines were classified as epithelial, undefined, and mesenchymal according to reference Citation31. Expression levels of FHOD1 and PPM1F were compared between the groups using the data from panel D.
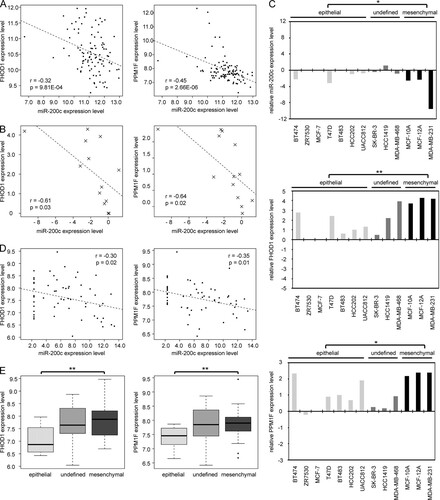
We then compared the expression levels of miR-200c and its target genes in 13 different breast cancer and mammary epithelial cell lines. Consistent with the observations made with clinical samples, FHOD1 and PPM1F expression levels were negatively correlated with miR-200c levels in these cell lines as well (r = −0.61 and P = 0.03, and r = −0.64 and P = 0.02, respectively) (B). Several studies have compared the expression levels of mesenchymal and epithelial marker genes in different breast cancer cells lines and linked a mesenchymal phenotype to increased motility and invasiveness (Citation2, Citation24, Citation29, Citation37). Making use of the data provided by these studies, we divided the 13 cell lines into epithelial cell-like (n = 8), mesenchymal cell-like (n = 3), and undefined (n = 2) groups. Consistent with its role in the suppression of EMT, miR-200c was expressed at higher levels in cell lines with an epithelial phenotype than in cell lines having a mesenchymal phenotype. Conversely, both FHOD1 and PPM1F expression levels were significantly higher in mesenchymal cell lines than in epithelial ones (C).
Intrigued by the finding that expression of miR-200c and its target genes FHOD1 and PPM1F inversely correlate both in breast cancer specimens and in breast cancer cell lines, we were interested in testing whether the negative correlation of miR-200c with FHOD1 and PPM1F expression levels would also hold true beyond breast cancer. The NCI60 panel (http://dtp.nci.nih.gov/index.html) of the U.S. National Cancer Institute encompasses 60 human cancer cell lines representing 9 different tumor types. We retrieved NCI60 expression data sets for miR-200c, FHOD1, and PPM1F. Again, FHOD1 and PPM1F showed a significant negative correlation with miR-200c levels (r = −0.30 and P = 0.02; r = −0.35 and P = 0.01) (D). Moreover, Park and colleagues (Citation31) had previously demonstrated that the NCI60 panel can be divided into an epithelial group, a mesenchymal group, and an undefined subcluster according to their ratio of E-cadherin expression to vimentin expression and that the expression of miR-200 family members is strongly associated with the epithelial subcluster. Using the subclusters defined by Park et al., we found that both miR-200c targets FHOD1 and PPM1F were significantly more highly expressed in cell lines with a mesenchymal phenotype (E), confirming and extending our findings to a wide panel of cancer cell lines.
Next, the correlation of FHOD1 and PPM1F expression a with mesenchymal cell-like phenotype prompted us to ask if there is a cross talk between these two novel miR-200c target genes and the regulation of EMT by known miR-200c targets ZEB1/ZEB2. Thus, we tested whether silencing of ZEB1 in MDA-MB-231 cells would have any effect on FHOD1 or PPM1F expression. Although the knockdown of ZEB1 was very efficient, neither FHOD1 nor PPM1F protein levels were affected (A). Furthermore, we tested potential effects of silencing FHOD1 or PPM1F on ZEB1, ZEB2, and E-cadherin expression. As expected, overexpression of miR-200c in MDA-MB-231 cells led to a strong induction of E-cadherin expression (B), and ZEB1 and ZEB2 mRNA levels were reduced by 80% (C and D). However, knockdown of FHOD1 or PPM1F did not affect the expression of any of these three genes. This shows that although high levels of FHOD1 and PPM1F are characteristics of a mesenchymal cell-like phenotype, their expression is not regulated by ZEB1/ZEB2 transcription factors and vice versa. Hence, we concluded that miR-200c could regulate migration and invasion through two separate pathways that do not influence each other, at least at the transcriptional level.
Fig 6 Effects of FHOD1 and PPM1F on the actin cytoskeleton are independent of the ZEB/E-cadherin axis. (A) MDA-MB-231 cells were transfected with control siRNA (siAllStar) or siRNA directed against ZEB1. Forty-eight hours after transfection, protein was isolated and expression levels of ZEB1, FHOD1, and PPM1F were assessed by Western blotting. β-Actin was used as a loading control. (B to D) MDA-MB-231 cells were transfected for 24 h with microRNA mimics or siRNAs. RNA was isolated, and E-cadherin, ZEB1, and ZEB2 transcript levels were quantified by qRT-PCR. ACTB and HPRT were used as housekeeping-gene controls.
Silencing of FHOD1 or PPM1F mimics the effects of miR-200c overexpression on invasion, migration, cell polarization, and stress fiber formation.
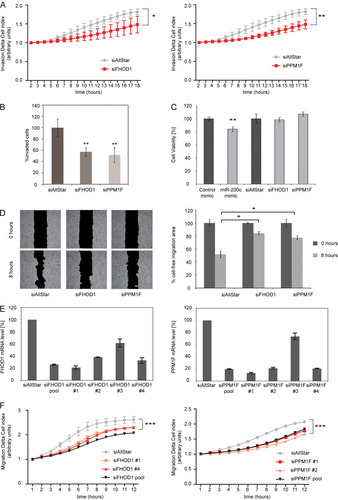
To assess if targeting of FHOD1 and PPM1F could contribute to miR-200c-induced phenotypes, we next investigated whether individual knockdown of FHOD1 or PPM1F would phenocopy the effects of miR-200c expression on invasion, cell migration, polarization, and stress fiber formation. Indeed, individual silencing of FHOD1 or PPM1F resulted in a decrease in the invasion of MDA-MB-231 cells as measured both by real-time (A) and Matrigel (B) invasion assays, without affecting the viability of the cells (C). Furthermore, knockdown of FHOD1 or PPM1F also reduced migration of cells in wound-healing assays (D). To exclude that these effects are potentially caused by off-target effects of the siRNA pools used for gene silencing, we then tested the knockdown efficiency of the four individual siRNAs directed against FHOD1 or PPM1F by qRT-PCR. All individual siRNAs except siFHOD1 3 and siPPM1F 3 strongly reduced their respective target gene's expression (E). We then chose two individual siRNAs for each gene and tested their effects on cell motility compared to that of siRNA pools in a real-time migration assay (F). Importantly, the individual siRNAs against FHOD1 or PPM1F reduced cell migration to a degree similar to that of the respective siRNA pools, supporting the specificity of the observed effects.
Fig 7 Individual silencing of FHOD1 or PPM1F phenocopies the effect of miR-200c on invasion and migration. (A) RTCA invasion assay of MDA-MB-231 cells transfected with siRNAs. MDA-MB-231 cells were transfected, starved in serum-free medium for 24 h, and seeded in RTCA CIM-16 plates covered with Matrigel. Cells were allowed to invade in the presence of TGF-β (10 ng/ml), and impedance measurements were performed in a time-resolved manner. Mean for four replicates ± standard deviations are shown; a t test was performed for the last time point. (B) Matrigel invasion assay of MDA-MB-231 cells transfected with microRNA mimics. Cells were transfected, seeded in Matrigel-coated invasion plates, and stimulated to invade in the presence of TGF-β (10 ng/ml). Invaded cells were quantified by flow cytometry. (C) Viability assay of MDA-MB-231 cells. Cells were transfected with microRNA mimics or with siRNAs. Cell viability was measured using the Cell Titer Glo assay 72 h posttransfection. Viability values are normalized to control mimic for miR-200c and to siAllStar for siRNAs. (D) Wound-healing assay of MDA-MB-231 cells transfected with siRNAs. MDA-MB-231 cells were seeded in migration chambers and transfected with 40 nM siRNA. Images of the migration area were captured 0 h and 8 h after removal of the migration chamber. Migration area quantification was done as for C. (E) Effect of individual siRNAs on FHOD1 and PPM1F transcript levels. MDA-MB-231 cells were transfected with 40 nM either individual siRNAs or a pool of 4 siRNAs directed against FHOD1 or PPM1F. After 48 h, RNA was isolated, and FHOD1 and PPM1F transcript levels were quantified by qRT-PCR. ACTB and HPRT were used as housekeeping-gene controls. (F) RTCA migration assay of MDA-MB-231 cells transfected with siRNAs. MDA-MB-231 cells were transfected, starved in serum-free medium for 24 h, and seeded in RTCA CIM-16 plates. Full medium was used as a chemoattractant, and impedance measurements were performed in a time-resolved manner.
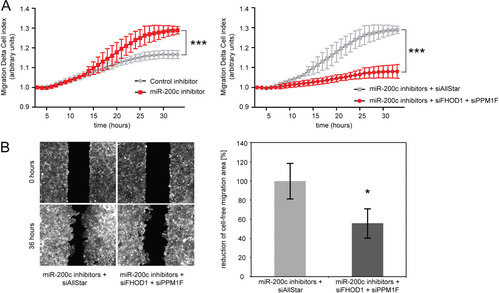
We next investigated whether simultaneous silencing of both FHOD1 and PPM1F would be sufficient to rescue the activator effect on migration induced by a miR-200c inhibitor. For this purpose, we transfected MCF-7 cells with a miR-200c hairpin inhibitor and assessed their migratory capacity in real-time migration and wound-healing assays (A and B). As expected, inhibition of miR-200c stimulated migration of MCF-7 cells. However, when FHOD1 and PPM1F were silenced in the presence of the miR-200c inhibitor, this stimulatory effect on migration was completely abrogated (A and B), highlighting the essential role of these two target genes in miR-200c-mediated regulation of migration.
Fig 8 Silencing of FHOD1 and PPM1F is sufficient to prevent the stimulatory effect of miR-200c inhibition on migration. (A) RTCA migration assay of MCF-7 cells transfected with miRNA inhibitors together with siRNAs. MCF-7 cells were transfected, starved in serum-free medium for 24 h, and seeded in RTCA CIM-16 plates. Full medium was used as a chemoattractant, and impedance measurements were performed in a time-resolved manner. Means for four replicates ± standard deviations are shown; a t test was performed for the last time point. (B) Wound-healing assay of MCF-7 cells transfected with microRNA inhibitors and siRNAs. MCF-7 cells were seeded in migration chambers and transfected with microRNA inhibitors and siRNAs. Images of the migration area were captured 0 h and 36 h after removal of the migration chamber. For migration area quantification, the cell-free areas of the pictures were defined manually and filled with black for the subsequent gray-black selection process performed by CellProfiler software (n = 5 to 8).
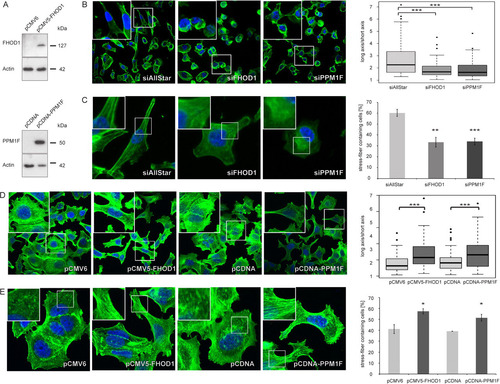
We then asked whether targeting of FHOD1 or PPM1F could also explain the observed effects of miR-200c on the actin cytoskeleton. Indeed, upon silencing of FHOD1 or PPM1F, MDA-MB-231 cells lost their elongated shape and instead adopted a rounded shape that strongly resembled that of cells overexpressing miR-200c (B). Moreover, after stimulation with TGF-β, the fraction of MDA-MB-231 cells that formed visible stress fibers was reduced by 2-fold when they were treated with siRNA against FHOD1 or PPM1F compared to results for control-transfected cells (C). In order to validate our results in a complementary approach with MCF-7 cells, we employed expression constructs for FHOD1 and PPM1F; protein expression was validated by Western blotting (A). Overexpression of either FHOD1 or PPM1F in MCF-7 cells was sufficient to induce increased cell elongation and polarization upon TGF-β treatment, mimicking the effects of miR-200c inhibition in this cell line (D). Moreover, overexpression of FHOD1 or PPM1F also increased the ability of MCF-7 cells to form stress fibers (E). Altogether, these data suggest that targeting of either FHOD1 or PPM1F by miR-200c contributes to the effects of miR-200c on migration-related processes.
Fig 9 FHOD1 and PPM1F regulate elongation and stress fiber formation of breast cancer cells. (A) Validation of FHOD1 and PPM1F overexpression constructs. MCF-7 cells were transfected with expression constructs for the FHOD1 ORF (pCMV5-HA-FHOD1), PPM1F ORF (pcDNA-Dest47-PPM1F), and respective empty vector controls for 48 h. Protein was isolated, and FHOD1 as well as PPM1F expression levels were analyzed by Western blotting. β-Actin was used as a loading control. (B) Analysis of cell elongation by fluorescence microscopy in MDA-MB-231 cells. Cells were transfected with control siRNA (siAllStar) or siRNAs directed against FHOD1 and PPM1F and fixed 24 h after transfection. Actin filaments were visualized by staining with Alexa Fluor 488-phalloidin (green) and the nucleus by staining with DAPI (blue). Cell elongation was quantified by measuring the long and short axes of cells using the Zeiss LSM Image Examiner. Box plots represent data from two independent experiments, each time measuring 40 cells per condition. (C) Stress fiber assay of MDA-MB-231 cells. Cells were transfected with siRNAs and starved for 24 h. Stress fibers were induced by treatment with TGF-β for 5 h, and cells were stained with Alexa Fluor 488-phalloidin and DAPI. The percentage of stress fiber-containing cells was determined by counting 200 to 300 cells per experiment; data shown represents means of data from three independent experiments. (D) Analysis of cell elongation by fluorescence microscopy in MCF-7 cells. Cells were transfected with expression constructs for FHOD1 or PPM1F or respective empty vectors, starved for 24 h starting 2 days after transfection, and stimulated with TGF-β for 5 h. Staining, microscopy, and image analysis were carried out as described for panel B. (E) Stress fiber assay of MCF-7 cells. Cells were transfected with expression constructs for FHOD1 or PPM1F or respective empty vectors, starved for 24 h starting 2 days after transfection, and stimulated with TGF-β for 5 h for induction of stress fibers. Staining, microscopy, and image analysis were carried out as described for panel C.
Regulation of MLC2 by miR-200c and its target genes.
Although silencing of both FHOD1 and PPM1F was sufficient to induce both a loss of polarity and elongation (), these genes are unlikely to be the sole contributors to this aspect of the miR-200c overexpression-induced phenotypes. Other target genes, namely, WAVE3 and MARCKS (Citation7, Citation38), have been proposed to also have an impact on the loss of polarity observed upon miR-200 overexpression. In contrast, the regulation of stress fibers by miR-200c via targeting of FHOD1 and PPM1F among all miR-200c target genes identified so far is unique. We thus focused our efforts on elucidating the molecular mechanisms underlying the effect of miR-200c and its target genes on stress fiber formation. FHOD1 is proposed to act as an actin nucleating protein, directly inducing the formation of actin filaments (Citation41). Besides actin nucleation, the phosphorylation of myosin light chain 2 (MLC2) at Thr18 and Ser19 is a second key process in stress fiber formation, which facilitates the assembly of myosin into bipolar filaments. Myosin filaments are shown to contribute to stress fiber formation by cross-linking actin filaments. Furthermore, they are required for stress fiber function during migration, since they provide contractile activity (Citation44).
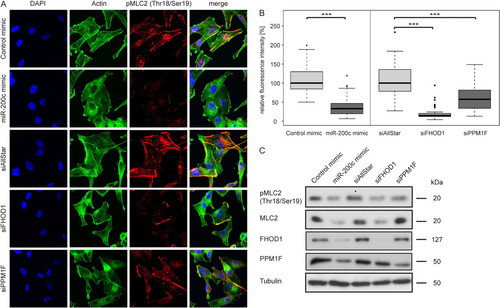
Thus, we investigated whether miR-200c and its target genes FHOD1 and PPM1F could affect MLC2 phosphorylation. For this purpose, we induced stress fibers in MDA-MB-231 cells by treatment with TGF-β after transfection with microRNA mimics or siRNAs and detected MLC2 by immunofluorescence using an antibody specific for the diphosphorylated (pThr18/pSer19) protein (A). As expected, pMLC2 colocalized with actin fibers in control cells. However, the pMLC2 signal was strongly reduced in cells transfected with miR-200c mimic. Similarly, silencing of FHOD1 or PPM1F also resulted in a decrease in pMLC2 staining. Quantification of fluorescence intensities confirmed the significance of the observed effects (B). To assess total MLC2 and phospho-MLC2 levels, we detected pMLC2 and total MLC2 by Western blotting (C). Consistent with the results from immunofluorescence analysis, transfection with miR-200c mimic resulted in a considerable reduction in pMLC2. Silencing of FHOD1 or PPM1F was sufficient to replicate this effect. We also assessed the monophosphorylated (pSer19) form of MLC2 and observed that it was also reduced by overexpression of miR-200c and by silencing of FHOD1 or PPM1F (data not shown). Interestingly, overexpression of miR-200c or silencing of FHOD1 also strongly decreased total MLC2 levels, suggesting a regulation of MLC2 expression by miR-200c and its target FHOD1. In contrast, silencing of PPM1F did not result in a reduction of total MLC2 levels, indicating that its effect is potentially due to changes in signaling pathways regulating phosphorylation of MLC2, rather than through regulation of MLC2 expression.
Fig 10 Overexpression of miR-200c or silencing of its target genes reduces MLC2 phosphorylation. (A) MDA-MB-231 cells were transfected with microRNA mimics and siRNAs for 24 h and starved for an additional 24 h. Stress fibers were induced by treatment with TGF-β for 5 h, and cells were stained for actin with Alexa Fluor 488-phalloidin (green), for pThr18/pSer19-MLC2 (pMLC2; red), and for the nucleus with DAPI (blue). (B) Quantification of pMLC2 staining. Immunofluorescence images of MDA-MB-231 cells transfected with microRNA mimics and siRNAs were acquired as described for panel A. Mean fluorescence intensities of approximately 40 cells per condition were quantified using the ImageJ software program. For representation in box plots, data were normalized to the median of control mimic or siAllStar, respectively. (C) MDA-MB-231 cells were transfected, starved and stimulated as for panel A, and protein was isolated. pThr18/pSer19-MLC2 (pMLC2), total MLC2 (MLC2), FHOD1, and PPM1F were detected by Western blotting. Tubulin was used as a loading control.
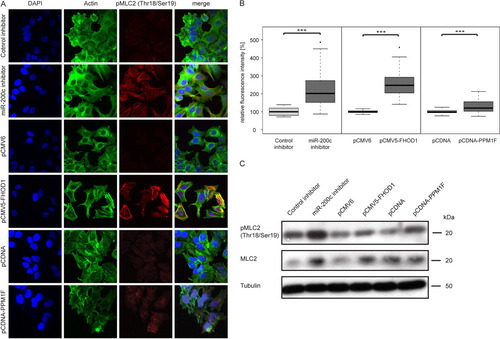
In MCF-7 cells, inhibition of miR-200c resulted in an increase in pMLC2/MLC2 levels as assessed by both immunofluorescence (A and B) and Western blotting (C). Similarly, overexpression of FHOD1 also resulted in higher levels of both total and diphosphorylated MLC2 (A to C). In contrast, overexpression of PPM1F increased only the phosphorylation of MLC2 (A to C) but not its expression (C), as shown with the knockdown experiments (). This suggests that the effect of miR-200c on MLC2 expression may be mediated primarily through targeting of FHOD1 and not PPM1F, which affects only the phosphorylation of MLC2. Altogether, these results suggest that miR-200c negatively regulates expression of MLC2 through targeting of FHOD1, leading to a concomitant decrease in the level of the active form, pMLC2.
Fig 11 Inhibition of miR-200c or overexpression of its target genes increases MLC2 phosphorylation. (A) MCF-7 cells were transfected with microRNA inhibitors or expression constructs for 24 h and starved for an additional 24 h. Stress fibers were induced by treatment with TGF-β for 5 h, and cells were stained for actin with Alexa Fluor 488-phalloidin (green), for pThr18/pSer19-MLC2 (pMLC2; red), and for the nucleus with DAPI (blue). (B) Quantification of pMLC2 staining. Immunofluorescence images of MCF-7 cells transfected with microRNA inhibitors or expression constructs were acquired as described for panel A. Mean fluorescence intensities of approximately 40 cells per condition were quantified using ImageJ. For representation in box plots, data were normalized to the median of control mimic or siAllStar, respectively. (C) MCF-7 cells were transfected, starved, and stimulated as for panel A, and protein was isolated. pThr18/pSer19-MLC2 (pMLC2) and total MLC2 (MLC2) were detected by Western blotting. Tubulin was used as a loading control.
SRF connects miR-200c and its target FHOD1 to MLC2 expression.
We next aimed to investigate the mechanism underlying the regulation of MLC2 expression by miR-200c and FHOD1. FHOD1 has been previously implicated in the regulation of serum response factor (SRF) (Citation40, Citation45, Citation46, Citation48). SRF is a key regulator of the actin cytoskeleton and contractile processes (Citation27). MLC2 is an established direct target gene of SRF, offering an attractive potential explanation for the effect of FHOD1 on MLC2 expression (Citation12, Citation26). To test the hypothesis that miR-200c and FHOD1 might regulate MLC2 expression through SRF, we first tested their effects on SRF protein levels (A). Interestingly, both overexpression of miR-200c and silencing of FHOD1 decreased SRF expression in MDA-MB-231 cells. Analysis of SRF transcript levels supported these findings, since transfection of MDA-MB-231 cells with miR-200c mimic or siRNA against FHOD1 resulted in a modest but significant decrease in SRF transcript levels (B). We then assessed whether miR-200c and its target gene FHOD1 also affected the transcriptional activity of SRF by making use of serum response element (SRE) luciferase reporter gene constructs. Overexpression of miR-200c resulted in a strong reduction of SRF activity, and this effect was mimicked by silencing of FHOD1 (C). Conversely, inhibition of miR-200c or overexpression of FHOD1 stimulated SRF transcription (D).
Fig 12 miR-200c and its target gene FHOD1 regulate SRF. (A) MDA-MB-231 cells were transfected with microRNA mimics or siRNAs. Protein was isolated 48 h after transfection, and SRF protein levels were determined by Western blotting. Tubulin was used as a loading control. (B) MDA-MB-231 cells were transfected with microRNA mimics or siRNAs for 48 h. RNA was isolated, and SRF transcript levels were determined by qRT-PCR, using HPRT and TFRC as housekeeping genes; n = 5 except for siSRF (n = 3). (C) SRF response element reporter assay with microRNA mimics and siRNAs. HEK293FT cells were cotransfected with the pGL4.34 [luc2P/SRF-RE/Hygro] reporter vector, pRL-TK vector, and microRNA mimics or siRNAs. Twenty-four hours after transfection, cells were starved for 24 h and stimulated with 10 ng/ml TGF-β1 for 6 h before cell lysis. Luciferase activity was measured and normalized to Renilla luciferase activity (n = 8). (D) SRF response element reporter assay with microRNA hairpin inhibitors and expression constructs. HEK293FT cells were cotransfected with the pGL4.34 [luc2P/SRF-RE/Hygro] reporter vector, pRL-TK vector, and microRNA hairpin inhibitors or expression constructs. SRF transcriptional activity was analyzed as described for panel C (n = 8). (E) MRTF nuclear translocation assay. MDA-MB-231 cells were transfected with miRNA mimics or siRNAs and stained for MRTF-A and nuclei (DAPI). Images for quantitative analysis at magnification ×20 were acquired and analyzed by using Olympus ScanR analysis software. Cells with a ratio of nuclear/cytoplasmic localization of MRTF-A higher than 1 were considered positive for nuclear localization, while cells with a ratio of <1 were considered negative for nuclear localization. Data shown represent fold changes in the ratio of MRTF-A nuclear localization with standard deviations.
![Fig 12 miR-200c and its target gene FHOD1 regulate SRF. (A) MDA-MB-231 cells were transfected with microRNA mimics or siRNAs. Protein was isolated 48 h after transfection, and SRF protein levels were determined by Western blotting. Tubulin was used as a loading control. (B) MDA-MB-231 cells were transfected with microRNA mimics or siRNAs for 48 h. RNA was isolated, and SRF transcript levels were determined by qRT-PCR, using HPRT and TFRC as housekeeping genes; n = 5 except for siSRF (n = 3). (C) SRF response element reporter assay with microRNA mimics and siRNAs. HEK293FT cells were cotransfected with the pGL4.34 [luc2P/SRF-RE/Hygro] reporter vector, pRL-TK vector, and microRNA mimics or siRNAs. Twenty-four hours after transfection, cells were starved for 24 h and stimulated with 10 ng/ml TGF-β1 for 6 h before cell lysis. Luciferase activity was measured and normalized to Renilla luciferase activity (n = 8). (D) SRF response element reporter assay with microRNA hairpin inhibitors and expression constructs. HEK293FT cells were cotransfected with the pGL4.34 [luc2P/SRF-RE/Hygro] reporter vector, pRL-TK vector, and microRNA hairpin inhibitors or expression constructs. SRF transcriptional activity was analyzed as described for panel C (n = 8). (E) MRTF nuclear translocation assay. MDA-MB-231 cells were transfected with miRNA mimics or siRNAs and stained for MRTF-A and nuclei (DAPI). Images for quantitative analysis at magnification ×20 were acquired and analyzed by using Olympus ScanR analysis software. Cells with a ratio of nuclear/cytoplasmic localization of MRTF-A higher than 1 were considered positive for nuclear localization, while cells with a ratio of <1 were considered negative for nuclear localization. Data shown represent fold changes in the ratio of MRTF-A nuclear localization with standard deviations.](/cms/asset/011f73e4-50b0-4bcf-8c68-383ffa31bf40/tmcb_a_12273816_f0012_oc.jpg)
It has been well established that myocardin-related transcription factors (MRTFs) function as coactivators of SRF. MRTFs are sequestered in the cytosol by monomeric G-actin, coupling SRF transcriptional activity to actin cytoskeletal dynamics (Citation28, Citation39). Furthermore, it has been proposed that FHOD1 may also regulate SRF activity through modulating intracellular G-actin levels due to its actin-nucleating activity (Citation9). To investigate this, we analyzed the intracellular localization of MRTF-A in MDA-MB-231 cells upon transfection of miR-200c mimic or siFHOD1 (E). In both cases, we observed a decrease in the nuclear localization of MRTF-A, although the results did not score as significant in the case of miR-200c overexpression (P = 0.09, two-tailed Student's t test). Next, we tested whether inhibition of SRF could explain the effect of miR-200c overexpression or FHOD1 knockdown on MLC2 expression. Silencing of SRF induced a clear reduction of pMLC2 levels in immunofluorescence experiments (A). This decrease in pMLC2 was confirmed by Western blotting (B). Moreover, knockdown of SRF also reduced total MLC2 levels, confirming that the effect on pMLC2 levels is mediated through regulation of gene expression (B). Thus, silencing of SRF phenocopies the effects of both miR-200c overexpression and FHOD1 knockdown on MLC2. Furthermore, MDA-MB-231 cells transfected with siRNA directed against SRF displayed decreased invasion in a Matrigel invasion assay (C), suggesting that regulation of SRF by miR-200c could at least partly account for miR-200c-mediated inhibition of invasive capability. Silencing of SRF showed no effect on cell viability in an MDA-MB-231 cell line model, excluding that the observed effect could be caused by cytotoxic effects of the knockdown (D). In order to examine the effect of SRF on cell migration, we first tested the knockdown efficiency of a siRNA pool and individual siRNAs. All four siRNAs directed against SRF, as well the siRNA pool, efficiently reduced SRF transcript levels (E). In real-time migration assays using MDA-MB-231 cells, both individual siRNAs directed against SRF and the pool resulted in a significant reduction of migration (F), suggesting that regulation of SRF is involved not only in invasion but also in migration as a downstream mediator of miR-200c and its target FHOD1.
Fig 13 Regulation of MLC2 by miR-200c and FHOD1 is mediated through SRF. (A) MDA-MB-231 cells were transfected with control siRNA (siAllStar) or siRNA directed against SRF for 24 h. Cells were starved for an additional 24 h, and stress fibers were induced by stimulation with 10 ng/ml TGF-β for 5 h. Cells were stained for actin with Alexa Fluor 488-phalloidin (green), for pThr18/pSer19-MLC2 (pMLC2; red), and for the nucleus with DAPI (blue). (B) MDA-MB-231 cells were treated as for panel A, and protein was isolated. SRF, pMLC (Thr18/Ser19), and MLC were detected by Western blotting, using tubulin as a loading control. (C) Matrigel invasion assay of MDA-MB-231 cells transfected with siRNAs. Cells were transfected, seeded in Matrigel-coated invasion plates, and stimulated to invade in the presence of TGF-β (10 ng/ml). Invaded cells were quantified by flow cytometry. (D) Viability assay of MDA-MB-231 cells transfected with siRNAs. Cell viability was measured using the Cell Titer Glo assay 72 h posttransfection. Viability values are normalized to control mimic for miR-200c and to siAllStar for siRNAs. (E) Effect of individual siRNAs on siSRF transcript levels. MDA-MB-231 cells were transfected with 40 nM either individual siRNAs or pools of 4 siRNAs directed against SRF. After 48 h, RNA was isolated, and SRF transcript levels were quantified by qRT-PCR. HPRT and TFRC were used for housekeeping-gene controls. (F) RTCA migration assay of MDA-MB-231 cells transfected with siRNAs directed against SRF. MDA-MB-231 cells were transfected, starved in serum-free medium for 24 h, and seeded in RTCA CIM-16 plates. Full medium was used as a chemoattractant, and impedance measurements were performed in a time-resolved manner. Means for four replicates ± standard deviations are shown; a t test was performed for the last time point. (G) Comparison of miR-200c downstream effector levels in MDA-MB-231 cells and MCF-7 cells. Total protein was isolated from MDA-MB-231 cells and MCF-7 cells. FHOD1, PPM1F, SRF, pMLC (Thr18/Ser19), and total MLC were detected by Western blotting, using tubulin as a loading control. (H) Proposed model for miR-200c-mediated regulation of stress fibers and migration/invasion. miR-200c targets FHOD1, resulting in decreased actin polymerization and thus preventing stress fiber formation. Additionally, MRTFs are sequestered in the cytosol by increasing levels of monomeric actin, resulting in inhibition of SRF transcriptional activity and decreased expression of MLC2. Phosphorylated MLC2 is a component of active myosin, which contributes to stress fiber formation and function through cross-linking of actin filaments, and by providing contractile activity. A second miR-200c target gene, PPM1F, increases phosphorylation levels of MLC2 independently of MLC2 expression, and targeting of PPM1F might thus further enhance the effect of miR-200c on stress fiber formation.
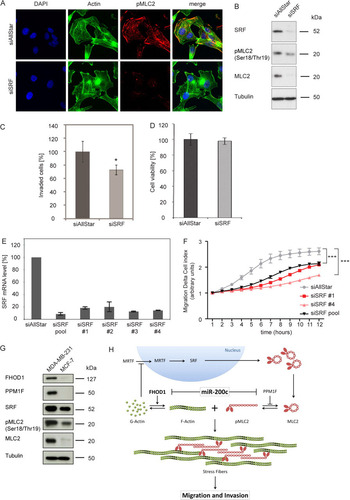
Finally, since MDA-MB-231 cells and MCF-7 cells represent cellular models of the miR-200c low/highly invasive/migratory and miR-200c high/noninvasive/less-migratory phenotypes, respectively, we then compared the expression levels of the FHOD1/PPM1F/SRF/MLC2 cellular motility axis described above in these two cell lines (G). Downstream effectors of miR-200c that promote migration, i.e., FHOD1, PPM1F, SRF, and MLC2, were consistently expressed at higher levels in MDA-MB-231 cells than in MCF-7 cells. Furthermore, levels of the phosphorylated, active form of MLC2 were also higher in MDA-MB-231 cells than in MCF-7 cells.
DISCUSSION
Changes in cell shape that are as profound as the transition from cobblestone-like epithelial cells to elongated, spindle-shaped mesenchymal cells almost invariably require remodeling of the actin cytoskeleton. Such an epithelial-mesenchymal transition precedes cell migration and metastasis in cancer but is also required during normal differentiation processes, such as mesoderm and neural tube development (Citation32). While the activity of the miR-200 family of miRNAs in relation to EMT-related phenotypes has been extensively studied (Citation13, Citation14, Citation22, Citation31), its potential contribution to the organization and dynamics of the actin cytoskeleton has mostly not been investigated thus far. Here we present the first detailed characterization of the molecular mechanisms by which miR-200c exerts effects on the actin cytoskeleton in relation to EMT-like phenotypes. Upon transfection with miR-200c mimic, MDA-MB-231 cells lost the elongated shape associated with motile, mesenchymal cells and adopted a rounded, unpolarized shape. Importantly, the acquisition of a rounded cell shape was accompanied by a loss of actin structures associated with cell polarization and perturbed stress fiber formation. These phenotypes are mediated by FHOD1 and PPM1F, which we found to be direct targets of miR-200c. Silencing of these target genes not only reduced migration and invasion of breast cancer cells in both two-dimensional (2D) and three-dimensional (3D) model systems of cancer cell motility but was also sufficient to completely abrogate the stimulatory effect of miR-200c inhibition on migration of MCF-7 cells. While some previous evidence had already linked PPM1F to invasion in breast cancer (Citation40), our study is the first to implicate FHOD1 in the promotion of cancer cell invasion. Furthermore, we have demonstrated that FHOD1 and PPM1F promote elongation, polarization, and stress fiber formation in breast cancer cells, all of which are key processes for migration and invasion. Our in vitro findings were supported by an inverse correlation of the expression levels of FHOD1 and PPM1F mRNAs with miR-200c in breast cancer specimens, breast cancer and mammary cell lines, and the cell lines of the NCI-60 panel, indicating that this effect appears to be a general mechanism rather than being restricted to specific cell types.
Investigation of the molecular mechanisms mediating the effects of miR-200c on the actin cytoskeleton revealed that both miR-200c and FHOD1 regulate the expression of MLC2. It has been reported that FHOD1 stimulates SRF-mediated transcription (Citation9, Citation25, Citation45), and our own results elaborate this in the context of miR-200c-mediated inhibition of migration and invasion. Moreover, while it had been previously suggested that this effect of FHOD1 may be due to its ability to decrease the intracellular G actin concentration and concomitant nuclear translocation of the SRF coactivator MRTF, we have demonstrated for the first time that silencing of FHOD1 indeed results in decreased nuclear localization of the SRF coactivator MRTF-A. G-actin sequesters myocardin-related transcription factors (MRTFs) in the cytoplasm, which function as SRF coactivators (Citation28, Citation39). Formins, such as mDia1, have been shown to regulate SRF through this mechanism (Citation4), and our results suggest that FHOD1, which is a formin homolog, may act in a similar way. Since SRF also stimulates its own gene transcription (Citation27), inhibition of its transcriptional activity could also explain the decreased SRF transcript and protein levels that we observed upon silencing of FHOD1. It should be noted that while we did observe a tendency for decreased nuclear localization of MRTF-A upon miR-200c overexpression, the result failed to reach significance (P = 0.09). However, the pronounced rounding of cells upon miR-200c overexpression interfered with the quantification of MRTF-A localization, and we believe that this may have impacted the result.
Taken together, our data suggest a model in which miR-200c regulates migration and invasion by inhibiting stress fiber formation that is primarily mediated via targeting of FHOD1. FHOD1 promotes stress fiber formation by activating SRF, resulting in increased expression of MLC2. Phosphorylated MLC2 then contributes to stress fiber formation and function through cross-linking of actin filaments by myosin and by providing contractile activity. Additionally, stimulation of actin nucleation by FHOD1 is expected to further contribute to stress fiber formation. Furthermore, PPM1F increases phosphorylation levels of MLC2 independent of MLC2 expression, and targeting of PPM1F by miR-200c might thus further enhance the effect of miR-200c on stress fiber formation (H). It has been previously reported that PPM1F inhibits PAK, resulting in increased phosphorylation of myosin light chain phosphatase (MYPT) at inhibitory sites (Citation19). However, our results demonstrated that while overexpression of miR-200c increased the phosphorylation of MYPT at Thr696 or at Thr853, silencing of PPM1F did not affect any phosphorylation sites on MYPT (data not shown). This suggests that yet another mechanism has to be involved. Therefore, further studies are warranted to elucidate the exact mechanism through which PPM1F regulates MLC2 phosphorylation.
It has been shown that reexpression of miR-200c in mesenchymal cell lines reverses EMT (Citation13, Citation22, Citation31). This raises the question of whether the targeting of EMT transcription factors ZEB1 and ZEB2 by miR-200c would be sufficient to explain this effect as well as the concomitant decrease in cell migration. A recent study demonstrated that while silencing of ZEB1 and ZEB2 can indeed restore E-cadherin expression in mouse mammary epithelial cells that had undergone TGF-β-induced EMT, this is not sufficient to completely reverse the mesenchymal phenotype (Citation5). Strikingly, cells failed to fully remodel their actin cytoskeleton to an epithelial organization characterized by a lack of stress fibers and the appearance of cortical actin filaments. Only the combination of ZEB knockdown with a ROCK inhibitor was able to fully reverse EMT, suggesting that interference with both ZEB transcription factors and the Rho pathway is required. Another recent study has shown that stable cell lines expressing miR-200 family members adopted an epithelial cell-like cell phenotype; however, cells stably expressing E-cadherin maintained a mesenchymal phenotype (Citation21). These findings are in line with the model of miR-200c action we propose here. While miR-200c does not influence the activation level of RhoA directly, its target genes FHOD1 and PPM1F act downstream of the RhoA signaling pathway. The best-characterized outputs of the RhoA pathway are increased actin-nucleating activity, promotion of actin-myosin assembly, stabilization of actin filaments, and activation of SRF-mediated transcription. Together, FHOD1 and PPM1F are involved in all of these processes. Our findings led us to hypothesize that miR-200c can reverse EMT by targeting both the two ZEB transcription factors and the actin cytoskeleton via FHOD1/PPM1F. Thus, we propose that miR-200c could regulate the induction and maintenance of the epithelial phenotype through two largely separate pathways that complement each other: miR-200c downregulates ZEB1 and ZEB2, resulting in an induction of epithelial molecules such as E-cadherin. This results in increased formation of stable cell-cell contacts, which impairs migration. However, this is not sufficient to fully reverse the mesenchymal phenotype, as demonstrated by the inability of ZEB1/ZEB2 knockdown to prevent stress fiber formation. Thus, miR-200c additionally targets genes involved in cytoskeletal organization, namely, FHOD1 and PPM1F, and potentially other cytoskeletal regulators, such as the already-identified target genes WAVE3 and MARKCS (Citation7, Citation38). This prevents the formation of stress fibers and cell polarization and shifts actin cytoskeletal organization toward the nonmotile, epithelial phenotype. Targeting of other regulators of cellular motility, such as moesin and fibronectin (Citation15), may further contribute to miR-200c-mediated inhibition of motility.
In conclusion, we have provided evidence that in addition to its well-established role in regulating cell-cell contacts, miR-200c also has a role in repressing breast cancer cell invasion and migration through modulation of the accompanying actin cytoskeleton reorganization during EMT. Additional studies will be required to elucidate the roles of the miR-200c targets, FHOD1 and PPM1F, during metastasis development in vivo. However, our findings already suggest that therapeutic reexpression of miR-200c, which has been proposed as a future antimetastasis treatment, may have the benefit of regulating multiple pathways involved in the regulation of metastasis, including actin cytoskeletal dynamics.
tmcb_a_12273816_sm0001.doc
Download MS Word (114 KB)ACKNOWLEDGMENTS
This work was supported by the National Genome Research Network (grants 01GS0816 and 01GS0864) of the German Federal Ministry of Education and Research (BMBF) and Wilhelm Sanderstiftung (grant 2009.051.1). J.D.Z. was supported by the DKFZ International Ph.D. Program.
We thank Moritz Küblbeck for excellent technical assistance. We also thank Oliver Fackler (Department of Virology, University Hospital Heidelberg) for kindly providing us with the pCMV5-HA-FHOD1 expression construct.
SUPPLEMENTAL MATERIAL
Supplemental material for this article may be found at http://dx.doi.org/10.1128/MCB.06212-11.
REFERENCES
- Ahmad A, et al. 2011. Phosphoglucose Isomerase/Autocrine Motility Factor mediates epithelial-mesenchymal transition regulated by miR-200 in breast cancer cells. Cancer Res. 71:3400–3409.
- Blick T, et al. 2008. Epithelial mesenchymal transition traits in human breast cancer cell lines. Clin. Exp. Metastasis 25:629–642.
- Burk U, et al. 2008. A reciprocal repression between ZEB1 and members of the miR-200 family promotes EMT and invasion in cancer cells. EMBO Rep. 9:582–589.
- Copeland JW, Treisman R. 2002. The diaphanous-related formin mDia1 controls serum response factor activity through its effects on actin polymerization. Mol. Biol. Cell 13:4088–4099.
- Das S, Becker BN, Hoffmann FM, Mertz JE. 2009. Complete reversal of epithelial to mesenchymal transition requires inhibition of both ZEB expression and the Rho pathway. BMC Cell Biol. 10:94.
- Edlund S, Landstrom M, Heldin CH, Aspenstrom P. 2002. Transforming growth factor-beta-induced mobilization of actin cytoskeleton requires signaling by small GTPases Cdc42 and RhoA. Mol. Biol. Cell 13:902–914.
- Elson-Schwab I, Lorentzen A, Marshall CJ. 2010. MicroRNA-200 family members differentially regulate morphological plasticity and mode of melanoma cell invasion. PLoS One 5:e13176.
- Enerly E, et al. 2011. miRNA-mRNA integrated analysis reveals roles for miRNAs in primary breast tumors. PLoS One 6:e16915.
- Gasteier JE, et al. 2003. Activation of the Rac-binding partner FHOD1 induces actin stress fibers via a ROCK-dependent mechanism. J. Biol. Chem. 278:38902–38912.
- Gasteier JE, et al. 2005. FHOD1 coordinates actin filament and microtubule alignment to mediate cell elongation. Exp. Cell Res. 306:192–202.
- Gibbons DL, et al. 2009. Contextual extracellular cues promote tumor cell EMT and metastasis by regulating miR-200 family expression. Genes Dev. 23:2140–2151.
- Gilles L, et al. 2009. MAL/SRF complex is involved in platelet formation and megakaryocyte migration by regulating MYL9 (MLC2) and MMP9. Blood 114:4221–4232.
- Gregory PA, et al. 2008. The miR-200 family and miR-205 regulate epithelial to mesenchymal transition by targeting ZEB1 and SIP1. Nat. Cell Biol. 10:593–601.
- Gregory PA, et al. 2011. An autocrine TGF-β/ZEB/miR-200 signaling network regulates establishment and maintenance of epithelial-mesenchymal transition. Mol. Biol. Cell. 22:1686–1698.
- Howe EN, Cochrane DR, Richer JK. 2011. Targets of miR-200c mediate suppression of cell motility and anoikis resistance. Breast Cancer Res. 13:R45.
- Hu X, et al. 2009. A miR-200 microRNA cluster as prognostic marker in advanced ovarian cancer. Gynecol. Oncol. 114:457–464.
- Hurteau GJ, Carlson JA, Roos E, Brock GJ. 2009. Stable expression of miR-200c alone is sufficient to regulate TCF8 (ZEB1) and restore E-cadherin expression. Cell Cycle 8:2064–2069.
- Iliopoulos D, et al. 2010. Loss of miR-200 inhibition of Suz12 leads to polycomb-mediated repression required for the formation and maintenance of cancer stem cells. Mol. Cell 39:761–772.
- Koh CG, Tan EJ, Manser E, Lim L. 2002. The p21-activated kinase PAK is negatively regulated by POPX1 and POPX2, a pair of serine/threonine phosphatases of the PP2C family. Curr. Biol. 12:317–321.
- Kong D, et al. 2009. miR-200 regulates PDGF-D-mediated epithelial-mesenchymal transition, adhesion, and invasion of prostate cancer cells. Stem Cells 27:1712–1721.
- Korpal M, et al. 2011. Direct targeting of Sec23a by miR-200s influences cancer cell secretome and promotes metastatic colonization. Nat. Med. 17:1101–1108.
- Korpal M, Lee ES, Hu G, Kang Y. 2008. The miR-200 family inhibits epithelial-mesenchymal transition and cancer cell migration by direct targeting of E-cadherin transcriptional repressors ZEB1 and ZEB2. J. Biol. Chem. 283:14910–14914.
- Livak KJ, Schmittgen TD. 2001. Analysis of relative gene expression data using real-time quantitative PCR and the 2(-Delta Delta C(T)) method. Methods 25:402–408.
- Lombaerts M, et al. 2006. E-cadherin transcriptional downregulation by promoter methylation but not mutation is related to epithelial-to-mesenchymal transition in breast cancer cell lines. Br. J. Cancer 94:661–671.
- Madrid R, et al. 2005. Oligomerization of the diaphanous-related formin FHOD1 requires a coiled-coil motif critical for its cytoskeletal and transcriptional activities. FEBS Lett. 579:441–448.
- Medjkane S, Perez-Sanchez C, Gaggioli C, Sahai E, Treisman R. 2009. Myocardin-related transcription factors and SRF are required for cytoskeletal dynamics and experimental metastasis. Nat. Cell Biol. 11:257–268.
- Miano JM, Long X, Fujiwara K. 2007. Serum response factor: master regulator of the actin cytoskeleton and contractile apparatus. Am. J. Physiol. Cell Physiol. 292:C70–C81.
- Miralles F, Posern G, Zaromytidou AI, Treisman R. 2003. Actin dynamics control SRF activity by regulation of its coactivator MAL. Cell 113:329–342.
- Neve RM, et al. 2006. A collection of breast cancer cell lines for the study of functionally distinct cancer subtypes. Cancer Cell 10:515–527.
- Olson P, et al. 2009. MicroRNA dynamics in the stages of tumorigenesis correlate with hallmark capabilities of cancer. Genes Dev. 23:2152–2165.
- Park SM, Gaur AB, Lengyel E, Peter ME. 2008. The miR-200 family determines the epithelial phenotype of cancer cells by targeting the E-cadherin repressors ZEB1 and ZEB2. Genes Dev. 22:894–907.
- Row RH, et al. 2011. Completion of the epithelial to mesenchymal transition in zebrafish mesoderm requires Spadetail. Dev. Biol. 354:102–110.
- Sahin O, et al. 2009. Modeling ERBB receptor-regulated G1/S transition to find novel targets for de novo trastuzumab resistance. BMC Syst. Biol. 3:1.
- Schickel R, Park SM, Murmann AE, Peter ME. 2010. miR-200c regulates induction of apoptosis through CD95 by targeting FAP-1. Mol. Cell 38:908–915.
- Shen X, et al. 2001. The activity of guanine exchange factor NET1 is essential for transforming growth factor-beta-mediated stress fiber formation. J. Biol. Chem. 276:15362–15368.
- Solly K, Wang X, Xu X, Strulovici B, Zheng W. 2004. Application of real-time cell electronic sensing (RT-CES) technology to cell-based assays. Assay Drug Dev. Technol. 2:363–372.
- Sommers CL, Byers SW, Thompson EW, Torri JA, Gelmann EP. 1994. Differentiation state and invasiveness of human breast cancer cell lines. Breast Cancer Res. Treat. 31:325–335.
- Sossey-Alaoui K, Bialkowska K, Plow EF. 2009. The miR200 family of microRNAs regulates WAVE3-dependent cancer cell invasion. J. Biol. Chem. 284:33019–33029.
- Sotiropoulos A, Gineitis D, Copeland J, Treisman R. 1999. Signal-regulated activation of serum response factor is mediated by changes in actin dynamics. Cell 98:159–169.
- Susila A, et al. 2010. The POPX2 phosphatase regulates cancer cell motility and invasiveness. Cell Cycle 9:179–187.
- Takeya R, Sumimoto H. 2003. Fhos, a mammalian formin, directly binds to F-actin via a region N-terminal to the FH1 domain and forms a homotypic complex via the FH2 domain to promote actin fiber formation. J. Cell Sci. 116:4567–4575.
- Thiery JP, Acloque H, Huang RY, Nieto MA. 2009. Epithelial-mesenchymal transitions in development and disease. Cell 139:871–890.
- Uhlmann S, et al. 2010. miR-200bc/429 cluster targets PLCgamma1 and differentially regulates proliferation and EGF-driven invasion than miR-200a/141 in breast cancer. Oncogene 29:4297–4306.
- Vicente-Manzanares M, Ma X, Adelstein RS, Horwitz AR. 2009. Non-muscle myosin II takes centre stage in cell adhesion and migration. Nat. Rev. Mol. Cell Biol. 10:778–790.
- Westendorf JJ. 2001. The formin/diaphanous-related protein, FHOS, interacts with Rac1 and activates transcription from the serum response element. J. Biol. Chem. 276:46453–46459.
- Westendorf JJ, Koka S. 2004. Identification of FHOD1-binding proteins and mechanisms of FHOD1-regulated actin dynamics. J. Cell Biochem. 92:29–41.
- Wiklund ED, et al. 2011. Coordinated epigenetic repression of the miR-200 family and miR-205 in invasive bladder cancer. Int. J. Cancer 128:1327–1334.
- Xie Y, et al. 2008. Functional interactions between phosphatase POPX2 and mDia modulate RhoA pathways. J. Cell Sci. 121:514–521.
- Yu J, et al. 2010. MicroRNA, hsa-miR-200c, is an independent prognostic factor in pancreatic cancer and its upregulation inhibits pancreatic cancer invasion but increases cell proliferation. Mol. Cancer. 9:169.