Abstract
Bone marrow samples of 30 patients with de novo adult acute myeloid leukemia (AML) were analyzed for Wt1 and FLT3‐internal tandem duplication (FLT3‐ITD) expression measured by western blot and reverse transcription‐polymerase chain reaction analysis, respectively. Wt1 was detected in 53·3% of AML patients (16/30), while FLT3‐ITD in 23·3% (7/30). The high Wt1 expression correlated with the presence of FLT3‐ITD (P = 0·014) and lower rate of complete remission (P = 0·023). The cumulative survival in AML patients was affected significantly by the presence of FLT3‐ITD, being lower in the FLT3‐ITD (+) group (6·0±2·4 months) compared to the FLT3‐ITD (−) patients (17·9±3·3; P = 0·04). The expression of FLT3‐ITD could probably activate Wt1 expression in AML blast cells and thus might contribute to its oncogenic function to provide cells with survival advantages in vivo. The detection of both molecular markers (Wt1 and/or FLT3‐ITD) may be helpful in defining high risk AML patients that need special therapeutic strategies.
Introduction
The product of Wilms’ tumor 1 (WT1) gene is a 52‐ to 54‐kDa nuclear protein that is an important regulatory molecule involved in cell growth and development. Although Wt1 protein can induce G1 arrest and apoptosis in myeloblastic leukemia cells,Citation1 it has also an anti‐apoptotic role. This is suggested by the fact that cells of the metanephric blastema, which are required for normal kidney development, fail to proliferate and undergo apoptosis in WT1−/− knockout.Citation2 Consistent with this hypothesis, Wt1 was found to inhibit p53‐mediated apoptosis and to induce the expression of antiapoptotic genes such as BCL‐2.Citation3,Citation4 It has been proposed that the anti‐apoptotic function of Wt1 may potentiate tumorigenesis by a failure of apoptotic mechanisms. Supporting this idea, Wt1 has been found to be expressed in several malignant tissues.Citation5,Citation6 Particularly, in acute myeloid leukemias (AML), WT1 transcripts might be detected in the bone marrow cells of 70–80% patients at diagnosis.Citation7–Citation9 Besides, high WT1 expression seems to be associated with unfavorable clinical outcome due to lower complete remission (CR) rates, and reduced disease‐free survival and overall survival (OS).Citation10,Citation11 High WT1 expression in AML patients have been demonstrated to be associated with FMS‐like tyrosine kinase 3 (FLT3) mutations.Citation12 FLT3, a member of the family class 3 receptor tyrosine kinases, is preferentially expressed in hematopoietic progenitor cells and mediates stem cell differentiation and proliferation.Citation13 The gene encoding FLT3 maps to chromosome band 13q12 and comprises 24 exons that span a genomic region of approximately 100 kb.Citation14,Citation15 FLT3 mutations are associated with proliferation of leukemic cells and inhibition of apoptosisCitation16,Citation17 and have been detected in about 30% of AML patients. The most frequent FLT 3 mutations are FLT3‐ITD (FLT3 – internal tandem duplication) – 23%. It has been suggested that patients bearing FLT3 ITD have significantly worse clinical outcomes.Citation18,Citation19
Since there is limited data concerning the expression level of Wt1 and FLT3 ITD in untreated de novo adult AML patients, we decided to evaluate the intracellular quantity of these molecular markers and to correlate their expression pattern at diagnosis with clinical outcome.
Patients, Materials and Methods
Patients
A total of 30 adult non‐promyelocytic patients below 60 years of age, diagnosed with de novo AML in our center between January 2005 and July 2008 were analyzed. AML was diagnosed according to criteria of the World Health Organization (WHO) classification.Citation20 The main characteristics of the patients are summarized in . Informed consent according to the criteria of the local ethical commission was obtained.
Table 1. Patients characteristics
The median age of the patients was 48 years (range, 27–59 years). Twenty patients were males and 10 females. Five patients were positive for AML1‐ETO and four for CBFB‐MYH11. Thirteen patients had normal karyotypes. Two patients had high cytogenetic risk and in six patients, no metaphases were available.
Treatment
All patients were treated according to standard chemotherapy protocols, which included two induction courses with combinations of cytosine‐arabinoside (AraC, 100 mg/m2; days 1–7); anthracycline (Idarubicin, 12 mg/m2) or epirubicin (50 mg/m2) (days 1–3); with or without etoposide (100 mg/m2; days 1–5).
Criteria for response
The induction response was assessed 10–14 days after the induction chemotherapy course. CR, partial response (PR) and resistance were defined according to the bone marrow percentage of <5, 5–25, and >25% of residual blast cells after induction therapy. Causes of therapeutic failure were subdivided into two categories: (i) refractory disease; and (ii) death less than 7 days after completion of the first induction therapy (early death) or death during induction therapy – induced bone marrow hypoplasia (hypoplastic death).Citation21
Isolation of mononuclear cells and nucleic acids
Heparin or EDTA stabilized bone marrow aspirates (30 AML patients and 4 individuals with non‐hematological diseases) or peripheral blood samples (10 healthy controls) were taken and subjected to isolation of mononuclear cells. After density gradient sedimentation using Ficoll‐Paque PLUS (Amersham Bioscience Ltd, Uppsala, Sweden) the samples were washed twice in phosphate‐buffered saline (PBS), counted using a hemocytometer and stored at −85°C.
Total RNA was isolated from mononuclear cells according to Chomczynski et al.Citation22 using TRIzol Reagent (Invitrogen, Carlsbad, CA, USA) following the manufacturer’s protocol.
Western blot
For obtaining whole cell lysates, pellets containing 2×10⁶ cells, were resuspended in buffer [0·1 M NaCl, 25 mM Tris‐HCl (pH = 8·0), 0·001 M EDTA (pH = 8·0), 25% (v/v) glycerol, 10% (v/v) beta‐mercaptoethanol, 1 mM phenylmethylsulphonyl fluoride, 50 μg/ml aprotinin, 1 mM Na3VO4, and 2 mg/ml leupeptin]. After vigorously vortexing, SDS loading buffer was added and vortexed again. Lysates were boiled for 5 minutes at 100°C and centrifuged at 13 000 revolutions/minute (13 600g) for 10 minutes at room temperature. Whole cell lysates corresponding to 300 000 cells were loaded on 12% SDS–polyacrylamide gel, separated by electrophoresis and transferred to a polyvinylidene difluoride membrane, blocked with 5% (w/v) skimmed milk in PBS and incubated for 2 hours with the primary antibodies WT1 (F‐6) mouse monoclonal: sc‐7385, diluted (1∶400) in ×1 PBS, 0·5% (w/v) skimmed milk and 0·5% (v/v) Triton X‐100. After washing four times in 1% (w/v) skimmed milk and 1% (v/v) Triton X‐100 in ×1 PBS, secondary horseradish peroxidase (HRP)‐conjugated antibodies (goat anti‐mouse IgG‐HRP: sc‐2005 and goat anti‐rabbit IgG‐HRP: sc‐2004) were added (1∶2000) and incubated for additional 45 minutes. Blots were visualized using chemiluminescence recorded on an X‐ray film. All antibodies and chemiluminescent reagent were purchased from Santa Cruz Biotechnology, Inc. (Santa Cruz, CA, USA).
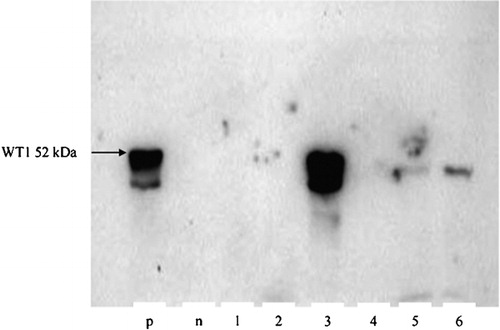
Western blot products were classified as negative (−); weakly positive (+), and strongly positive (++/+++) as indicated in .
Figure 1. Western blot detection of Wt1 expression (52 kDa). p: positive control (cell line K‐562); n: negative control (cell line U‐937); lane 1–6: samples from AML patients. Semiquantitative probe evaluation: samples 1, 2, and 4 are negative (−), samples 5 and 6 are weekly positive (+) and sample 3 is strongly positive (+++).
Reverse transcription‐polymerase chain reaction (RT‐PCR)
Complementary DNA was synthesized using 1 μg RNA in 20 μl medium containing 5 mM random hexamers (Roche Applied Science, Mannheim, Germany), ×1 first strand buffer, 5 mM MgCl2, 10 mM each of deoxynucleotides (Promega, Madison, WI, USA), 20 U RNasin and 200 U moloney murine leukemia virus reverse transcriptase (Promega) by consecutive incubation of the samples at 37°C for 1 hour and at 98°C for 3 minutes.Citation23
PCR analysis of FLT3‐ITD
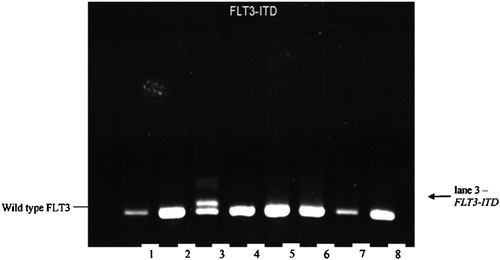
Five microliters of complementary DNA were amplified in 25 μl reaction medium, containing 200 μM each of deoxynucleotides (Promega); ×1 PCR buffer, 1·5 mM MgCl2; 0·8 U Taq polymerase (ABgene, Epsom, UK) and 0·4 pM each of primers 5′‐TGTCGAGCAGTACTCTAAACA‐3′ and 5′‐ATCCTAGTACCTTCCCAAACTC‐3′ PCR.Citation24 The reaction was done by Mastercycler Gradient (Eppendorf, Hamburg, Germany) and was started with a denaturation at 94°C for 5 minutes; proceeded with 37 cycles of denaturation at 94°C for 60 seconds; 59°C for 60 seconds; 72°C for 60 seconds; and terminated at 72°C for 10 minutes. PCR products were resolved on a 2·5% super fine resolution agarose gel (Amresco, Solon, OH, USA) stained with ethidium bromide ().
Figure 2. RT‐PCR detection of FLT3‐ITD.
Statistics
All statistical analysis was performed using the SPSS for Windows 8·0·15 software. OS was calculated from diagnosis till death. The survival curves were estimated by the Kaplan–Meier method. The log rank test was used to assess the significance of difference in survival. Comparisons were performed using Fisher’s exact test for binary variables and Mann–Whitney test for continuous variables. A value of P was considered significant when less than 0·05.
Results
Wt1 expression in healthy individuals and non‐hematologically ill patients
All 10 peripheral blood samples taken from healthy blood donors were negative for Wt1 protein expression. Three bone marrow samples taken from non‐hematologically ill patients were Wt1 negative and the fourth sample expressed Wt1 at a very low level (data not shown).
Wt1 and FLT3‐ITD expression in AML patients at diagnosis
Wt1 protein expression was detected in 16 AML patients (53·3%) and high levels were observed in nine patients (30%). Expression levels of Wt1 were not associated with absolute leukocyte count, hemoglobin level, platelet count, blast counts, sex or age. Moreover, no significant correlation of the Wt1 expression with cytogenetic characteristics of leukemias could be established ().
Table 2. Correlation of Wt1 with common cytogenetic aberrations in AML patients
FLT3‐ITD was recorded in seven patients with AML (23·3%). No significant correlation of FLT3‐ITD expression with cytogenetic aberrations was found ().
Table 3. Correlation of FLT3‐ITD with common cytogenetic aberrations in AML patients
Correlation of the Wt1 and FLT3‐ITD expression in AML patients at diagnosis
We found that 16 patients were Wt1 positive and seven patients FLT3‐ITD positive. In the cohort of cases with undetectable FLT3‐ITD, 19 of 23 (82·6%) AML patients had undetectable and low levels of Wt1. Five patients positive for FLT3‐ITD showed high Wt1 expression (71·4%) ().
Figure 3. Co‐expression of Wt1 protein and FLT3‐ITD in de novo AML patients.
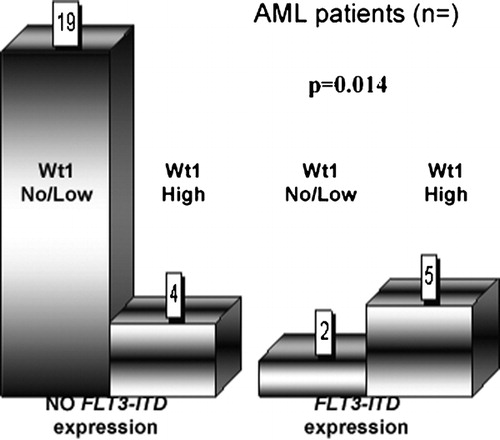
Thus statistical data analysis indicates, that FLT3‐ITD expression significantly correlates with high Wt1 expression (P = 0·014).
Influence of the expression of Wt1 and FLT3‐ITD expression on therapy response and long‐term outcome
In accordance to Galimberti et al.,Citation25 patients with Wt1 protein expression were stratified in two subgroups: one with no or low and the other with high Wt1 protein expression. Among AML patients with low or undetectable Wt1 protein levels at diagnosis (‘Wt1 negative’), therapeutic response [CR (n = 9)+PR (n = 2)] was observed in 11/21 (52·4%) patients, 7/21 (33·3%) had resistant disease and 3/21 (14·3%) died during the induction therapy. Patients with high Wt1 expression (‘Wt1 positive’), therapeutic response [PR (n = 2)] was seen in 2/9 (22·2%) patients, 6/9 (66·7%) had resistant disease and 1/9 (11·1%) died during the induction. Thus, statistically significant relationship was established between the Wt1 level of expression and the achievement of CR rate (P = 0·023).
No significant correlation of Wt1 expression with overall survival was established.
Therapeutic response [PR (n = 2)] was recorded in 2/7 (28·6%) of AML patients bearing FLT3‐ITD mutation, 4/7 (57·1%) had a resistant disease and one patient (14·3%) died during the induction therapy. Patients with no FLT3‐ITD expression achieved a therapeutic response [CR (n = 9)+PR (n = 2)] in 11/23 (47·8%), refractory disease was found in 9/23 (39·1%) and induction death was observed in 3/23 (13%) of the cases. No significant relationship could be established between the FLT3‐ITD expression and therapeutic response or rate of CR.
However, the cumulative OS of AML patients was significantly affected by the presence of FLT3‐ITD being significantly lower in FLT3‐ITD positive group (6·0±2·4 months) as compared to FLT3‐ITD negative group (17·9±3·3 months; P = 0·04) ().
Figure 4. Overall survival of all de novo diagnosed AML patients according Kaplan‐Meier calculation in relation to FLT3‐ITD expression [no FLT3‐ITD (−) versus FLT3‐ITD (+)].
![Figure 4. Overall survival of all de novo diagnosed AML patients according Kaplan‐Meier calculation in relation to FLT3‐ITD expression [no FLT3‐ITD (−) versus FLT3‐ITD (+)].](/cms/asset/6a70c478-ffce-4135-ad4e-3f83a6fc9141/yhem_a_11670689_f0004_b.jpg)
Discussion
Induction of apoptosis is the main mechanism by which many chemotherapeutic agents, used in the treatment of AML, exert their cytotoxic effect.Citation26,Citation27 Poor response to induction therapy or persistence of residual disease may be caused by resistance of leukemic blasts to induction of apoptosis. Consequently, the regulation of apoptotic or antiapoptotic pathways is of high clinical importance regarding remission induction or overcoming of drug resistance. A number of molecules are known to control cellular apoptosis machinery such as Wt1, FLT3, bcl‐2 family of proteins, etc.
In our study, we investigated the value of Wt1 and FLT3‐ITD expression, measured by western blot analysis and RT‐PCR, respectively, as potential determinants of therapeutic response and prognosis. Wt1 protein expression was detected in 53·3% of patients, whereas high levels were observed in 30% of the cohort. To our knowledge, this is the first study of Wt1 protein expression in AML patients, using western blot analysis. Similarly, using another methodological approach by immunofluorescent staining with mono‐ and polyclonal anti‐Wt1 antibodies, Menssen et al.Citation28,Citation29 obtained comparable incidence of Wt1 protein expression in the blast cell nuclei of 50–63% of acute leukemia patients without any detectable reaction in the nuclei of normal CD34+ hematopoietic progenitor cells, while Al‐Adnani et al.,Citation30 observed 40% positivity by immunohistochemistry in childhood AML. Even though data obtained by immunological approaches for the detection at protein level are very scarce as a rule they show lower incidence of the marker in acute leukemias as compared to molecular RT‐PCR‐based studies which have reported overexpression of WT1 mRNA in up to 90% of patients with AML.Citation31 The differences reported by immunological and molecular approaches can be explained by differences in the sensitivity, criteria employed to judge Wt1 protein/WT1 gene positivity or post‐translational modifications. Besides, these differences might underlie different interpretation of clinical associations and prognostic estimation.
Since the gene plays its biological role by the encoded protein, it could be suggested that data provided by protein expression assays might better discriminate leukemias with different biological behavior. Therefore, we correlated our findings concerning Wt1 protein expression with major clinical and laboratory characteristics of the patients included in the study. In line with previously reported data,Citation12 we also failed to establish any significant differences in the clinical, hematological or cytogenetic characteristics of the patients and overall survival rates, according to the presence or the absence of the Wt1 protein. However, in our study, high Wt1 protein expression levels have been clearly related to significantly lower rates of CR in AML patients (P = 0·023). This is in contrast to other studies, which did not discriminate the differences in the expression levels and failed to establish any correlation between WT1 gene expression and the therapeutic response or survival rates.Citation32
Insights into the regulation of Wt1 expression are essential for understanding the role that Wt1 plays during normal and abnormal development. Various factors have been shown to modulate the expression of the WT1 including FLT3 mutations.Citation12 FLT3 mutations are associated with proliferation of leukemic cells and inhibition of apoptosis, the most frequent of them are FLT3‐ITD.
In our study, FLT3‐ITD mutations have been detected in 23·3% of AML patients. Although no significant relationship could be established between the FLT3‐ITD expression and therapeutic response or rate of CR, the absence of this molecular marker is associated with longer overall survival (P = 0·04). This is in line with several previously published studies.Citation33–Citation35
As expected, a significant correlation between FLT3‐ITD and high Wt1 expression was observed (P = 0·014). Since FLT3‐ITD and Wt1 are apoptosis downregulating molecular markers, we can speculate that their combination could result in augmented proliferation and differentiation failure as well as inhibition of programmed cell death and this might explain the lack of CR in patients with simultaneous expression of FLT3‐ITD and Wt1.
In two (28·6%) cases, however, we did not find any Wt1 expression despite presence of FLT3‐ITD, who presented also with unfavorable therapeutic response. The absence of Wt1‐expression in the presence of FLT3‐ITD might be explained partially by possible silencing of the Wt1 expression by WT1 gene mutations. King‐Underwood and Pritchard‐JonesCitation36 reported that WT1 gene mutations occur in 14% of AML patients and that the presence of a WT1 mutation is associated with failure to achieve CR and lower survival rates.
In conclusion, to our knowledge, this is the first reported study of Wt1‐protein expression in association with FLT3‐ITD, measured by western blotting and RT‐PCR analysis, respectively, in patients with de novo AML. The presence of FLT3‐ITD and/or high Wt1‐expression level at diagnosis is a poor prognostic indicator. The detection of both molecular markers (Wt1 and/or FLT3‐ITD) may be helpful in defining high‐risk AML patient groups that need special modified therapeutic strategies.
The study was supported by the National Science Fund, Bulgarian Ministry of Education and Science (Grant VU‐L‐203/06).
References
- Murata Y, Kudoh T, Sugiyama H, Toyoshima K, Akiyama T. The Wilms tumor suppressor gene WT1 induces G1 arrest and apoptosis in myeloblastic leukemia M1 cells. FEBS Lett 1997;409:41–5
- Kreidberg JA, Sariola H, Loring JM, Maeda M, Pelletier J, Housman D, et al.. WT-1 is required for early kidney development. Cell 1993;74:679–91
- Maheswaran S, Englert C, Bennett P, Heinrich G, Haber DA. The WT1 gene product stabilizes p53 and inhibits p53-mediated apoptosis. Genes Dev 1995;9:2143–65
- Mayo MW, Wang CY, Drouin SS, Madrid LV, Marshall AF, Reed JC, et al.. WT1 modulates apoptosis by transcriptionally upregulating the bcl-2 proto-oncogene. EMBO J 1999;18:3990–4003
- Hirose M. The role of Wilms’ tumor genes. J Med Invest 1999;46:130–40
- Reddy JC, Licht JD. The WT1 Wilms’ tumor suppressor gene: how much do we really know? Biochim Biophys Acta 1996;1287:1–28
- Miwa H, Beran M, Saunders GF. Expression of the Wilms’ tumor gene (WT1) in human leukemias. Leukemia 1992;6:405–9
- Brieger J, Weidmann E, Fenchel K, Mitrou PS, Hoelzer D, Bergmann L. The expression of the Wilms’ tumor gene in acute myelocytic leukemias as a possible marker for leukemic blast cells. Leukemia 1994;8:2138–43
- Brieger J, Weidmann E, Maurer U, Hoelzer D, Mitrou PS, Bergmann L. The Wilms’ tumor gene is frequently expressed in acute myeloblastic leukemias and may provide a marker for residual blast cells detectable by PCR. Ann Oncol 1995;6:811–6
- Bergmann L, Miething C, Maurer U, Brieger J, Karakas T, Weidmann E, et al.. High levels of Wilms’ tumor gene (wt1) mRNA in acute myeloid leukemias are associated with a worse long-term outcome. Blood 1997;90:1217–25
- Inoue K, Sugiyama H, Ogawa H, Nakagawa M, Yamagami T, Miwa H, et al.. WT1 as a new prognostic factor and a new marker for the detection of minimal residual disease in acute leukemia. Blood 1994;84:3071–9
- Barragán E, Cervera J, Bolufer P, Ballester S, Martín G, Fernández P, et al.. Prognostic implications of Wilms’ tumor gene (WT1) expression in patients with de novo acute myeloid leukemia. Haematologica 2004;89:926–33
- Lyman SD, Jacobsen SE. c-Kit ligand and Flt3 ligand: stem/progenitor cell factors with overlapping yet distinct activities. Blood 1998;91:1101–34
- Abu-Duhier FM, Goodeve AC, Wilson GA, Care RS, Peake IR, Reilly JT Genomic structure of human FLT3: implications for mutational analysis. Br J Haematol 2001;113:1076–7
- Agne’s F, Shamoon B, Dina C, Rosnet O, Birnbaum D, Galibert F. Genomic structure of the downstream part of the human FLT3 gene: exon/ intron structure conservation among genes encoding receptor tyrosine kinases (RTK) of subclass III. Gene 1994;145:283–8
- Drexler HG. Expression of FLT3 receptor and response to FLT3 ligand by leukemic cells. Leukemia 1996;10:588–99
- Lisovsky M, Estrov Z, Zhang X, Consoli U, Sanchez-Williams G, Snell V, et al.. FLT3 ligand stimulates proliferation and inhibits apoptosis of acute myeloid leukaemia cells: regulation of Bcl-2 and Bax. Blood 1996;88:3987–97
- Rombouts WJ, Blokland I, Löwenberg B, Ploemacher RE. Biological characteristics and prognosis of adult acute myeloid leukemia with internal tandem duplications in the Flt3 gene. Leukemia 2000;14:675–83
- Abu-Duhier FM, Goodeve AC, Wilson GA, Gari MA, Peake IR, Rees DC, et al.. FLT3 internal tandem duplication mutations in adult acute myeloid leukaemia define a high-risk group. Br J Haematol 2000;111:190–5
- Jaffe ES, Harris NL, Stein H, Vardiman JW. World Health Organization classification of tumors. Pathology and genetics of tumors of haemotopoietic and lymphoid tissues. Lyon: IARC Press; 2001
- Schlenk RF, Benner A, Hartmann F, del Valle F, Weber C, Pralle H, et al.. Risk-adapted postremission therapy in acute myeloid leukemia: results of the German multicenter AML HD93 treatment trial. Leukemia 2003;17:1521–8
- Chomczynski P, Sacchi N. Single-step method of RNA isolation by acid guanidinium thiocyanate-phenol-chloroform extraction. Anal Biochem 1987;162:156–9
- van Dongen JJ, Macintyre EA, Gabert JA, Delabesse E, Rossi V, Saglio G, et al.. Standardized RT-PCR analysis of fusion gene transcripts from chromosome aberrations in acute leukemia for detection of minimal residual disease. Report of the BIOMED-1 Concerted Action: investigation of minimal residual disease in acute leukemia. Leukemia 1999;13:1901–28
- Nakao M, Yokota S, Iwai T, Kaneko H, Horiike S, Kashima K, , et al.. Internal tandem duplication of the flt3 gene found in acute myeloid leukemia. Leukemia 1996;10:1911–8
- Galimberti S, Guerrini F, Carulli G, Fazzi R, Palumbo GA, Morabito F, et al.. Significant co-expression of WT1 and MDR1genes in acute myeloid leukemia patients at diagnosis. Eur J Haematol 2004;72:45–51
- Gorczyca W, Bigman K, Mittelman A, Ahmed T, Gong J, Melamed MR, et al.. Induction of DNA strand breaks associated with apoptosis during treatment of leukemias. Leukemia 1993;7:659–70
- Bhalla K, Ibrado AM, Tourkina E, Tang C, Grant S, Bullock G, et al.. High-dose mitoxantrone induces programmed cell death or apoptosis in human myeloid leukemia cells. Blood 1993;82:3133–40
- Menssen HD, Renkl HJ, Rodeck U, Maurer J, Notter M, Schwartz S, et al.. Presence of Wilms’ tumor gene (wt1) transcripts and the WT1 nuclear protein in the majority of human acute leukemias. Leukemia 1995;9:1060–7
- Menssen HD, Renkl HJ, Rodeck U, Kari C, Schwartz S, Thiel E. Detection by monoclonal antibodies of the Wilms’ tumor (WT1) nuclear protein in patients with acute leukemia. Int J Cancer 1997;70:518–23
- Al-Adnani M, Williams S, Anderson J, Ashworth M, Malone M, Sebire NJ. Immunohistochemical nuclear positivity for wt1 in childhood acute myeloid leukemia. Fetal Pediatr Pathol 2007;26:193–7
- Cilloni D, Gottardi E, de Micheli D, Serra A, Volpe G, Messa F, et al.. Quantitative assessment of WT1 expression by real time quantitative PCR may be a useful tool for monitoring minimal residual disease in acute leukemia patients. Leukemia 2002;16:2115–21
- Schmid D, Heinze G, Linnerth B, Tisljar K, Kusec R, Geissler K, et al.. Prognostic significance of WT1 gene expression at diagnosis in adult de novo acute myeloid leukemia. Leukemia 1997;11:639–43
- Frohling S, Schlenk RF, Breitruck J, Benner A, Kreitmeier S, Tobis K, et al.. Prognostic significance of activating FLT3 mutations in younger adults (16–60 years) with acute myeloid leukemia and normal cytogenetics: a study of the AML Study Group Ulm. Blood 2002;100:4372–80
- Kottaridis PD, Gale RE, Frew ME, Harrison G, Langabeer SE, Belton AA, et al.. The presence of a FLT3 internal tandem duplication in patients with acute myeloid leukemia (AML) adds important prognostic information to cytogenetic risk group and response to the first cycle of chemotherapy: analysis of 854 patients from the United Kingdom Medical Research Council AML 10 and 12 trials. Blood 2001;98:1752–9
- Whitman SP, Archer KJ, Feng L, Baldus C, Becknell B, Carlson BD, et al.. Absence of the wild-type allele predicts poor prognosis in adult de novo acute myeloid leukemia with normal cytogenetics and the internal tandem duplication of FLT3: a cancer and leukemia group B study. Cancer Research 2001;61:7233–9
- King-Underwood L, Pritchard-Jones K. Wilms’ tumor (WT1) gene mutations occur mainly in acute myeloid leukemia and may confer drug resistance. Blood 1998;91:2961–8