Abstract
In order to investigate the features of T-cell immune status in human placenta, the expression levels of CD3-gamma, -delta, -epsilon and -zeta chain genes in placenta were analyzed by real-time PCR. Umbilical cord blood obtained at delivery from the full-term healthy babies was used as a control. The beta2-microglobulin gene was employed as an endogenous reference, and the evaluations of mRNA expression level of each CD3 gene were used by the ×100% method. The expression level of CD3-gamma, -epsilon and -zeta genes (mean rank is 0·13, 0·34, and 0·49 respectively) from placenta were significantly lower than those from CB (P<0·0001). CD3-delta genes (mean rank is 5·71) expressed stronger from placenta than from CB (P = 0·0·895). Thus, the expression pattern of the four CD3 genes was presented as delta>zeta>epsilon> gamma from placenta and epsilon>gamma>zeta>delta from CB on the contrary. In conclusion, the present study characterized the expression pattern of CD3-gamma, -delta, -epsilon and -zeta chain genes from placenta, which contributes to further understanding of the features of T-cell immune status in placenta.
Introduction
The embryo is a semi-allograft for a pregnant woman. Therefore, whether the immune cells in maternal immune system recognize and tolerate the embryonic antigen may directly influence the establishment and maintenance of pregnancy. Much progress has been made in the understanding of the immune mechanisms by which fetus evades matrix immunologic rejection. As some of the salient features of the complicated relationship between the maternal immune system and the fetus are revealed, it is accepted that multiple mechanisms from the mother and the fetus contribute to the development and maintenance of tolerance and immune privilege.Citation1 However, the integrity mechanism has not yet been entirely elucidated in humans.
There is evidence that decidual lymphocytes play a major role in local interactions at the fetal/maternal interface. Although decidual T cells constitute less than 20% of lymphocyte population, their presence in decidual immunocyte infiltration rises along with gestation period.Citation2 Therefore, the study of the immune state of T cells in the maternal/fetal interface can help to explore the mechanisms of immune tolerance during normal pregnancy and pathological pregnancy. Several studies described that the feature of T-cell activation, T-cell repertoire in the decidual parieralis and placental trophoblasts.Citation3,Citation4 Little is known the activation signal factor in placenta.
The CD3 complex plays a key role in T-cell receptor (TCR) signal transduction. In addition to signal transduction, the CD3 complex composed four transmembrane proteins, named CD3-gamma, CD3-delta, CD3-epsilon and CD3-zeta respectively.Citation5,Citation6 They are known to form three distinct dimers: CD3-gamma epsilon, CD3-delta epsilon and CD3-zeta zeta.Citation7,Citation8 The CD3 components functions crucially in the receptor complex assembly, stability, and transport to the cell surface as well as ligand-induced surface receptor internalization.Citation9 Our previous study showed the different expression pattern of CD3 genes in cord blood which may be one of the feature responsible for the low allo-reactivity of CB T cells.Citation10 To elucidate the characteristics of TCR signals transduction of T cells in placenta, we investigate the expression level and pattern in all of four CD3 complex genes from placenta tissue.
Material and Methods
Samples
Nine Placenta tissue samples were obtained from full-term delivery. Umbilical cord blood was obtained at the same time from the full-term healthy babies with the mother’s consent and served as control. All human tissue or cell samples were obtained with consent from the human subjects. All the procedures were conducted according to the guidelines of the Medical Ethics Committees of the Health Bureau of Guangdong Province of China. T-cell lines (Molt-3, Molt-4, Jurkat and CCRF) and B-cell line: Raji cells were used as controls.
Mononuclear cells isolation
Mononuclear cells were isolated from umbilical cord blood samples (CB MCs) by Ficoll-Hypaque gradient centrifugation.
RNA isolation and cDNA synthesis
The placenta tissue (about 100 mg) was obtained by curettage of central part of placenta (decidua in majority). After washing with phosphate buffer saline, the placenta tissue was ground. RNA was extracted from the placenta tissue and CBMCs using a Trizol RNA extraction buffer according to the manufacturer’s protocol (Trizol, Invitrogen, Carlsbad, CA, USA). The quality of RNA was analyzed in 0·8% agarose gel stained with ethidium bromide. Two μg RNA was reversely transcribed into the first single-stranded cDNA with random hexamer primers, using reverse transcriptase, of the Superscript III™ (Invitrogen). The quality of cDNA was confirmed by RT-PCR for beta2 microglobulin (beta2M) gene amplification.
Real-time relative quantitative PCR for CD3-gamma, -delta, -epsilon and -zeta genes
Real-time PCR with SYBR Green I technique was used to examine CD3-gamma, -delta, -epsilon and -zeta genes expression level in cDNA of T cells from placenta and CBMCs. The beta2-microglobulin gene was used as an endogenous reference, and the fold-change of CD3-gamma, -delta, -epsilon and -zeta genes expression level were used by the ×100% method. The primers were purchased from Shanghai Invitrogen Biotechnology Co., Ltd (Shanghai, China) as description in our previous study.Citation10 PCR was performed according to Stams WAG which was described in our previous study.Citation11 In brief PCR of 25 μl total volume was performed with approximately 1 μl cDNA, 0·5 μM of each primers (CD3-gamma, -delta, -epsilon, -zeta for and CD3-gamma, -delta, -epsilon, -zeta-back primers for CD3-gamma, CD3-delta, CD3-epsilon and CD3-zeta genes respectively, beta2M-forward and beta2M-backward primers for beta2-microglobulin gene amplification), 2·5×RealMastrMix 11·25 μl (Tiangen, Beijing, China). After the initial denaturation at 95°C for 2 minutes, 45 cycles consisting of 95°C 15 seconds, 58·9°C for beta2M and CD3-gamma, 60°C for CD3-zeta, 60·8°C for CD3-delta and 62°C for CD3-epsilon 1 minute were performed using MJ Research DNA Engine Opticon 2 PCR cycler (BIO-RAD, Hercules, CA, USA). The efficiencies of real-time PCR for expression analysis of different genes was evaluated by diluted Molt-4 cDNA (1, 10−1, 10−2, 10−3, and 10−4) as template making relative standard curves. The specific amplification of PCR products was analyzed by melting curve and agarose electrophoresis.Citation12 The relative mRNA expression level of CD3-gamma, -delta, -epsilon and -zeta genes in each sample was calculated using the comparative cycle time (Ct) method.Citation11 Briefly, the target PCR Ct value, that is, the cycle number at which emitted fluorescence exceeds the 10×SD of baseline emissions, is normalized by subtracting the beta2M Ct value from the target PCR Ct value, which gives the ΔCt value. From this ΔCt value, the relative expression level to beta2M for each target PCR can be calculated using the following equation: relative mRNA expression =
×100% [ΔCt = Ct(CD3x)−Ct(beta2M)] (x: anyone of CD3-gamma, -delta, -epsilon or -zeta gene).Citation13
RT-PCR and sequencing
RT-PCR for every CD3 genes was performed using the same primers as described, and the PCR-products were directly sent to Shanghai Invitrogen Biotechnology Co. to analyze the DNA sequence.
Statistical analysis
Differences in mRNA expression between two groups were analyzed using the Mann-Whitney test. Data are presented as mean rank. Kruskal-Wallis test was used for comparison of different gene expression levels from different CD3 chain. Spearman’s rank correlation was used to estimate the correlation between different gene expression levels from different CD3 genes. Only values with P<0·05 were considered as statistically significant.
Results
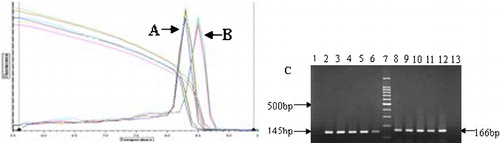
In order to establish the proper real-time quantitative PCR fluorescence reaction condition, we used diluted Molt-4 cDNA as template making relative standard curves. The results showed the high amplification efficiency of four CD3 genes were successful in consistent with that of beta2M reference gene, the efficiencies from four CD3 gene were similar [CD3-gamma: y = 0·047log(x)−0·321, R2 = 0·092; CD3-delta: y = 0·091log(x)+0·563, R2 = 0·081; CD3-epsilon: y = 0·010log(x)−1·38, R2 = 0·005; and CD3-zeta: y = 0·080log(x)+6·963; R2 = 0·038) (). The specific amplification of PCR products was confirmed by melting curve and agarose electrophoresis, single peak melting curve and expected PCR products were showed ().
Figure 1. Validation of the methods. The efficiency of amplification of the target gene (CD3-zeta) and internal control (beta2M) was examined suing real-time PCR. (A) Dilution sample beta2M amplification curve; (B) Dilution sample CD3-zeta gene amplification curve; (C) The results of efficiency of amplification. The ΔCt [Ct(CD3-zeta)−Ct(beta2M)] was calculated for each cDNA dilution. The data were fit using least-squares liner regression analysis.
![Figure 1. Validation of the methods. The efficiency of amplification of the target gene (CD3-zeta) and internal control (beta2M) was examined suing real-time PCR. (A) Dilution sample beta2M amplification curve; (B) Dilution sample CD3-zeta gene amplification curve; (C) The results of efficiency of amplification. The ΔCt [Ct(CD3-zeta)−Ct(beta2M)] was calculated for each cDNA dilution. The data were fit using least-squares liner regression analysis.](/cms/asset/3871ab37-93dd-4b96-a66a-54ac77b29bf9/yhem_a_11711563_f0001_b.jpg)
Figure 2. The results of melting curve and agarose electrophoresis from amplification of real-time PCR products. (A) beta2M gene melting curve; (B) CD3-zeta gene melting curve; (C) 2–6: PCR products of beta2M gene (145 bp); 7: 100 bp DNA ladder; 8–12: PCR products of CD3-zeta gene (166 bp); 1,13: negative controls.
The expression levels of CD3-gamma, CD3-delta, CD3-epsilon and CD3-zeta genes were quantitatively assessed by real-time PCR with SYBR Green I technique in cDNA of T cells from both samples, as well as T-cell lines and B-cell lines. All of the four genes could be detected in every sample. The PCR products from all of the four genes were randomly sent to sequence, and the sequencing results were confirmed by blast analysis as compared with data from genebank (data not shown).
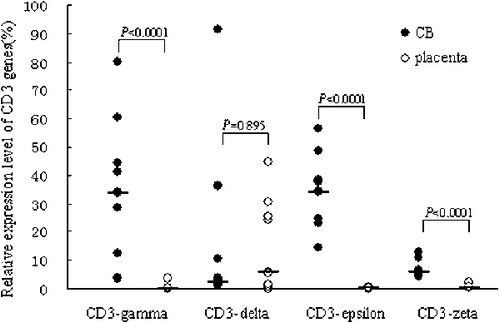
The relative mRNA expression levels of CD3-gamma, -epsilon and -zeta chain genes (mean rank is 0·13, 0·34, and 0·49) from placenta were significantly lower than those from CB (mean rank is 33·92, 34·15, and 5·75) (). The expression level of CD3-delta chain gene (mean rank is 5·71) from placenta was higher than that from CB (mean rank is 2·52), but there was no significant difference between the both sources from placenta and CB.
Figure 3. The relative expression of CD3 genes in placenta and CBMCs (CB) groups.
The results of relative mRNA expression levels of all four CD3 genes in T-cell lines and Raji cell line are listed in . Different expression levels of four CD3 genes were showed in different T-cell lines; however, the lowest expression level of CD3-zeta is the common feature in all T-cell lines. Generally, B cells do not express CD3 genes. These results indicated that four CD3 gene could be nearly detected in B-cell line Raji cells.
Table 1. The expression levels of CD3 genes in T- and B-cell lines
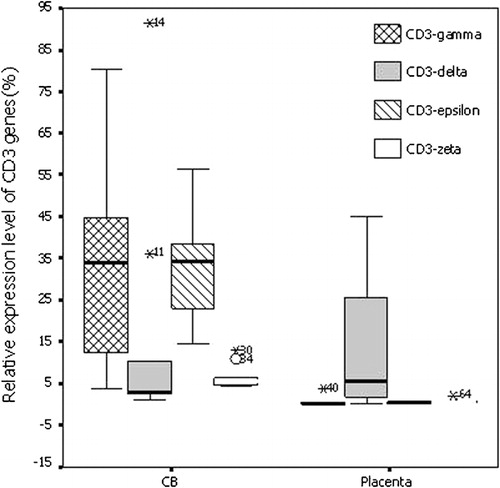
The expression pattern of the four CD3 chains arranged in order along delta>zeta>epsilon>gamma in placenta tissue, in contrast, the CD3 gene expression pattern from CB was presented in epsilon>gamma> zeta>delta (). In T-cell line, the expression pattern seems to be also different, the common feature was the lowest expression level of CD3-zeta in all T-cell lines.
Figure 4. The average expression level of CD3 genes in placenta and CBMCs (CB). *P<0·05, compared to the relative expression level of CD3 chain genes from CB.
Correlation analysis was performed among the relative expression levels of CD3-gamma, -delta, -epsilon and -zeta chain genes respectively. The results showed that no significant correlation was observed among the relative expression levels of the four CD3 genes in both placenta and CB using the Spearman’s rank correlation analysis.
Discussion
For many years, reproductive immunology has been dominated by the ‘Th1/Th2’ hypothesis, in which the fetus avoids maternal T-cell rejection through a bias towards T-helper (Th)2 cytokine production.Citation14 However, we are not even aware of the expression pattern of CD3-gamma, CD3-delta, CD3-epsilon, and CD3-zeta.
Despite of the long standing acceptance of the TCRs role in antigen recognition and signal transduction, the parts played by the invariant CD3-gamma, -delta, -epsilon, and -zeta chains remain to be clarified. CD3-zeta due to its immunoreceptor tyrosine-based activation motif (ITAM) richness is thought to be the dominant signaling component of TCR/CD3 complex.Citation15 CD3-epsilon chain possessing ITAMs are capable of effecting T-cell activation in a cumulative manner, but are also capable of coupling the TCR complex to specific adaptor molecules such as Nck and CD3-epsilon-associated signal transducer, to likely initiate distinct activation pathways.Citation16 CD3-delta has been shown to couple the TCR to the extracellular signal related kinase.Citation17,Citation18 It has been suggested that CD3-gamma provides T cell specifically activating functions involved in T-cell adhesion and IL-2 production.Citation19
To gain more insight into the transduction of TCR signals, which is important for the activation of T cells, the expression level of all of the four CD3 genes in placenta tissue was analyzed. Our result shows that there was no significant difference in CD3-delta expression between placenta and CB, but the relative mRNA expression levels of CD3-gamma, -epsilon and -zeta chain genes from placenta were significantly lower than those from CB. It was reported that down-regulation of CD3-zeta expression results in uncoupling of the TCR signal transduction pathways and functional T-cell hyporesponsiveness.Citation20 One deficiency among CD3-gamma, CD3-delta and CD3-epsilon has been found in patients with primary immunodeficiency diseases.Citation8 Thus lower expression of CD3 genes in placenta tissue might relate to the low activity of TCR-mediated signals, indicating that this might be one of the mechanisms responsible for immune tolerance during normal pregnancy.
Although T-cell hypo-responsiveness associated with down-regulated CD3-zeta chain has been observed in a variety of disease manifestation, the molecular mechanisms leading to the down-regulation of one of the main TCR signaling chains and the associated immune suppression have not yet completely elucidated. It was reported that the T-cell hypo-responsiveness in human pregnancy was related to the arginase activity.Citation21 During immune responses, consumption of L-arginine by arginase induces down-regulation of CD3-zeta chain expression in activated T cells.Citation22,Citation23 It was also revealed that the T-cell hypo-responsiveness in human pregnancy was reversible and that T cells in the placenta retained their capacity to respond to stimulation.Citation20
The expression patterns of all CD3 genes have not been described in the literature so far, and here we reported for the first time the expression patterns of four CD3 chains with delta>zeta>epsilon>gamma in placenta tissue, and significant difference was found in CB T cells, in which the CD3 gene expression pattern was presented as epsilon>gamma>zeta>delta. However, the biological significance of the differences observed between placenta and CB remains obscure at present, and whether the present gene expression pattern is the typical pattern remains unclear either.
In conclusion, the present study provides a global gene expression profiling of CD3-gamma, -delta, -epsilon and -zeta chains in placenta tissue. To our best knowledge, these data are the first attempt of analyzing expression of these genes in placenta, which was expected to provide a better understand and genetic information on the cellular immune feature in placenta.
The study was supported by grants from Key project of Natural Science Foundation of Guangdong province, China (No. 9251063201000001).
References
- Hunt JS, Petroff MG, McIntire RH, Ober C. HLA-G and immune tolerance in pregnancy. FASEB J 2005;19:681–93.
- Vassiliadou N, Bulmer JN. Characterization of endometrial T lymphocyte subpopulations in spontaneous early pregnancy loss. Hum Reprod 1998;13:44–7.
- Sindram-Trujillo A, Scherjon S, Kanhai H, Roelen D, Claas F. Increased T-cell activation in decidua parietalis compared to decidua basalis in uncomplicated human term pregnancy. Am J Reprod Immunol 2003;49:261–8.
- Shao L, Jacobs AR, Johnson VV, Mayer L. Activation of CD8+ regulatory T cells by human placental trophoblasts. J Immunol 2005;174:7539–47.
- Call ME, Wucherpfenning KW. The T cell receptor: critical role of the membrane environment in receptor assembly and function. Annu Rev Immunol 2005;23:101–25.
- Clevers H, Alarcon B, Wileman T, Terhorst C. The T cell receptor/CD3 complex: a dynamic protein ensemble. Annu Rev Immunol 1988;6:629–62.
- Call ME, Pyrdol J, Wucherpfenning KW. Stoichiometry of the T-cell receptor-CD3 complex and key intermediates assembled in the endoplasmic reticulum. EMBO J 2004;23:2348–57.
- Arnett KL, Harrison SC, Wiley DC. Crystal structure of a human CD3-epsilon/delta dimmer in complex with a UCHT1 single-chain antibody fragment. Proc Natl Acad Sci USA 2004;101:16268–73.
- Michael AA, Nicholas M. Hypothesis: TCR signal transduction—A novel tri-modular signaling system. Mol Immunol 2008;45;876–80.
- Chen S, Yang L, Lu X, Li B, Chan JYH, Cai D, et al.. Gene expression profiling of CD3γ, δ, ϵ and ζ chains in CD4+ and CD8+ T-cells from human umbilical cord blood. Hematology 2010;15:230–5.
- Li Y, Chen S, Yang L, Li B, Chan JYH, Cai D. TRGV and TRDV repertoire distribution and clonality of T cells from umbilical cord Blood. Transpl Immunol 2009;20:155–62.
- Livak KJ, Schmittgen TD. Analysis of relative gene expression data using real-time quantitative PCR and the 2(-Delta Delta C(T)) Method. Methods 2001;25:402–8.
- Stams WAG, den Boer ML, Beverloo HB, Meijerink JPP, Stigter RL, van Wering ER, et al.. Sensitivity to L-asparaginase is not associated with expression levels of asparagine synthetase in t(12;21)+ pediatric ALL. Blood 2003;101:2743–7.
- Wegmann TG, Lin H, Guilbert L, Mosmann TR. Bidirectional cytokine interactions in the maternal-fetal relationship: is successful pregnancy a TH2 phenomenon? Immunol Today 1993;14:353–6.
- Li Y. Alterations in the expression pattern of TCR ζ chain in T cells from patients with hematological diseases. Hematology 2008;13:267–75.
- Szymczak AL, Workman CJ, Gil D, Dilioglou S, Vignali KM, Palmer E, et al.. The CD3ϵ proline-rich sequence, and its interaction with Nck, is not required for T cell development and function. J Immunol 2005;175:270–5.
- Delgado P, Fernandez E, Dave V, Dietmar K, Alarcon B. CD3δ couples T-cell receptor signalling to ERK activation and thymocyte positive selection. Nature 2000;406:426–30.
- Werlen G, Hausmann B, Palmer E. A motif in the ab T-cell receptor controls positive selection by modulating ERK activity. Nature 2000;406:422–6.
- Torres PS, Zapata DA, Pacheco-Castro A, Rodriguez-Fernandex JL, Cabanas C, Regueiro JR. Contribution of CD3g to TCR regulation and signaling in human mature T lymphocytes. Int Immunol 2002;14:1357–67.
- Baniyash M. TCR zeta-chain downregulation: curtailing an excessive immune response. Nat Rev Immunol 2004;4:675–87.
- Kropf P, Baud D, Marshall SE, Munder M, Mosley A, Fuentes JM, et al.. Arginase activity mediates reversible T cell hyporesponsiveness in human pregnancy. Eur J Immunol 2007;37:935–45.
- Rodriguez PC, Zea AH, DeSalvo J, Culotta KS, Zabaleta J, Quiceno DG. L-Arginine consumption by macrophages modulates the expression of CD3ζ chain in T lymphocytes. J Immunol 2003;171:1232–9.
- Bronte V, Zanovello P. Regulation of immune responses by L-arginine metabolism. Nat Rev Immunol 2005;5:641–54.