Abstract
Thrombin and plasmin are the key enzymes involved in coagulation and fibrinolysis. A novel hemostasis assay (NHA) was developed to measure thrombin and plasmin generation in a single well by a fluorimeter. The NHA uses two fluorescent substrates with non-interfering fluorescent excitation and emission spectra. The assay was tested in vitro using modulators like heparin, hirudin, epsilon-aminocaproic acid, gly-pro-arg-pro peptide and reptilase and validated by measurement of prothrombin fragment 1+2 and plasmin-alpha2-antiplasmin levels. Intra- and inter-assay coefficients of variation were <9% and 6–25%, respectively. Interplay between coagulation and fibrinolysis was demonstrated by the effect of tissue-type plasminogen activator on thrombin generation and by the different responses of activated protein C and thrombomodulin on fibrinolysis. The last responses showed the linkage between coagulation and fibrinolysis by thrombin activatable fibrinolysis inhibitor. In conclusion, this strategy allows detection of coagulation, fibrinolysis and their interplay in a single assay.
Introduction
Hemostasis, the arrest of bleeding from an injured blood vessel, requires the combined activity of the vessel wall, blood cells (e.g. platelets) and plasma factors. The tendency of clot formation is subjected to complex regulatory mechanisms that control the process of hemostasis. Abnormalities can lead to excessive bleeding or thrombosis. Some of these aberrations can be detected by clotting tests made sensitive to specific parts of the coagulation cascade, for example the prothrombin time, activated partial thromboplastin time and thrombin time. These screening assays are limited to measure clot formation but no fibrinolysis.
More sophisticated methods are global clotting assays such as thrombin generation (TG) assaysCitation1 and thromboelastography (TEG).Citation2 Thrombin generation allows continuous measurement of thrombin in time using a specific peptide substrate. Cleavage of this substrate by thrombin leads to a cumulative signal that results in a TG curve after differentiation. The TG curve is characterized by three main parameters: the lag time, the peak height and the area under the curve (AUC). Both a reduced lag time and a high AUC indicate a tendency towards thrombosis,Citation3,Citation4whereas a retardation of the lag time and a low AUC curve signifies a bleeding tendency.Citation5 Thrombin generation can be performed both in platelet rich plasmaCitation6,Citation7 and in whole blood.Citation8,Citation9 Although TG reflects the patients’ coagulation status, it does not entirely represent the in vivo situation of the patient because it does not take fibrinolysis into account.
On the other hand, TEG evaluates both coagulant activity and subsequent lysis of the clot in whole blood by the measurement of viscoelastic changes in fibrin polymerization. In this way, TEG represents the sum of platelet function, coagulation proteins and the fibrinolytic system, yet this method is unable to distinguish between individual thrombin and plasmin generation (PG). In clinical situations, TEG is used to monitor therapeutic intervention in patients with aberrations in coagulation and fibrinolysis. Thromboelastography also proved useful to monitor blood component therapy during cardiacCitation10,Citation11and hepaticCitation12 surgery. Despite the development of these tests for screening purposes, no assay has yet been developed that addresses both clotting and fibrinolysis in a single well by their specific factors (i.e. thrombin and plasmin).
This study describes a novel hemostasis assay (NHA) that was able to measure both TG and PG simultaneously in a single well. The assay was designed in such a way that the PG curve was sensitive to changes in coagulation and the TG curve was sensitive to alterations of fibrinolysis in proportion to effects previously described in literature. In this way the NHA may contribute to improved understanding of the regulatory mechanisms involved in hemostasis.
Materials and Methods
Reagents
Thrombin specific substrate Bz-beta-Ala-Gly-Arg-7-amino-4-methylcoumarin and the plasmin specific substrate bis-(CBZ-L-phenylalanyl-L-arginine amide)-rhodamine were both synthesized by Chiralix, Nijmegen, The Netherlands. Pure human thrombin and human plasmin were from Kordia, Leiden, The Netherlands. Purified human factor Xa (FXa) and human activated protein C (APC) were obtained from Hyphen Biomed, Neuville-sur-Oise, France. Calcium chloride was from Merck, Darmstadt, Germany. Cephalin was purchased from Roche, Basel, Switzerland. Recombinant activated tissue factor (TF; Innovin®) was obtained from Siemens Healthcare Diagnostics, Marburg, Germany and tissue-type plasminogen activator (tPA; Alteplase®) was used from Boehringer Ingelheim, Ingelheim am Rhein, Germany. Recombinant hirudin was from Pentapharm, Basel, Switzerland and heparin from Leo Pharma BV, Breda, The Netherlands. ICN Biochemicals, Aurora, USA provided the epsilon-amino-caproic acid. Gly-pro-arg-pro (GPRP) peptide and carboxy peptidase inhibitor (CPI) were derived from Calbiochem, La Jolla, CA, USA. Reptilase was from Diagnostica Stago, Parsippany, NJ, USA. Alpha2-macroglobulin (α2M) was purchased from Innovative Research, Peary Court Novi, MI, USA. Thrombomodulin (TM) was from American Diagnostica, Stamford, CT, USA. Corn trypsin inhibitor was from Enzyme Research, South Bend, IN, USA. Black polystyrene Fluotrac microtiter plates were obtained from Greiner Bio-One, Monroe, NC, USA. ELISA test kits were used for the quantitative determination of prothrombin activation fragment (F1+2; Enzygnost F1+2, Siemens Healthcare Diagnostics, Marburg, Germany) and plasmin-alpha2-antiplasmin (PAP; Imuclone PAP, American Diagnostica, Stamford, CT, USA).
Normal pooled plasma
Blood was collected from healthy controls (n = 45). All participating subjects gave informed consent. These healthy blood donors represented both sexes equally and included an age range of 18–70 years. Freshly drawn citrate blood was centrifuged at 4°C for 15 minutes at 4200 g. Equal amounts of platelet-free plasma of each donor were mixed to generate a batch of normal pooled plasma (NPP) and of all individual participants 10 vials of approximately 1 ml were stored. All plasma’s were stored at −80°C until use. Normal pooled plasma was used to determine intra- and inter-assay variation and plasma of individual healthy controls were used to determine reference ranges.
Determination of kinetic constants
The kinetic parameters KM apparent (KM,app), turnover velocity (kcat) and vmax were obtained by determining the initial reaction velocity (v0) at different substrate concentrations. The initial reaction velocity of the substrate conversion was obtained in real time by determining the first derivative of the fluorescence tracing and subsequent nonlinear curve fitting to the Michaelis–Menten equation.Citation13The substrate concentration was varied while a fixed enzyme concentration was used. For both substrates KM,app was determined in (1) Tris buffered saline (TBS) 50 mM Tris-HCl (pH 7·4), 150 mM NaCl, (2) heated plasma (60 minutes at 58°C abolished antithrombin activity), (3) buffer containing 20–100 nM α2M, (4) buffer also containing the alternative substrate (5–8) buffer with a potential cross-reactive enzyme: thrombin or plasmin, tPA, FXa and APC. The enzyme concentrations used, were 50 nM for thrombin, 8 nM for plasmin and to test additional cross-reactivity 11 nM tPA, 14 nM FXa and up to 10 μM APC.
Novel hemostasis assay measurement
In the NHA, coagulation was initiated by calcium in the presence of TF and phospholipids resulting in TG and fibrin formation. To monitor TG and PG in time the following components were added into a black microtiter well: 80 μl plasma, 2 μl crude cephalin, 2 μl TF (final dilution 1∶30 000 corresponding to approximately 0·28 pMCitation14,Citation15), 4 μl fluorogenic thrombin substrate (final concentration 833 μM), 2 μl fluorogenic plasmin substrate (final concentration 33 μM) and TBS was added to a final volume of 100 μl. This mixture was thoroughly mixed and preheated in the 37°C thermostated fluorometer (Fluostar Optima Fluorometer, BMG Labtechnologies, Offenburg, Germany). In the mean time starting reagent was prepared that contained tPA (final concentration of 193 IU/ml), CaCl2 (final concentration 16·7 mM) and TBS. After adding 20 μl of starting reagent and immediate shaking the reaction began and fluorescence was measured alternately every 30 seconds for 70 minutes. The thrombin and plasmin specific substrates were excited at 355 and 485 nm and measured at an emission wavelength of 460 and 520 nm respectively. Thrombin and plasmin proteolytic activities were calculated by comparing the arbitrary fluorescence values to known amounts of a calibration curve prepared with human alpha-thrombin and human plasmin respectively. Calibration was performed in the presence of both fluorogenic substrates. The conversion rate of the substrate was determined and a linear calibration curve was created. This curve was used to convert the fluorescence tracing to thrombin and plasmin concentrations respectively. The first derivative was calculated from the fluorescent cumulative signal and all parameters of the NHA were determined by a Microsoft Excel macro programmed in Microsoft Visual Basic (version 11·1·1, Microsoft Corporation) (see Appendix).
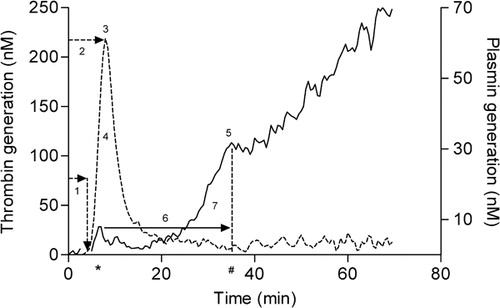
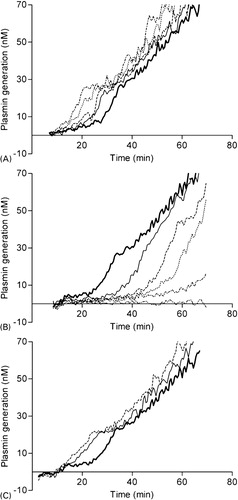
To describe the proteolytic activity of both thrombin and plasmin a number of parameters were defined by calculating the first derivative of the fluorescence signal (). The first derivative of the thrombin signal was divided in four parameters: (1) lag time thrombin generation (minute), i.e. the time between initiation and the start of TG; (2) thrombin peak time (minute), i.e. the time at which the TG reached its maximal rate and (3) thrombin peak (nM), which represents the maximal velocity of thrombin production. The area under the curve (AUC) (4) (nM-minute), i.e. the total amount of thrombin generated. Plasmin generation yielded three parameters; (5) the plasmin peak (nM), which is the height of PG at the moment where the curve shifts from a convex rate to a linear one, representing the point of lysis of the clot by plasmin, (6) the fibrin lysis time (FLT) (minute) is the difference in time between the plasmin peak time (marked by #) and the surrogate peak time (marked by *) and finally, integrating the surface under the plasmin curve during the FLT resulted in the (7) plasmin potential (nM-minute).
Figure 1. Simultaneous thrombin and plasmin generation. (A) First derivative of TG (−−−−) and PG (––––) experiment derived from a measurement in a single well. Thrombin generation signal was divided in four parameters: (1) lag time (minute), (2) thrombin peak time (minute), (3) thrombin peak height (nM), (4) area under the curve (AUC) (nM-minute). PG yielded three parameters: (5) the plasmin peak (nM), (6) the fibrin lysis time (FLT) (minute) and (7) plasmin potential (nM-minute). Surrogate peak time is marked by * and plasmin peak time is marked by #.
Results
Enzyme kinetics
In initial experiments kinetic constants of thrombin and plasmin fluorogenic substrates were determined under different conditions at 37°C (). Affinity of thrombin for its substrate in TBS buffer was determined at a KM,app of 200 μM. The Michaelis–Menten constant increased to 300 and 310 μM in pre-heated plasma as well as in buffer with an excess of its natural inhibitor α2M, respectively. The turnover velocity of thrombin was comparable under these different conditions ranging from 12 to 17×10−3 s−1. Addition of 33 μM of the alternative plasmin substrate slightly increased the KM,app of thrombin to 330 μM. Plasmin, FXa and APC had no cross-reactivity on the thrombin substrate, whereas tPA had a KM,app of 720 μM and a kcat value of 35×10−3 s−1, resulting in a constant, minimal conversion of the thrombin substrate.
Table 1. Kinetic constants of the thrombin and plasmin substrate. Assays were performed as described in the text with 8 nM plasmin, 50 nM thrombin, 14 nM FXa or 10 μM APC. kcat was expressed as s−1and was calculated from the V values and enzyme concentrations
Plasmin had a KM,app of 15 μM and conversion was also detected in heated plasma and in the presence of α2M, although both did not obey Michaelis–Menten kinetics. The presence of 833 μM thrombin substrate increased the KM,app of plasmin to a value of 55 μM. FXa had a KM,app of 55 μM towards the plasmin substrate, tPA and APC had no cross-reactivity and thrombin demonstrated conversion that did not obey Michaelis–Menten kinetics. FXa had a kcat value of 5×10⁻³s−1 compared to 116×10−3 s−1for plasmin, illustrating that conversion by FXa was lower than by plasmin.
Conditions of the NHA
The aim of the assay is to determine a bleeding tendency or an increased thrombotic risk in patients’ plasma. To determine the optimal concentration of start reagents in the NHA, the effect of various concentrations of TF and cephalin on TG as well as tPA on PG was analyzed (). Optimal concentration of TF was determined at a dilution of 30 000 fold (). Increasing concentrations of TF resulted in shortened lag time for TG and increased peak height. A lower TF concentration was chosen in order to gain sensitivity for the detection of a ‘prothrombotic’ state. The optimal concentration of cephalin was defined as the dilution at which submaximal TG occurred, which was obtained by a 60-fold dilution. Various concentrations of tPA tested in the NHA resulted in a plasmin peak of 39 nM at 300 IU/ml tPA and with no PG at 75 IU/ml. Increasing tPA concentrations also demonstrated increased TG representing the interplay between fibrinolysis and coagulation as also described by others.Citation16 This study used a concentration of 193 IU/ml tPA, because at this concentration the PG was sensitive for thrombin activatable fibrinolysis inhibitor (TAFI) activation as described later (see also .).Citation17
Figure 2. Concentration effects of start reagents in the NHA. The effect of different concentrations (A) TF and (B) cephalin on a TG curve and tPA on a TG (C) or PG (D) curve. (A) NPP was incubated with final dilutions of 1∶600 (double dotted striped), 1∶6000 (dot striped), 1∶15 000 (dotted), 1∶30 000 (bold), 1∶60 000 (striped) or no (solid) TF, (B) Cephalin was added in the following dilutions of 1∶30 (solid), 1∶60 (bold), 1∶120 (striped), 1∶2400 (dotted), 1∶1·2×105(dot striped) or no cephalin (double dotted striped), (C, D) TPA was added in a concentration of 300 (solid), 230 (striped), 193 (bold), 110 (dotted) and 75 IU/ml (dot striped) tPA. Bold lines indicate concentrations used in a standard NHA assay. To improve graphical representation of the simultaneously measured TG and PG experiments only the relevant results were illustrated.
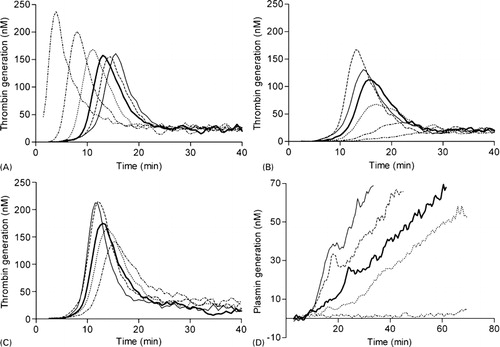
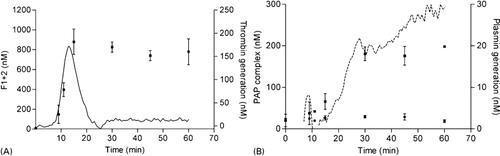
Figure 4. Superimposition of TG and PG with F1+2 and PAP complex respectively. Thrombin generation (solid; right vertical axis) compared with (A) log F1+2 generation (▪; left vertical axis) and (B) PG (striped; right vertical axis) compared with PAP formation initiated with (▪; left vertical axis) or without (•) 193 IU tPA. To improve graphical representation of the simultaneously measured TG and PG experiments only the relevant results were illustrated.
Assay variation
The intra-assay variation experiments were performed on eight replicate samples and all TG parameters of the NHA had a variation <5%, whereas the PG parameters had a slightly higher variation <9% (). The inter-assay variation was calculated using a single sample per day measured over 10 different days and the variation ranged from 6 to 25%. The parameters that describe the reference ranges of the thrombin and plasmin curve had a CV of 13–18% and 16–54% respectively ().
Table 2. Inter- and intra-assay variation for all parameters as measured in the NHA. The intra-assay variation was determined with eight replicate NPP samples and the inter-assay variation was calculated using a single sample per day measured over 10 different days
Table 3. Reference ranges of TG and PG parameters determined in citrate plasma of healthy controls (n = 45)
Modulation of coagulation and fibrinolysis
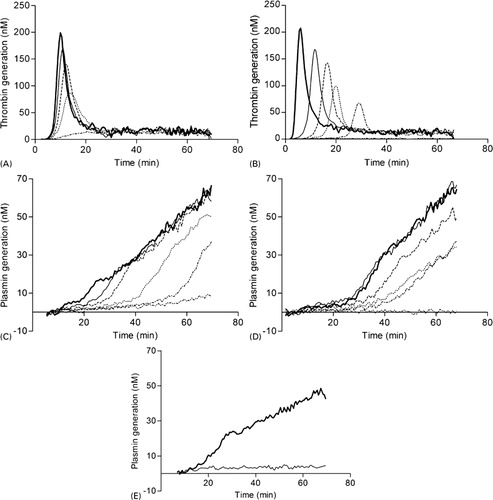
The NHA was designed to assess thrombin and PG in patient’s plasma and therefore this assay was challenged using different modulators of hemostasis. Heparin () decreased the AUC, whereas hirudin () had a dual effect on TG: increasing concentrations of hirudin decreased AUC while increasing the lag time. Fibrinolysis was inhibited with aprotinin, a direct antagonist of plasmin, and at a final concentration of 2–4 μM no PG was observed (not shown). Titration of epsilon-aminocaproic acid (), a lysine analog that binds reversibly to the lysine binding site on plasminogen,Citation18 prevented the activation of plasminogen to plasmin resulting in the dose-dependently suppression of fibrinolysis (). Another substance that affected fibrinolysis was GPRP (), which mimics the NH2 terminus of the fibrin alpha-chain and functions as an antipolymerant for fibrin.Citation19GPRP inhibited the conversion of plasminogen to plasmin completely at a concentration of 83 IU/ml (). To confirm that PG is fibrin dependent, fibrinogen was completely removed from NPP after reptilase treatment. Subsequently, a NHA experiment was performed with the residual defibrinated plasma. Thrombin generation remained normal (data not shown), however no PG was observed after reptilase treatment, indicating that this assay only measures fibrin-dependent PG ().
Figure 3. In vitro validation of the NHA. Effect of heparin (A), hirudin (B) on TG and epsilon-aminocaproic acid (C), GPRP (D) and reptilase (E) on PG. NPP was incubated with final concentrations of (A) 0 (bold) 42 (solid), 62 (striped) 83 (dotted) or 167 (dot striped) mIE/ml heparin, (B) 0 (bold), 2 (solid), 8 (striped), 17(dotted), 33 (dot striped) or 83 (double dotted striped) IU/ml hirudin, (C) 0 (bold), 0·4 (solid), 0·8 (striped), 2·1 (dotted), 4·2 (dot striped) or 8·3 (double dotted striped) nM epsilon-aminocaproic acid and (D) 0 (bold), 2 (solid), 8 (striped), 17 (dotted), 33 (dot striped) or 83 (double dotted striped) IU/ml GPRP. (E) demonstrates PG of NPP (bold) and fibrin-depleted NPP after reptilase treatment (solid). To improve graphical representation of the simultaneously measured TG and PG experiments only the relevant results were illustrated.
At last, corn trypsin inhibitor, an inhibitor of coagulation factor XII (a component of the intrinsic coagulation pathway) did not affect parameters of the NHA.
Validation of thrombin and plasmin generation
Thrombin generation and PG results were validated with ELISA’s against F1+2 and PAP complex, respectively (). A typical NHA experiment was started and after 0, 9, 11, 15, 30, 45 and 60 minutes the reaction was stopped by the addition of EDTA and aprotinin in final concentrations of 20 mM and 2000 IU respectively. The samples were appropriately diluted and the ELISA was performed as indicated by the manufacturer. F1+2 generation () started to increase after 9 minutes and reached a maximum after 15 minutes at approximately 800–900 nM. The pattern of F1+2 generation was in agreement with the TG curve. This corresponds to ∼60% conversion of prothrombin that is present in plasma at a concentration of ∼1·4 μM. PG was validated by PAP formation () initiated with or without 193 IU tPA. In the sample with tPA, PAP complexes gradually formed from 10 to 30 minutes and remained at a constant concentration of ∼200 nM. This indicates that approximately 10–15% of total plasminogen was converted to plasmin in our assay. Without tPA no PAP complexes were generated.
TAFI-dependent fibrinolysis
The interplay between coagulation and fibrinolysis was demonstrated by titration of increasing amounts of APC and TM, which resulted in different responses of fibrinolysis. Addition of APC in concentrations up to 10 μg/ml resulted in a ∼70% reduction of the thrombin peak height (data not shown). The reduced thrombin peak gave rise to a shortened FLT of approximately ∼60% of normal (). TM had an opposite effect on fibrinolysis caused by a dual activity based on complex formation with thrombin. The thrombin–TM complex catalyzes the formation of APC, inhibiting TG, and it enhances the activity of TAFI suppressing PG. Addition of TM in concentrations up to ∼100 nM completely abolished TG (data not shown) and PG (). PG was most sensitive to lower TM concentrations and for example, a concentration of 0·17 nM increased the FLT with ∼60%. The effect of the thrombin–TM complex on TAFI was inhibited by CPI, producing a shorter FLT in both NPP (solid) and in plasma spiked with 0·68 nM TM (striped) ().
Figure 5. The effect of APC, TM and CPI on fibrinolysis mediated by TAFI. NPP was incubated with final concentrations of (A) 0 (bold) 1·7 (solid), 2·6 (striped) 4·1 (dotted) or 10·3 (dot striped) μg/ml APC, (B) 0 (bold), 0·085 (solid), 0·17 (striped), 0·34 (dotted), 10 (dot striped) or 100 (double dotted striped) nM TM and (C) control (bold), 8 μM CPI (solid) and 8 μM CPI+0·68 nM TM (striped). To improve graphical representation of the simultaneously measured TG and PG experiments only the relevant results were illustrated.
Discussion
Since hemostasis is a sensitive balance between different pro- and anticoagulant processes it is difficult to establish a test that can be used as a global hemostasis screening assay. A number of groups have reported novel coagulation assays and described its application as recently reviewed.Citation20 Some assays measure both coagulation and clot lysis by the resultant of pro- and anticoagulant activities using turbidity (registration of fibrin by changes in adsorbance)Citation21Citation21,22 or TEG,Citation23Citation23,24 while others only measure TGCitation25Citation7Citation26Citation25,7,26,27 or fibrinolysis.Citation28 Recently, a method for the simultaneous measurement of TG and PG was described, albeit in separate wells.Citation29 A method for simultaneous assessment of TG and PG by their specific factors in a single well has not previously been reported.
This study has shown that the NHA allowed precise measurement of simultaneous TG and PG in a single well by non-interfering fluorogenic thrombin and plasmin specific substrates. Michaelis–Menten kinetics demonstrated that the substrates were suitable for the purpose of continuous TG and PG registration. The intra- and inter-assay variations indicated that the NHA was reproducible. Both TG and PG were sensitive to substances that suppressed their function and this assay both also applicable for studying the interplay between coagulation and fibrinolysis as demonstrated by the effect of tPA titration on coagulation and TAFI on PG. All together, these results showed that the NHA is a new valuable tool to detect abnormalities in coagulation and fibrinolysis.
Initiation of coagulation with TF is accepted as the most physiological mode of activation, and the importance of the intrinsic pathway to clot formation and stability at the site of injury is probably limited. This is confirmed by findings that FXII deficiency is not associated with bleeding tendency in humansCitation30 and that FXI-deficient patients have a variable hemorrhagic disorder with milder symptoms than hemophiliacs.Citation31 However, results of Renne et al.Citation32 and Cheng et al.Citation33 raise the possibility that activation of FXI and FXII after initiation of coagulation by FVIIa/TF or contact activation on the clot surface itself, contributes to thrombus growth even in situations where TF is the primary stimulator of thrombosis. Therefore, this study used a minimal amount of TF to gain sensitivity on the lag phase aimed at increased discrimination between plasmas with a minimally procoagulant phenotype.
Unique observations from our NHA curves highlight the potential for this assay to provide novel understandings about the interplay between coagulation and fibrinolysis. Thrombin generation in this assay demonstrated to be sensitive to changes in fibrinolysis as shown by the effect of tPA on TG (), also reported by others.Citation16Citation16,29 Therefore, our assay may be helpful for the screening of patients that are in a profibrinolytic state, either by congenital deficiency or therapy, and have increased TG.Citation34Citation34,35Additionally, our assay demonstrated to be particularly sensitive to TAFI-mediated effects on fibrinolysis. When activated TAFI is present above its threshold, fibrinolysis stays at a basal level, and once activated TAFI falls under the threshold fibrinolysis will accelerate. The concentration of tPA affects the threshold for activated TAFICitation17Citation17,36 thereby influencing the TAFI sensitivity of our assay. The use of 193 IU/ml tPA allowed sufficient fibrinolytic activity and sensitivity for TAFI activation as shown in . To be more precise, APC titration in our assay resulted in diminished TG and consequently in reduced TAFI activation, what in turn resulted in a reduced FLT and thus a profibrinolytic activity. The opposite was true for addition of TM. Addition of TM to plasma results in the formation of a thrombin–TM complex that catalyzes the formation of APC and activated TAFI, which inhibited both TG and PG. Recently, Simpson et al.Citation29 designed a global hemostasis assay with simultaneous TG and PG in separate wells. Interestingly, they stated that PG in their assay was sensitive to plasminogen, fibrinogen, alpha2-antiplasmin and exogenous tPA. However, they failed to demonstrate an increased fibrinolytic state in a hemophilic plasma (FVIII<1%) as reported by Broze et al.Citation37 The concentration of TF used in their assay generated a considerable amount of thrombin (AUC was ∼70% of NPP), leading to activation of TAFI and concomitant suppression of fibrinolysis as observed in healthy controls. Hence, their assay may lack sensitivity in the interplay between coagulation and fibrinolysis. As a result, this may complicate the interpretation of the overall hemostatic balance in this type of patients.
This study did not investigate the effect of other coagulation proteins on the cross-reactivity of the substrates, because molar concentrations of these proteins are 10- to 100-fold lower than prothrombin and plasminogen and therefore, their contribution to conversion of the substrates may be negligible. Moreover, addition of hirudin, a specific thrombin inhibitor, to our assay resulted in no TG at all, indicating that other activated coagulation enzymes did not have any hydrolytic activity to our thrombin substrate. Another notable observation in our test was the retained steady-state TG of approximately 10 nM. The protease inhibitor α2M impedes the activity of thrombin and plasmin by entrapment and covalent binding. That leads to an obstruction of activity against their natural substrates. However, these complexes retain activity against small synthetic substrates.Citation38–Citation40Hemker et al.Citation1 observed in defibrinated plasma that 30% of thrombin formed is ultimately complexed to α2M and when TG is performed in the presence of fibrinogen it is less than 5%. The latter is also true for TG in the NHA. As described in tPA also had a cross-reactivity on the thrombin substrate, indicating that in the NHA the retained steady-state TG is comprised by activity of the thrombin-α2M as well as by tPA-mediated conversion (for approximately 15%).
A few limitations of the NHA assay should be discussed. Despite the fact that we have included fibrinolysis in this assay to mimic the in vivo situation more closely, this assay still lacks important factors that also contribute to hemostasis like other cellular components (endothelium, platelets and leucocytes). Furthermore, we also report AUC in stead of ETP because we do not account for the activity of the thrombin–α2M complex. Therefore, at this moment our method is not able to exactly quantify molar amounts of thrombin or plasmin being generated. Lastly, this study only used platelet-poor plasma, while the use of fluorogenic substrates also accommodates measurements in platelet-rich plasma or whole blood. These aspects are the subject of ongoing and future investigation.
Conclusion
This study demonstrates that the NHA is a promising tool as a screening assay for abnormalities in coagulation and fibrinolysis and may contribute to improved understanding of the balance between coagulation and fibrinolysis. This assay may provide additional experimental information next to presently used clinical coagulation assays like the TG assay and TEG. Ongoing studies will be aimed at exploring the interaction between coagulation and fibrinolysis and vice versa.
References
- Hemker HC, Wielders S, Kessels H, Beguin S. Continuous registration of thrombin generationin plasma, its use for the determination of the thrombin potential. ThrombHaemost 1993;70:617–24.
- Sorensen B, Johansen P, Christiansen K, Woelke M, Ingerslev J. Whole blood coagulation thrombelastographicprofiles employing minimal tissue factor activation. JThromb Haemost 2003;1:551–8.
- Hron G, Kollars M, Binder BR, Eichinger S, Kyrle PA. Identification of patients at low risk forrecurrent venous thromboembolism by measuring thrombin generation. JAMA 2006;296:397–402.
- van Hylckama Vlieg A, Christiansen SC, Luddington R, Cannegieter SC, Rosendaal FR, Baglin TP. Elevated endogenous thrombin potential isassociated with an increased risk of a first deep venous thrombosis but notwith the risk of recurrence. Br J Haematol 2007;138:769–74.
- Dargaud Y, Beguin S, Lienhart A, Al DR, Trzeciak C, Bordet JC, et al.. Evaluation of thrombin generating capacityin plasma from patients with haemophilia A and B. ThrombHaemost 2005;93:475–80.
- Beguin S, Lindhout T, Hemker HC. The effect of trace amounts of tissue factoron thrombin generation in platelet rich plasma, its inhibition by heparin. ThrombHaemost 1989;61:25–9.
- Hemker HC, Giesen PL, Ramjee M, Wagenvoord R, Beguin S. The thrombogram: monitoring thrombin generationin platelet-rich plasma. Thromb Haemost 2000;83:589–91.
- Wagenvoord RJ, Hendrix HH, Kai H, Hemker HC. A chromogenic test to determine the procoagulantphospholipids in platelet-rich plasma and whole blood. ThrombHaemost 1994;72:582–7.
- Tappenden KA, Gallimore MJ, Evans G, Mackie IJ, Jones DW. Thrombin generation: a comparison of assaysusing platelet-poor and -rich plasma and whole blood samples from healthycontrols and patients with a history of venous thromboembolism. BrJ Haematol 2007;139:106–12.
- Spiess BD, Gillies BS, Chandler W, Verrier E. Changes in transfusion therapy and reexplorationrate after institution of a blood management program in cardiac surgical patients. JCardiothorac Vasc Anesth 1995;9:168–73.
- Shore-Lesserson L, Manspeizer HE, DePerio M, Francis S, Vela-Cantos F, Ergin MA. Thromboelastography-guided transfusion algorithmreduces transfusions in complex cardiac surgery. AnesthAnalg 1999;88:312–9.
- Kang YG, Martin DJ, Marquez J, Lewis JH, Bontempo FA, Shaw BW, et al.. Intraoperative changes in blood coagulationand thrombelastographic monitoring in liver transplantation. AnesthAnalg 1985;64:888–96.
- Kakkar T, Boxenbaum H, Mayersohn M. Estimation of Ki in a competitive enzyme-inhibitionmodel: comparisons among three methods of data analysis. DrugMetab Dispos 1999;27:756–62.
- Sorensen B, Asvaldsdottir HS, Gudmundsdottir BR, Onundarson PT. The combination of recombinant factor VIIaand fibrinogen correct clotting ex vivo in patient samples obtained followingcardiopulmonary bypass surgery. Thromb Res 2009;124:695–700.
- Viuff D, Andersen S, Sorensen BB, Lethagen S. Optimizing thrombelastography (TEG) assayconditions to monitor rFVIIa (NovoSeven) therapy in haemophilia A patients. ThrombRes 2010;126:144–9.
- Szlam F, Levy JH, Tanaka KA. Tissue plasminogen activator and thrombingeneration measurements using the Thrombinoscope. BloodCoagul Fibrinolysis 2006;17:603–4.
- Leurs J, Nerme V, Sim Y, Hendriks D. Carboxypeptidase U (TAFIa) prevents lysisfrom proceeding into the propagation phase through a threshold-dependent mechanism. JThromb Haemost 2004;2:416–23.
- van Zonneveld AJ, Veerman H, Pannekoek H. On the interaction of the finger and the kringle-2domain of tissue-type plasminogen activator with fibrin. Inhibition of kringle-2binding to fibrin by epsilon-amino caproic acid. JBiol Chem 1986;261:14214–8.
- Gallistl S, Muntean W, Zenz W. Gly-pro-arg-pro (GPRP) enhances free thrombin. ThrombRes 1995;78:547–50.
- Berntorp E, Salvagno GL. Standardization and clinical utility of thrombin-generationassays. Semin Thromb Hemost 2008;34:670–82.
- He S, Zhu K, Skeppholm M, Vedin J, Svensson J, Egberg N, et al.. A global assay of haemostasis whichuses recombinant tissue factor and tissue-type plasminogen activator to measurethe rate of fibrin formation and fibrin degradation in plasma. ThrombHaemost 2007;98:871–82.
- Goldenberg NA, Hathaway WE, Jacobson L, Manco-Johnson MJ. A new global assay of coagulation and fibrinolysis. ThrombRes 2005;116:345–56.
- Spiess BD, Logas WG, Tuman KJ, Hughes T, Jagmin J, Ivankovich AD. Thromboelastography used for detection ofperioperative fibrinolysis: a report of four cases. JCardiothorac Anesth 1988;2:666–72.
- Yamakage M, Tsujiguchi N, Kohro S, Tsuchida H, Namiki A. The usefulness of celite-activated thromboelastographyfor evaluation of fibrinolysis. Can J Anaesth 1998;45:993–6.
- Butenas S, van’t VC, Mann KG. ‘Normal’ thrombin generation. Blood 1999;94:2169–78.
- Hemker HC, Beguin S. Thrombin generation in plasma: its assessmentvia the endogenous thrombin potential. Thromb Haemost 1995;74:134–8.
- Hemker HC, Beguin S. Phenotyping the clotting system. ThrombHaemost 2000;84:747–51.
- Rijken DC, Hoegee-de NE, Jie AF, Atsma DE, Schalij MJ, Nieuwenhuizen W. Development of a new test for the global fibrinolyticcapacity in whole blood. J Thromb Haemost 2008;6:151–7.
- Simpson ML, Goldenberg NA, Jacobson LJ, Bombardier CG, Hathaway WE, Manco-Johnson MJ. Simultaneous thrombin and plasmin generationcapacities in normal and abnormal states of coagulation and fibrinolysis inchildren and adults. Thromb Res 2011;127:317–23.
- Schmaier AH, McCrae KR. The plasma kallikrein-kinin system: its evolutionfrom contact activation. J Thromb Haemost 2007;5:2323–9.
- Seligsohn U. Factor XI deficiency in humans. JThromb Haemost 2009;7(Suppl 1):84–7.
- Renne T, Pozgajova M, Gruner S, Schuh K, Pauer HU, Burfeind P, et al.. Defective thrombus formation in micelacking coagulation factor XII. J Exp Med 2005;202:271–81.
- Cheng Q, Tucker EI, Pine MS, Sisler I, Matafonov A, Sun MF, et al.. A role for factor XIIa-mediated factorXI activation in thrombus formation in vivo. Blood 2010;116:3981–9.
- Ogiwara K, Nogami K, Nishiya K, Shima M. Plasmin-induced procoagulant effects in theblood coagulation: a crucial role of coagulation factors V and VIII. BloodCoagul. Fibrinolysis 2010;21:568–76.
- Gulba DC, Barthels M, Westhoff-Bleck M, Jost S, Rafflenbeul W, Daniel WG, et al.. Increased thrombin levels during thrombolytictherapy in acute myocardial infarction. Relevance for the success of therapy. Circulation 1991;83:937–44.
- Walker JB, Bajzar L. The intrinsic threshold of the fibrinolyticsystem is modulated by basic carboxypeptidases, but the magnitude of the antifibrinolyticeffect of activated thrombin-activable fibrinolysis inhibitor is masked byits instability. J Biol Chem 2004;279:27896–904.
- Broze GJ, Higuchi DA. Coagulation-dependent inhibition of fibrinolysis:role of carboxypeptidase-U and the premature lysis of clots from hemophilicplasma. Blood 1996;88:3815–23.
- Wagenvoord RJ, Deinum J, Elg M, Hemker HC. The paradoxical stimulation by a reversiblethrombin inhibitor of thrombin generation in plasma measured with thrombinographyis caused by alpha(2)-macroglobulin-thrombin. J ThrombHaemost 2010;8:1281–9.
- Barrett AJ, Starkey PM. The interaction of alpha 2-macroglobulin withproteinases. Characteristics and specificity of the reaction, and a hypothesisconcerning its molecular mechanism. Biochem J 1973;133:709–24.
- Salvesen GS, Barrett AJ. Covalent binding of proteinases in their reactionwith alpha 2-macroglobulin. Biochem J 1980;187:695–701.
Appendix
Supplemental data. Syntax of the Microsoft Excel macro programmed in Microsoft Visual Basic (version 11.1.1, Microsoft Corporation) to determine all parameters of the NHA.
Notation
Tr and Pl are the derivatives of the original thrombin and plasmin signals
and express the production of thrombin and plasmin. The derivatives of Tr
and Pl describe the production acceleration:
Maximum of a function is notated as fmax, minimum as fmin.
Time of maximum is notated as tf,max, minimum
as tf,min. For thrombin, e.g.
Calculus thrombin
Thrombin peak production
Get location of the maximum of Tr, ignore last part of curve
Thrombin lag time
Get minimum of in first part of curve
Define two thresholds of Tr in this first part of curve
and select restricted maximum
The acceleration phase starts around the thrombin peak and ends with the transition to a steady, constant increase of Pl.
Maximum acceleration phase
First, get the maximum of the acceleration phase.
End of acceleration phase
The higher end of the acceleration phase is defined as the transition to
a steady, constant increase of Pl:
Start of acceleration phase
The acceleration phase starts with the plasmin generation. After the transition Pl
will be small, but increasing: