Abstract
Objective
Our study aims to assess the oxidative stress status of seminal plasma from normozoospermic, azoospermic, and leukocytospermic males, since abnormal sperm and leukocytes in human ejaculates are the main source of reactive oxygen species (ROS) which lead to oxidative damages. For this purpose we applied a biochemical approach to the assessment of the oxidative stress status by using two-dimensional (2D) electrophoresis to check the level of protein oxidation after specific labeling of free thiol (–SH) groups.
Methods
Seminal plasma samples from normal and pathological males were analyzed by a luminol-based chemiluminescent assay. The same samples after specific labeling of free –SH groups with 3-N-maleimidopropionyl biocytin, were analyzed by 2D electrophoresis and computer-assisted semiquantitative determination of the amount of free –SH groups.
Results
Using a standard chemiluminescence assay, we demonstrated a high, low and normal level of ROS, respectively, in seminal plasma from leukocytospermic, azoospermic, and normozoospermic subjects. By 2D electrophoresis and streptavidin blotting of specifically labeled free –SH groups of proteins, we detected in the same samples a higher level of oxidated –SH groups comparable between azoospermic and leukocytospermic samples, whereas a significantly higher level of free –SH groups was detected in normozoospermic subjects.
Discussion
Our results demonstrated that a pathological oxidative stress status in seminal plasma may be revealed by the levels of the protein free –SH groups, both in the presence or absence of cells.
Introduction
Reactive oxygen species (ROS) production in the male reproductive tract may significantly contribute to male infertility mainly because of the ability of these molecules to exert a toxic effect decreasing sperm quality and functionality. ROS are a wide class of molecules derived from oxygen metabolism as O2 (superoxide), H2O2 (hydrogen dioxide), and HO (hydroxyl radical) which may also be influenced by iatrogenic or pathological conditions, such as inflammation, ischemia, environmental, and behavioral practices.Citation1 The major sources of ROS in seminal plasma are leukocytesCitation2,Citation3 particularly neutrophils,Citation4 and macrophages.
Nevertheless, ROS have a physiological role in the male reproductive system. Indeed, small amount of ROS may trigger intracellular signaling events during sperm capacitation, hyperactivation, and acrosomal reactionCitation5,Citation6 and are necessary for sperm fertilizing capabilities.Citation7,Citation8 On the contrary high levels of ROS were shown to be present in 25–40% of the seminal plasma of infertile maleCitation9,Citation10 and some morphological studies have also shown that a high production of ROS is linked to the presence of immature sperm cells mainly for the presence of cytoplasmic residues.Citation11
Therefore, sperm faces the so-called oxygen paradox since its vitality and function depend on oxygen but may be negatively affected by its metabolites.Citation9 For this reason, the amount of ROS must be constantly kept within a limited levels, as the result of antioxidant enzymes activity (superoxide dismutase, glutathione system for oxidase/deoxygenase, and glutathione reductase enzyme) and subsets of non-enzymatic pathways (vitamin E, ascorbic acid, and glutathione), which counteract the pathological effects of ROS.Citation12 Oxidative stress (OS) is currently defined as a disequilibrium between ROS production and antioxidant defense levels in the body.
By increasing the oxidation of thiol (–SH) groups, which are mainly present on cysteine residues, OS can induce alteration of the global thiol-disulfide status thus leading to the accumulation of oxidatively modified proteins.Citation13 Labeling of free –SH groups with 3-N-maleimidopropionyl biocytin (MPB) followed by two-dimensional (2D) electrophoresis, streptavidin blotting and computer-assisted analysis of the reactive spots, may provide a quantitative and qualitative evaluation of the OS level in different biological fluids, which is unequivocally related to the redox state of the microenvironment and a very sensitive and stable marker of oxidative stress.Citation14,Citation15
Prompted by the aforementioned observation, we aim to assess the degree of OS in the seminal plasma of normozoospermic, leukocytospermic, and azoospermic men by determining the amount of ROS by means of the luminol-based chemiluminescence assay. Furthermore, the overall changes in the level of protein free –SH groups, detected by MPB labeling and subsequent 2D electrophoresis, is determined as a marker of OS as revealed by protein oxidative damage.
Methods
Fifty-five male patients attending the Infertility and IVF Center of the University of Siena for semen analysis were included: 18 normozoospermic, 15 non-obstructive azoospermic, and 22 leukocytospermic (leukocyte count >1 × 10⁶/ml) with asthenoteratozoospermia.Citation16 The study was approved by the local ethical committee.
Semen analysis
Light microscopy
Semen samples were collected by masturbation after 4 days of sexual abstinence.
Spermiogram was performed according to WHO (2010)Citation16 criteria using an inverted polarized Olympus IXS21 microscope, equipped with Hoffmann lens and a warmed (37°C) plate.
Two spermiograms were performed in all patients.
Peroxidase staining
Leukocytes were counted after peroxidase stainingCitation17. Briefly, 0.0375% H2O2 was added to 4 ml of benzidine stock solution (0.0125% w/v benzidine, Sigma Aldrich, Milan, Italy, in 50% ethanol). Ten microliters of ejaculate was mixed with 20 µl fresh benzidine H2O2 solution. After 5 min, 160 µl phosphate-buffered saline was added and peroxidase-positive (round brown cells) and peroxidase-negative (unstained) cells counted using a Makler chamber (Sefi-Medical Instruments, Haifa, Israel) and phase-contrast microscope (Olympus, Milan, Italy).
Transmission electron microscopy
Normozoospermic and leukocytospermic semen samples were fixed for 2 hours at 4°C in Karnovsky fixative, postfixed in osmium tetroxide, dehydrated in a graded ethanol series and embedded in Epon-Araldite. Ultrathin sections were examined with a Philips CM 10 transmissione electron microscope.
ROS Level evaluation
The amount of ROS in seminal plasma was determined by a luminol-based chemiluminescence assay as described by Athayde et al.Citation18
Aliquots of liquefied semen were centrifuged at 300 × g for 7 minutes. The sperm pellet was washed twice in Sperm Washing Medium, HEPES buffered (Sage Biopharma, USA) and then resuspended in the same medium or in the homologous seminal plasma at a concentration of 20 × 106 sperm/ml. ROS production was measured by the chemiluminescence assay method using luminol (5-amino-2,3-dihydro 1,4-phthalazinedione; Sigma Chemical Co, St Louis, MO, USA) as probe. Ten microliters of 5 mM luminol in dimethyl sulfoxide (Sigma Chemical Co) were added to 400 µl of the washed sperm suspension.
For both samples, ROS levels were determined by measuring chemiluminescence with a LB953 luminometer (Berthold Technologies, Bad Wildbad, Germany) for 10 minutes at 37°C. Blank was prepared with sperm washing medium or seminal plasma.
Results were expressed as 106 counted photons per minute (cpm) per 20 × 106 sperm.
Collection and storage of seminal plasma
Cell-free seminal plasma was obtained by centrifugation at 14 000 × g for 7 minutes and then stored immediately at −80°C for subsequent analysis. For each of the three categories under study, a pool of seminal plasma was obtained by using 100 µl from each subject. Protein concentration was determined by Bicinchoninic Acid Kit (Sigma-Aldrich, St Louis, MO, USA) following the manufacturer's instruction.
Free –SH groups labeling with MPB
This assay was carried out according to a modified protocol as described by de Lamirande and Gagnon.Citation19 A solution of MPB 1 mM (Sigma Aldrich) in Tris-HCl 15 mM pH 6.8 was added to 200 µg of seminal plasma proteins of each pool, in a final volume of 100 µl. The mixture was then heated at 95°C for 5 minutes and immediately processed for 2D electrophoresis.
Two-dimensional electrophoresis
Two-dimensional electrophoresis was carried out as described below. Briefly, 60 µg of total protein were resuspended in the rehydration solution (REID) (8 M urea, 4% CHAPS (w/v) bromophenol blue 0.005% (m/v) mixed with 0.2% (w/v) immobilized pH gradient (IPG) buffer with a 3–11 nonlinear pH range (IPG buffer, GE Healthcare, Uppsala, Sweden) to a final volume of 140 µl. Samples were loaded onto Immobiline DryStrips (7 cm) with immobilized nonlinear pH gradient, ranging from pH 3 to 11 (GE Healthcare). Isoelectric focusing was performed as described by Gorg et al.Citation20 and Bjellqvist et al.Citation21 using EttanTM IPGphorTM (GE Healthcare). Isoelectric focused strips were equilibrated for 15 minutes with 50 mM Tris-HCl pH 6.8 containing 30% v/v glycerol, 6 M urea, and 2% w/v sodium dodecyl sulfate (SDS) and for an additional 5 minutes in the same solution containing 2.5% w/v iodoacetamide (IAA) and 0.1% w/v bromophenol blue, and then placed on a 6–16% polyacrylamide linear gradient SDS gel and subjected to electrophoresis at 25 mA/gel according to Laemmli.Citation22
Western blotting
For western blotting analysis, proteins were electroblotted from polyacrylamide gels to nitrocellulose (Bio-Rad Laboratories, Hercules, CA, USA) overnight at 180 mA and 500 V in 25 mM Tris-HCl pH 8.3, containing 192 mM glycine, and 20% v/v methanol.Citation23 Transferred proteins were stained with 0.1% w/v Ponceau S in 3% v/v acetic acid. Membranes were blocked with 3% w/v non-fat dried milk in 10 mM Tris-HCl (pH 7.5), 0.15 M NaCl, 0.1% v/v (TBS) and then incubated with streptavidin conjugated to peroxidase in TTBS (TBS containing 0.2% Tween 20) containing 1% non-fat dry milk (w/v). After washings, reactivity was detected using an Immuno-Star HRP Chemiluminescent kit (Bio-Rad Microsciences) following the manufacturer's instructions and revealed with an XRS instrument ChemiDoc (Bio-Rad Microsciences, Hemel Hempstead, UK). Images were then processed using the Quantity One® 4.5.7 and PDQuestTM 7.4.0 softwares (Bio-Rad Microsciences) for spots identification and quantification.
Statistical analysis
Statistical analysis was performed using the one-way analysis of variance (ANOVA) test. P-values of less than 0.05 were considered statistically significant.
Results
represents the results of the evaluation of the macroscopic and microscopic semen parameters, of the three study groups. (1) normozoospermic (N), (2) leukocytospermic (L), and (3) azoospermic (A). Ultrastructural analysis was performed in order to confirm that a high percentage of sperm with normal structure are present in the N category (A) whereas in leukocytospermic samples (B), leukocytes and macrophages were frequently detected, together with sperm with altered nuclear and flagellar structures. In samples classified as azoospermic no sperm cells were detected, even after centrifugation.
Figure 1. Transmission electron micrograph of human ejaculates from normozoospermic (A) and leukocytospermic (B) subjects. In (A) both longitudinal and cross-sections of sperm with normal ultrastructure are shown; in (B) sperm with altered shape, loss of acrosomal and plasma membrane, and disrupted chromatin (arrows) are clearly evident among leukocytes and macrophages (arrowheads). Bar: 1 µm (A); 5 µm (B).
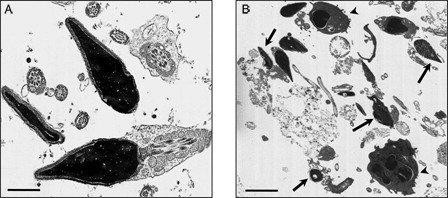
Table 1. Seminal fluid evaluation and ROS level in the study groups
ROS level obtained by the luminol-based chemioluminescence assay in the different samples of the study groups N, L, and A are also presented in . ROS level in washed sperm of group N did not exceed the value of 1 × 10⁶ cpm, with a mean value of 0.5 ± 0.05 × 10⁶ cpm whereas in leukocytospermic subjects, significantly high-ROS values were observed reaching a peak of about 7 × 10⁶ cpm, with a mean value of 4.8 ± 1.3 × 10⁶ cpm (P < 0.05). In the azoospermic group, the levels of ROS were extremely low with a mean value of 0.04 ± 0.001 × 10⁶ cpm.
To determine the overall OS status of the samples, we carried out a qualitative and quantitative assessment of the level of protein free –SH groups present in the seminal plasma of the three categories under study as a measure of protein oxidation and damage.
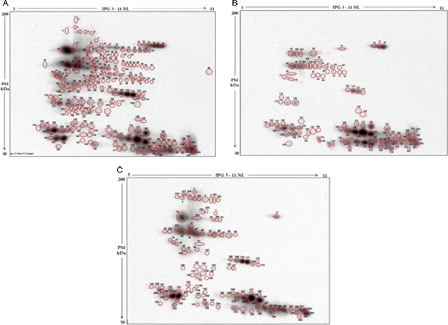
In representative 2D electrophoretographs of MPB-labeled samples are shown revealing reactive spots with different intensity in the three groups (). The results demonstrated a total of 242 free –SH labeled proteins in the three samples. In the N sample a total of 219 labeled spots were detected 96 of which were exclusively present in this group. In the A sample, of a total of 112, 12 labeled proteins were found to be exclusively present in this group. On the contrary, only 92 labeled proteins could be detected in the L sample, none of which exclusive of this category.
Figure 2. Western blotting of MPB labeled seminal plasma proteins after two-dimensional electrophoresis. Protein spots with free –SH groups detected in the pool of seminal plasma from the three categories of male subjects are circled in red. Normozoospermic (A), leukocytospermic (B), and azoospermic (C). All spots are numbered consecutively, from 1 to 242.
Discussion
In the last decade the potential role of ROS in male infertility generated a great interest in the researchers as evidenced by the growing number of studies appearing on this topic. The redox state of the sperm microenvironment must be finely adjusted: the sperm metabolism produce free radicals, important for the development of physiological functions as well as the acquisition of fertilizing capabilities.Citation24,Citation25 However, an overproduction of ROS, above the physiological threshold must be buffered by antioxidant defense mechanism to prevent structural alterations in the charge of membrane lipids, proteins, and DNA.Citation3
An OS condition can either results from an increased ROS production and/or a reduction in total antioxidant defenses. These two aspects are traditionally investigated by measuring the levels of ROS and antioxidant defenses, but there are several methodological limitations related to the direct detection of ROS.Citation5 For the quantification of ROS levels, the chemiluminescence assay using luminol is usually applied, but it requires the presence of enzymatic systems or intact cells for accuracy and reproducibility.Citation26 For this reason its use on biological fluids after cell removal has to be considered inappropriate or useless.Citation27 Therefore, as we previously suggested, a more stable marker of OS should be investigated. Since protein cysteinyl thiols are highly susceptible to oxidation and this modification lead to an accumulation of oxidized molecules, loss of free –SH groups is thought to represent a valid marker of the OS status of biological samples also in the absence of ROS producing cells or enzymes.Citation27
In this study we aimed to determine the overall OS status of the seminal plasma in three categories of patients: normozoospermic, leukocytospermic, and azoospermic by different methods in order to establish if the analysis of the level of protein free –SH groups, as determined by 2D electrophoresis after MPB labeling, could indeed represent a biological marker of the OS level in seminal plasma samples.
Applying the luminol-based chemiluminescent assay, we demonstrated a high production of ROS in patients affected by leukocytozoospermia, whereas an almost indetectable level was observed in cases with azoospermia. The normozoospermic subjects demonstrated a normal range of ROS production, observations in agreement with Agarwal et al.Citation28 who considered the ROS levels between 0.1 × 10⁶ and 1 × 10⁶ cpm for 20 × 106 cell as physiological. As expected, ROS level in leukocytospermic samples reached a significantly higher value because of the presence of an elevated number of white blood cells and abnormal spermatozoa, thus confirming the previously published studies.Citation28
By using the free –SH groups labeling methods we demonstrated that a decrease in free protein –SH groups may be linked to an increased OS status. Indeed, in leukocytospermic and in azoospermic samples we could demonstrate an overall reduction in the intensity of the labeled proteins. Since the reduced –SH group levels in seminal plasma proteins were comparable between leukocytospermic and azoospermic samples, we conclude that the OS status in the latter is independent by the presence of sperm cells or leukocytes and could arise from other sources in the male genital tract. Indeed, different kinds of inflammatory reactions in the male genital tract may lead to the appearance of an OS status.Citation29
Moreover, together with the disappearance of several reactive spots in the L and A samples due to ROS-based decreased in the sulfydryl content of proteins, we observed the appearance of new labeled spots, together with others in which the intensity was significantly increase. This seems to suggest that ROS production is also linked to the appearance and/or an increase in the sulfydryl content of some proteins. Although this phenomenon has been already describedCitation19 no clear explanation for its occurrence was determined.
In conclusion, our study suggests that the quantification of protein free –SH groups could be useful for the determination of the OS status of the seminal plasma particularly in those cases where seminal plasma lack the cellular component, as in azoospermic patients. In this case, the absence of cellular or enzymatic systems do not allow the use of luminol-based chemiluminescent assay.
Oxidative protein damage to protein free –SH groups could be an important aspect of male infertility to be investigated in different pathologies.
References
- Desai N, Sabanegh EJ, Kim T, Agarwal A. Free radical theory of aging: implications in male infertility. Urology 2009;75:14–9.
- Aitken RJ, Baker HW. Seminal leukocytes: passengers, terrorists or good Samaritans? Hum Reprod 1995;10:7136–39.
- Saleh RA, Agarwal A. Oxidative stress and male infertility: from research bench to clinical practice. J Androl 2002;23:737–52.
- Thomas J, Fishel SB, Hall JA, Green S, Newton TA, Thornton SJ. Increased polymorphonuclear granulocytes in seminal plasma in relation to sperm morphology. Hum Reprod 1997;12:2418–21.
- Agarwal A, Nallella KP, Allamaneni SS, Said TM. Role of antioxidants in treatments of male infertility: an overview of the literature. Reprod Biomed Online 2004;8:616–27.
- Griveau JF, Le Lannou D. Reactive oxygen species and human spermatozoa: physiology and pathology. Int J Androl 1997;20:61–9.
- Gagnon C, Iwasaki A, De Lamirande E, Kovalski N. Reactive oxygen species and human spermatozoa. Ann N Y Acad Sci 1991;637:436–44.
- Aitken RJ. The Amoroso lecture. The human spermatozoon-a cell in crisis? J Reprod Fertil 1999;115:1–7.
- de Lamirande E, Gagnon C. Impact of reactive oxygen species on spermatozoa: a balancing act between beneficial and detrimental effects. Hum Reprod 1995;10:15–21.
- Padron OF, Brackett NL, Sharma RK, Lynne CM, Thomas AJ, Agarwal A. Seminal reactive oxygen species and sperm motility and morphology in men with spinal cord injury. Fertil Steril 1997;67:1115–20.
- Gomez E, Buchingham DW, Brinlde J, Lanzafame F, Irvine DS, Aitken RJ. Development of an image analysis system to monitor the retention of residual cytoplasm by human spermatozoa: correlation with biochemical markers of the cytoplasmic space, oxidative stress and sperm function. J Androl 1996;17:276–87.
- Sies H. Strategies of antioxidant defense. Eur J Biochem 1993;215:213–9.
- Linton S, Davies MJ, Dean RT. Protein oxidation and ageing. Exp Gerontol 2001;36:1503–18.
- Eaton S. The biochemical basis of antioxidant therapy in critical illness. Proc Nutr Soc 2006;65:242–9.
- Leichert LI, Jakob U. Global methods to monitor the thiol-disulfide state of proteins in vivo. Antioxid Redox Signal 2006;8:763–72.
- World Health Organization. Laboratory manual for the examination of human semen and semen-cervical mucus interaction. 5th ed. Cambridge, UK: Cambridge University Press; 2010.
- Oettle EE. An improved staining technique which facilitates sequential monitoring of the acrosome state. Dev Growth Differ 1986;28:96.
- Athayde KS, Cocuzza M, Agarwal A, Krajcir N, Lucon AM, Srougi M, et al. Development of normal reference values for seminal reactive oxygen species and their correlation with leukocytes and semen parameters in a fertile population. J Androl 2007;28:613–20.
- de Lamirande E, Gagnon C. Paradoxical effect of reagents for sulphydryl and disulfide groups on human sperm capacitation and superoxide production. Free Radical Biol Med 1998;25:803–17.
- Gorg A, Postel W, Gunther S. The current state of two dimensional-electrophoresis with immobilized pH gradients. Electrophoresis 1988;9:531–46.
- Bjellqvist B, Pasquali C, Ravier F, Sanchez JC, Ochstrasse DF. A nonlinear wide-range immoblized pH gradient for two dimensional-electrophoresis and its definition in relevant pH scale. Electrophoresis 1993;14:1357–65.
- Laemmli UK. Cleavage of structural proteins during the assembly of the head of bacteriophage T4. Nature 1970;227:680–85.
- Towbin H, Staehelin T, Gordon J. Electrophoretic transfer of proteins from polyacrylammide gels to nitrocellulose sheets: procedure and some applications. Proc Natl Acad Sci USA 1979;76:4350–54.
- Finkel T. Oxigen radicals and signaling. Curr Opin Cell Biol 1998;10:248–53.
- Forman J, Torres M. Reactive oxygen species and cell signalling respiratory burst in macrophage signalling. Am J Resp Crit Care Med 2002;166:54–8.
- LI Y, Zhu H, Kuppusamy P, Roubaud V, Zweier JL, Trush MA. Validation of lucigenin (bis-N-methylacridinium) as a chemilumigenic probe for detecting superoxide anion radical production by enzymatic and cellular systems. J Biol Chem 1998;273:2015–23.
- Tatone C, Amicarelli F, Carbone MC, Monteleone P, Caserta D, Marci R, et al. Cellular and molecular aspects of ovarian follicle ageing. Hum Reprod Update 2008;14:131–42.
- Agarwal A, Makker K, Sharma R. Clinical relevance of oxidative stress in male factor infertility: an update. Am J Reprod Immunol 2007;59:2–11.
- Fraczek M, Kurpisz M. Inflammatory mediators exert toxic effects of oxidative stress on human spermatozoa. J Androl 2007;28:325–33.