Abstract
Objective
To investigate the efficacy of combined administration of alpha-tocopherol (AT) and ascorbic acid (AA) in reducing ethanol-induced hepatotoxicity.
Methods
Rats were maintained for 90 days and grouped as follows: I – control rats, II – ethanol, III – alpha-tocopherol, IV – ethanol + alpha-tocopherol, V – AA, VI – ethanol + ascorbic acid, VII – alpha-tocopherol + ascorbic acid, VIII – ethanol + alpha-tocopherol + ascorbic acid. At the end of the experimental period, markers of hepatic function, oxidative stress, and the expression of markers of inflammation and fibrosis were assayed.
Results
The markers of hepatic function, lipid peroxidation products, protein carbonyls, and the expression of nuclear factor kappa B, tumor necrosis factor alpha, transforming growth factor beta 1, cytochrome P4502E1, and collagen Type I were elevated after ethanol administration. All these parameters were reduced in the ethanol group administered AT and AA in combination. The activities of antioxidant enzymes which were reduced by ethanol administration were enhanced on combined administration of AT and AA. The reduction in hepatic fibrosis was almost 20% more in AT and AA co-administered group compared with AT and AA alone treated groups.
Discussion
Combined administration of fat soluble AT and water soluble AA was beneficial against ethanol-induced hepatotoxicity. This may be due to their different subcellular localizations.
Introduction
Alcoholism has been a major health concern affecting various sections of society across the globe. Alcohol abuse causes serious clinical manifestations on almost all organs of the body. The liver is the major target organ of alcohol-induced injury. The susceptibility of the liver to alcohol-induced toxicity is due to both the high concentrations of alcohol found in portal blood (versus systemic), as well as the metabolic consequences of ethanol. Alcoholic liver disease is a spectrum of disease states that includes steatosis (fatty liver), steatohepatitis, and in severe cases, fibrosis and/or cirrhosis. Metabolism of alcohol to acetaldehyde takes place mainly in hepatocytes, a step catalyzed by alcohol dehydrogenase or cytochrome P4502E1 (CYP2E1) which leads to the release of reactive oxygen species (ROS). Generation of ROS also results from the imbalance in the oxidant–antioxidant status of the cells, especially in the liver.Citation1 Excessive production of ROS can damage lipids, proteins, and DNA by inhibiting its normal function and thus leads to oxidative stress and decreased antioxidant levels in many tissues.Citation2 ROS can diffuse from their site of generation and cause impairment to the structural and functional integrity of the cells causing tissue damage.Citation3 Hepatic fibrosis is characterized by the excessive deposition of extra-cellular matrix (ECM) component like collagen in the hepatic stellate cells (HSCs). ROS generated in hepatocytes plays a key role in the development of hepatic fibrosisCitation4 by activating collagen production in HSC which further leads to damage of cellular macromolecules.
Chronic alcoholism is associated with high risk of micronutrient deficiency. Micronutrients like alpha-tocopherol (AT), ascorbic acid (AA), carotenoids, and trace elements are important factors implicated in the defense against oxidative injury, and a deficit in any one of these elements can result in functional impairment of the overall antioxidant system.Citation5 AT being hydrophobic, is an important component of biological membranes and decrease in its concentration causes structural and functional damage to the cells. Unlike other fat soluble vitamins, it is not accumulated in the body to toxic levels since they get eliminated via increased metabolism.Citation6
AA, a hydrophilic antioxidant, acts as a free radical scavenger and reduces the capability of ethanol to interact with essential molecules.Citation7 AA protects lipid peroxidation in hydrophobic compartments either by scavenging lipid peroxides or by reducing tocopherol radicals to tocopherols.Citation8 Numerous studies have been conducted to elucidate the antioxidant potential of ATCitation9,Citation10 and AA.Citation11,Citation12 It has been reported that AT, AA, and selenium when administered in combination imparts protection to ethanol-induced duodenal mucosal injury.Citation13 But hardly any work is known regarding the impact of combined action of AT and AA on ethanol-induced hepatotoxicity and on fibrosis.
Hence, the major objective of this study was to understand the impact of the combination of AT and AA on ethanol-induced oxidative stress, expression of NF kappa B (nuclear factor kappa B), tumor necrosis factor alpha (TNF-alpha), transforming growth factor beta1 (TGF beta1), CYP2E1 on fibrosis.
Materials and methods
Male albino rats (Sprague Dawley strain) weighing between 100 and 140 g, bred and reared in our animal house were used for the experiment. Weight-matched animals were selected. A total of 48 rats were divided into eight groups of six rats each.
Group I (CN): Control rats.
Group II (E): Ethanol (4 g/kg body weight/day).
Group III (AT): alpha-tocopherol (250 mg/kg body weight/day).
Group IV (E + AT): Ethanol (4 g/kg body weight/day) + alpha-tocopherol (250 mg/kg body weight/day).
Group V (AA): Ascorbic acid (200 mg/kg body weight/day).
Group VI (E + AA): Ethanol (4 g/kg body weight/day) + ascorbic acid (200 mg/kg body weight/day).
Group VII (AT + AA): alpha-tocopherol (250 mg/kg body weight/day) + ascorbic acid (200 mg/kg body weight/day).
Group VIII (E + AT + AA): Ethanol (4 g/kg body weight/day) + alpha-tocopherol (250 mg/kg body weight/day + ascorbic acid (200 mg/kg body weight/day).
Animals were housed in polypropylene cages. The cages were kept in a room that was maintained between 28 and 32°C. The light cycle was 12 hours of light and dark. The study protocol was approved by the Institutional Animal Ethics Committee (IAEC -KU-14/2009-2010-BC-MI (23)). The animals were handled as per laboratory animal welfare guidelines. Rats were fed with animal feed (The composition of feed is as follows: Moisture-10%, Crude protein-22%, Crude fibre-0.3%, Crude fat-3–4%, Nitrogen free extract-60%, Color-1% and phosphorous-0.5%) (Ashirvad Pvt Ltd, India). Food and water were given ad libitum. Ethanol was purchased from M/s Merck Ltd, Mumbai, India. Ethanol was diluted with distilled water (1:1) and given orally by gastric intubation. AT was purchased from M/s Sigma Aldrich, USA and AA was purchased from M/s Merck Ltd, Mumbai, India. AT was dissolved in coconut oil and AA was dissolved in distilled water and all of them were administered orally by gastric intubation. The dose of AA (200 mg/kg body weight) was taken from previous studies conducted in our laboratoryCitation12 and the dose of AT was decided based on the dose-dependent study in which it was found that AT at a dose of 250 mg/kg body weight is effective in preventing oxidative stress. Control, AT, AA, and AT + AA groups were administered glucose solution equivalent to the calorific value of ethanol in group II. The duration of the experiment was 90 days. At the end of the experimental period, the animals were fasted overnight and killed. The liver was dissected out and cleaned with ice cold phosphate buffer saline, blotted dry, and immediately transferred to ice cold containers for various biochemical evaluations. Blood was collected in clean, dry test tubes and allowed to clot for 30 minutes at room temperature. The clear serum was removed after centrifugation at 2000 g for 10 minutes and used immediately for the assay of various parameters.
Biochemical analysis
The activity of alanine aminotransferase (ALT) and aspartate aminotransferase (AST) was analyzed by the method of Reitman and Frankel.Citation14 Gamma-glutamyl transferase (GGT) was analyzed by the method of Szasz.Citation15 Malondialdehyde (MDA) was estimated by the method of Hiroshi Ohkawa.Citation16 Hydroperoxides (HP) were estimated by the method of Mair and Hall.Citation17 Conjugated dienes (CD) were estimated by the method of Recknagel and Ghoshal.Citation18 Protein carbonyls were estimated by the method of Abraham and Packer.Citation19 Total collagen was estimated by the procedure of Chandrakasan et al.Citation20 Hydroxyproline was estimated by the procedure of WoessnerCitation21 and tissue protein was estimated by the method of Lowry et al.Citation22 Superoxide dismutase (SOD) was assayed by the method of Kakkar et al.Citation23 Catalase was assayed by the method of Maehly and Chance.Citation24 The activity of glutathione reductase (GR) was determined by the method of David and RichardCitation25 and the activity of glutathione peroxidase (GPx) was determined by the method of Lawrence and Burk,Citation26 as modified by Agergaard and Jensen.Citation27 The reduced glutathione (GSH) was determined by the method of Patterson and Lazarow.Citation28
Total RNA isolation
Total RNA was isolated from the liver using TRIZOL Reagent (M/s Sigma Aldrich, USA) by the method described by Chomczynski and Sacchi.Citation29
Reverse transcription-polymerase chain reaction
The isolated RNA was used for reverse transcriptase-polymerase chain reaction (RT-PCR) to study the expression of glyceraldehyde-3-phosphate dehydrogenase (GAPDH), CYP2E1, NF kappa B, TGF beta1 and collagen Type I. Total tissue RNA (2 µg) was primed with 0.05 µg oligodT and reverse transcribed by ominiscript reverse transcriptase using a cDNA synthesis kit (Qiagen). The PCR was carried out using eppendorf thermocycler. Primer sequences are given in . Primer sequences for GAPDH, CYP2E1, NF kappa B, TNFalpha, TGF beta1, and collagen were taken from the previous reports.Citation30,Citation31 The PCR contained 10 mM Tris (pH 8.3), 50 mM KCl, 1.5 mM MgCl2, dNTP at 20 mM each and gene specific primers at 0.5 mM each and 0.025 units/μl taq polymerase. After an initial denaturation step at 94°C, 35 amplification cycles were performed. Each cycle included an initial denaturation step at 94°C for 45 seconds, annealing at 56°C for NF kappa B, 55°C for TGF beta1, 61°C for TNF-alpha, 55°C for CYP2E1, 62°C for GAPDH, and 53°C for collagen Type I. A final extension step of 5 minutes at 72°C was performed in order to complete the PCR. The amplified product was electrophoresed on 2% agarose gel containing ethidium bromide. Then the gels were subjected to densitometric scanning (Bio Rad Gel Doc, CA, USA) to determine the OD of each and then normalized against an internal control GAPDH (using quantity one imaging software).
Table 1. Primer sequences used for RT-PCR analysis
High-pressure liquid chromatography analysis
Analysis of AA in serum
One part serum with four parts 6% metaphosphoric acid was mixed in a polypropylene storage vial. The vial contents were vortexed and centrifuged at 10 000 g for 15 minutes at 4°C and the supernatant was used for analysis. High-pressure liquid chromatography (HPLC) analysis was done by the Shimadzu Prominence SCL-20AHT (Shimadzu, Kyoto, Japan) system and the separation of AA was done by isocratic gradient elution using a Luna 5S NH2 100A column (Phenomenex, Torrance, CA, USA). The mobile phase was HPLC water (eluent A, pH 2.5) and methanol (eluent B) in 1:1 ratio. The total flow rate was 1.0 ml per minute and the time of analysis was 15 minutes. The detector's wavelengths were set at 268 nm. The injection volume was 20 µl and the temperature of the column was thermostated at 40°C.
Analysis of AT in serum
Hundred microliters of serum was deproteinized with 100 µl of ethanol and extracted with 600 µl of chloroform. The extract was shaken for 5 minutes before centrifuging at 12 000 rpm for 8 minutes. The organic layer was extracted and evaporated to dryness under a nitrogen atmosphere. HPLC analysis was done by the Shimadzu Prominenece SCL-20AHT (Shimadzu, Kyoto, Japan) system and the separation of AT was done by isocratic gradient elution using a Luna 5 µ NH 2 100A column. The mobile phase was methanol (Eluent A) and acetonitrile (Eluent B) in 1:1 ratio. The total flow rate was 1.0 ml/min and the time of analysis was 15 min. The detector's wavelengths were set at 268 nm. The injection volume was 20 µl, and the temperature of column was thermostated at 40°C.
Histopathological analysis
For histopathological studies, the liver was fixed in Bouin's fixative and sections were taken in the microtome. The sections were stained using hematoxylin and eosin. The pathological changes were examined using a sensitive light microscope.
Statistical analysis
The results were analyzed using the statistical programme – SPSS/PC+, version 11.5 (SPSS Inc., Chicago, IL, USA). A one-way analysis of variance was employed for comparison among the six groups. Duncan's post hoc multiple comparison tests of significant differences among groups were determined. P < 0.05 was considered to be significant.
Results
Biochemical analysis
The activities of specific liver toxicity markers like ALT, AST, and GGT () were found to be significantly elevated in ethanol-administered group when compared with control group and this was reduced to near normal levels in AT and AA-administered group, but greater reduction was observed in ethanol groups administered in combination with both AT and AA. The activities of scavenging enzymes catalase, SOD, GPx and GR () were found to be reduced in ethanol-administered group and this was elevated in AT and AA-administered groups, but greater elevation was observed in ethanol group administered in combination of both AT and AA.
Table 2. Activity of toxicity marker enzymes in the liver and serum of rats
The levels of lipid peroxidation products – HP, CD, and MDA, in the liver were elevated in the ethanol group when compared with the control group (). Administration of AT along with ethanol reduced the levels of HP by 40.71%, CD by 28.11%, and MDA by 39.58%, and the administration of AA along with ethanol reduced the levels of HP by 34.87%, CD by 27.27%, and MDA by 39.58% when compared with ethanol group. But greater reduction was observed in the group administered a combination of both AT and AA, whereas the level of HP was reduced by 48.76%, CD by 39.68%, and MDA by 46.87% when compared with ethanol-administered rats.
Table 3. Lipid peroxidation products, protein peroxidation products, total collagen, and hydroxyproline content in the liver
Table 4. Activities of scavenging enzymes Catalase, SOD, GPx, GR, and GSH in the liver of rats
The levels of protein carbonyls () in the liver were elevated in the ethanol-administered group and this was reduced in all AT and AA administered groups with the best reduction being shown by the ethanol group administered AT and AA in combination.
The content of collagen and hydroxyproline () in the liver was elevated in the ethanol-treated animals. This was reduced in all antioxidant-administered groups in comparison with ethanol-administered group. AT reduced the levels by 23 and 34%, respectively. AA reduced the levels by 25 and 30%, respectively. Ethanol group supplemented with a combination of AT and AA showed 45% reduction in toxicity in the content of both collagen and hydroxy proline when compared with ethanol-administered group.
The activities of scavenging enzymes catalase, SOD, GPx and GR () were 2 found to be reduced in ethanol-administered group and this was elevated in AT and AA-administered groups, but greater elevation was observed in ethanol group administered in combination of both AT and AA.
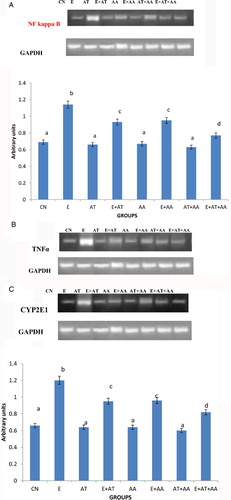
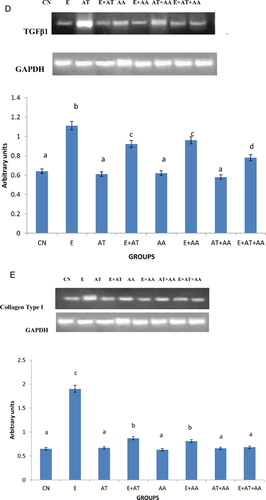
The mRNA expressions of NF kappa B (A), TNF-alpha (B), CYP2E1 (C), TGF beta1 (D), and collagen Type I (D) were done using RT-PCR. In ethanol-treated rats, there was significant increase in the expression of PCR products compared with control rats and those treated with AT or AA alone or both in combination. The intensities of these were reduced significantly in all the antioxidant groups administered with ethanol, the reduction observed being more significant in the combination group.
Figure 1. mRNA expression of transcription factors. (A) Expression of NF kappa B. (B) Intensity of TNFalpha using gel doc. Expression of TNF-alpha was analyzed in the cytoplasmic fraction of liver by agarose gel electrophoresis and the intensities of the bands were compared with that of the intensities of GAPDH bands expressed in the samples. Intensities of the bands were quantified using Bio-Rad gel doc and plotted. The results presented are average of quadruplicate experiments ± SEM statistically significant at P < 0.05. (C) Intensity of CYP2E1 using gel doc. Expression of CYP2E1 was analyzed in the cytoplasmic fraction of liver by agarose gel electrophoresis and the intensities of the bands were compared with that of the intensities of GAPDH bands expressed in the samples. Intensities of the bands were quantified using Bio-Rad gel doc and plotted. The results presented are average of quadruplicate experiments ± SEM statistically significant at P < 0.05. (D) Intensity of TGF beta1 using gel doc. Expression of TGF beta1 was analyzed in the cytoplasmic fraction of liver by agarose gel electrophoresis and the intensities of the bands were compared with that of the intensities of GAPDH bands expressed in the samples. Intensities of the bands were quantified using Bio-Rad gel doc and plotted. The results presented are average of quadruplicate experiments ± SEM statistically significant at P < 0.05. (E) Intensity of collagen type I using gel doc. Expression of collagen was analyzed in the cytoplasmic fraction of liver by agarose gel electrophoresis and the intensities of the bands were compared with that of the intensities of GAPDH bands expressed in the samples. Intensities of the bands were quantified using Bio-Rad gel doc and plotted. The results presented are average of quadruplicate experiments ± SEM statistically significant at P < 0.05.
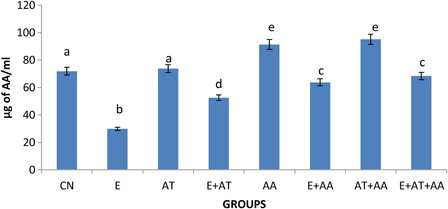
HPLC analysis ( and ) of AT and AA in serum showed that the concentration of AT and AA was reduced in the ethanol-treated group. This reverted to near normal levels in all antioxidant-administered groups but the more significant effect was seen in the ethanol group administered with the combination of both the vitamins (AT and AA).
Figure 2. Graphical representation of alpha-tocopherol content in serum of CN, E, AT, E + AT, AA, E + AA, AT + AA, and E + AT + AA groups. Values are expressed as mean ± SEM of six rats in each group. Values not sharing a common superscript letter differ significantly at P < 0.05.
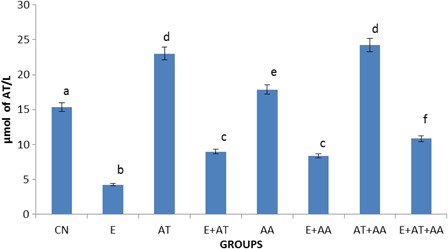
Figure 3. Graphical representation of ascorbic acid content in serum of CN, E, AT, E + AT, AA, E + AA, AT + AA and E + AT + AA groups. Values are expressed as mean ± SEM of six rats in each group. Values not sharing a common superscript letter differ significantly at P < 0.05.
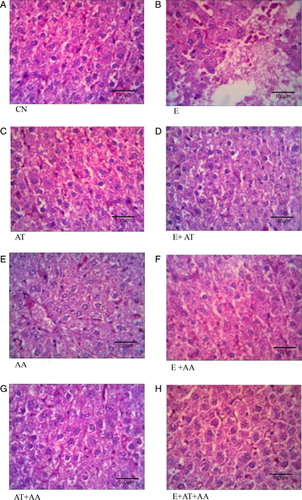
The histopathological architecture of the liver in CN (A), AT (C), AA (E), and AT + AA (G) showed normal cell structure. Ethanol-administered group (B) exhibited extensive heapatic cell damage as indicated by ballooning of hepatocytes, vacuolization, dilation of sinusoids and steatosis. These alterations were reduced in group supplemented with AT or AA along with ethanol (D and F), but maximum reduction in the damage were exhibited by ethanol group co-administered in combination with both AT and AA (H).
Figure 4. Histopathological analysis of liver (magnification 40×). (A) Control group showed normal liver architecture and cell structure. (B) Ethanol group showed extensive hepatocellular damage as evidenced by steatosis, vacuolization, and dilation of sinusoids. (C) AT group exhibited normal cell architecture as almost that of control. (D) E + AT group exhibited slight recovery from steatosis and inflammation. (E) AA group showed cells that were almost similar to the control. (F) E + AA group exhibited slight recovery from steatosis and inflammation. (G) AT + AA group showed cells almost similar to the control. (H) E + AT + AA group exhibited almost near normal cell architecture of CN group as evidenced by reduction in steatosis, vacuolization, dilation of sinusoids, and inflammation.
Discussion
Metabolism of ethanol to cytotoxic aldehyde and then in turn to acetate can lead to the production of ROS which perturbs the cell membrane resulting in the leakage of specific marker enzymes to circulation.Citation30 In this study also, the specific markers of liver toxicity such as GGT, ALT, and AST were elevated in serum and liver tissue of ethanol-treated group indicating the extent of hepatic injury and this was reduced to near normal levels in ethanol groups administered with either AT or AA alone. This is in agreement with earlier findings.Citation12,Citation32 But greater reduction in the toxicity was observed in ethanol group co-administered in combination with both AT and AA which was also in accordance with the findings of Yanardag et al.Citation33 who showed that vitamins E, C, and selenium when supplemented in combination reduced the levels of specific liver toxicity markers.
Ethanol-induced liver injury is associated with increased oxidative stress and free radical-mediated tissue damage. Metabolism of ethanol results in elevated production of free radicals and depletion of these toxic species is associated with cell survival during ethanol intoxication. The characteristic features of ethanol-induced liver diseases are progression of oxidative stress, alterations in the expression of liver inflammatory markers and hepatic fibrosis. Consistent with this, in this study it was observed that chronic ethanol consumption led to elevated levels of lipid peroxidation products viz. MDA, HP, CD, and protein carbonyls. This is in agreement with earlier studies wherein ethanol administration resulted in enhanced oxidative stress and lipid peroxidation.Citation34 This was reversed in AT and AA-administered groups, but significant reduction in lipid peroxidation was observed in ethanolic rats administered a combination of both AT and AA. This is in agreement with the studies of Upansai et al.Citation35 which showed that combined administration of AT and AA inhibits lipid peroxidation induced by lead which may be due to its antioxidant property. This observation was further supported by findings of Shalan et al.Citation7 who proved the protective efficacy of AT, AA, and selenium against ethanol-induced toxicity.
Free radical-scavenging enzymes such as SOD and catalase are known to be the first-line cellular defense against oxidative damage and earlier reports have shown that they get reduced after ethanol abuse.Citation36 In our study also, the activities of these enzymes were reduced after chronic ethanol intake and this was brought to near-normal levels in ethanol group administered with AT or AA. But more pronounced result was observed in ethanol group administered a combination with both AT and AA which may be due to their additive antioxidant activities. GSH is an antioxidant, preventing damage to important cellular components caused by ROS. The levels of GSH get decreased after chronic ethanol intake as reported by the earlier studies.Citation37,Citation38 This may be due to its utilization in scavenging the ROS mediated by ethanol metabolism which in turn leads to oxidation of GSH. The activities of GSH-dependent enzymes like GPx and GR was also found to be decreased after chronic ethanol administration which may be due to either free radical-dependent inactivation of enzyme or depletion of its co-substrates, that is GSH and NADPH.Citation38 Consistent with these findings our result also exhibited decreased activities of GSH, GPx, and GR after chronic ethanol intake. This was brought to near-normal levels in ethanol group supplemented with either AT or AA with more significant alterations were shown by ethanol group administered a combination with both AT and AA.
Ethanol intake leads to the activation of various transcription factors. In order to evaluate the expression of transcription factors involved in ethanol-induced oxidative stress, the expression of CYP2E1, NF kappa B, TNF-alpha, and TGF beta1 was done. The CYP2E1 expression and activities are found to be elevated after chronic ethanol consumption.Citation39 The induction of CYP2E1 in alcoholics is a means by which ethanol generates oxidative stress.Citation40 This activates lipid peroxidation and excessive generation of hydroxyl ethyl radical resulting in decreased antioxidant levels. In this study, there was increased expression of CYP2E1 on alcohol administration which was reversed by the administration of AT and AA. But significant reduction was observed when AT and AA were administered together to ethanolic rats. Treatment with antioxidant vitamins in combination reduced the hepatotoxicity of the liver. This may be one of the factors for the observed reduced hepatotoxicity in animals co-administered AT and AA. This is in accordance with Carlett et al.Citation41 who showed that pre-treatment with substances that reduce the activity of CYP2E1 or inactivate ROS could reduce the hepatotoxic effect of ethanol.
NF kappa B, a key factor associated with cellular stress in the liver resides in cytosol as dimer in complex with inhibitory kappa B (IkB) molecule. Activation of the dimer due to oxidative stress upon phosphorylation, dissociates IkB molecule, exposing NF kappa B which further leads to its nuclear translocation and DNA binding on nucleus. Elevated expression of NF kappa B has been reported in ethanol-induced liver inflammation.Citation42 In accordance with this, this study also showed elevated expression of NF kappa B in ethanol-treated group. However, all ethanol groups supplemented with either AT or AA exhibited a decreased expression, but the reduction was more significant in the ethanol group administered a combination of AT and AA. NF kappa B is responsible for activation of other cytokines such as TNF-alpha with its involvement in fibrogenesis. Chronic ethanol consumption results in elevated levels of free radicals which may have activated NF kappa B leading to increased production of TNF-alpha. TNF-alpha is a pro-inflammatory cytokine and Kupffer cells are the major sites for TNF-alpha expression which is elevated during ethanol consumption.Citation43 Consistent with this, in this study the levels of TNF-alpha were found to be elevated in the ethanol-administered group which was brought down in all antioxidant-administered groups with significant reduction being seen in the ethanol group administered a combination of AT and AA.
TGF beta1 mainly produced by macrophages acts as a growth factor in the stimulation and deposition of ECM. They also activate HSCs to proliferate and produce collagen which leads to hepatic fibrosis and liver injury.Citation44 TGF beta1 enhances HSCs proliferationCitation45 by increasing the expression of platelet-derived growth factor, an activating cytokine. HSC or Kupffer cells once activated, produce increased quantities of TGF beta1.Citation46 In this study, it was found that the ethanol exposed group exhibited an increased mRNA expression of pro-inflammatory cytokine, TGF beta1. The mRNA levels of TGF beta1 were reduced to a greater extent in the ethanol group administered a combination of AT and AA when compared with other groups.
Hepatic fibrosis is characterized by deposition of ECM proteins such as collagen, mainly types I, III, and IV.Citation47 HSCs are major collagen producing cells; they undergo activation during the development of fibrosis. This activation increases the capacity to synthesize more collagen by HSC.Citation48 When animals are fed with ethanol, the acetaldehyde conversion may result in the development of hepatic fibrosis which in turn is accompanied by increased levels of hydroxyproline, a marker for collagen metabolism and hepatic fibrosis. These results in turn suggest that the formation of acetaldehyde adduct can cause hepatic fibrosis.Citation49 George and ChandrakasanCitation50 showed the activation of lipid peroxidation and MDA to be an important factor in the development of hepatic fibrosis. Our studies also demonstrated an elevation in the levels of collagen, its expression and hence a subsequent increase in the concentration of hydroxyproline. This may be due to increased oxidative stress and activation of NF kappa B which resulted in enhanced fibrosis. Reduction in the concentration of collagen and hydroxyproline and expression of collagen was shown by the ethanol group administered a combination of both AT and AA compared with AT or AA alone treated groups.
It has been reported earlier that chronic alcoholism leads to micronutrient deficiencyCitation5 and our results confirmed that AT and AA levels were reduced significantly in the ethanol-treated group and this was brought to near-normal levels in all the groups administered AT and AA in combination or alone. Hence, the enhanced levels of both hydrophilic antioxidant AA and hydrophobic AT may have provided the microenvironment in the hepatic cell for the reduction of oxidative stress and fibrosis.
Histopathological studies of the liver also indicated that after chronic ethanol exposure extensive hepatocellular damage was observed as evidenced by ballooning of hepatocytes, dilation of sinusoids, steatosis, and vacuolization. This was almost reversed in alcoholic rats supplemented AT or AA. But more significant effect was exhibited by ethanol group supplemented in combination of both AT and AA. This observation reinforced our biochemical findings that a combination of AT and AA provide better ameliorating effect than either AA or AT alone.
AT and AA are the major antioxidants that are thought to impart a protective effect by either reducing or preventing oxidative damage. Lipid soluble AT prevents lipid peroxidation chain reactions in cellular membranes by interfering with the propagation of lipid radicals. AA is a water-soluble antioxidant found in the cytosol and extracellular fluid that can interact directly with free radicals, thus preventing oxidative damage. Due to their different subcellular locations, a combination of AT and AA has been shown to have a better antioxidant effect than either of the two alone.
Conclusion
Our biochemical and histopathological studies confirm that chronic ethanol consumption leads to oxidative stress and hepatotoxicity. The increased production of ROS caused lipid peroxidation, protein oxidation, fibrosis and increased expression of NF kappa B, TNF-alpha, TGF beta1, CYP2E1, and collagen Type I. But co-administration of AT and AA was more effective than either AT or AA alone in combating ethanol-induced hepatotoxicity. The reduction in fibrosis was more than 20% in AT + AA group than in AT or AA alone supplemented group. The mechanism of action seems to be down-regulating the free radical production by reducing the expression of CYP2E1. This further led to reduced NF kappa B activation and decreased the expression of pro-inflammatory cytokines. Lipid soluble, AT prevents lipid peroxidation chain reactions in cellular membranes by interfering with the propagation of lipid radicals and water-soluble antioxidant AA found in the cytosol and extracellular fluid interacts directly with free radicals, thus preventing oxidative damage. Owing to their different subcellular locations, a combination of AT and AA proved to be more advantageous in combating ethanol-induced hepatotoxicity than administration of either AT or AA alone.
Acknowledgment
The financial support from District Development Office for Scheduled Castes, Trivandrum Kerala, India, is greatly being acknowledged.
References
- Masalkar PD, Abhang SA. Oxidative stress and antioxidant status in patients with alcoholic liver disease. Clin Chim Acta 2005;355:61–5.
- Perry G, Raina AK, Nunomura A, Wataya T, Sayre LM, Smith MA. How important is oxidative damage? Lessons from Alzheimers disease. Free Radic Biol Med 2000;28:831–4.
- Winrow VR, Winyard PG, Morris CJ, Blake DR. Free radicals in inflammation: second messengers and mediators of tissue destruction. Br Med Bull 1993;49:506–22.
- Parola M, Robino G. Oxidative stress related molecules and liver fibrosis. J Hepatol 2001;35:297–306.
- Gueguen S, Pascal P, Leroy P, Guilland J-C, Arnaud J, Paille F, et al. Changes in serum retinol, α-tocopherol, vitamin C, carotenoids, zinc and selenium after micronutrient supplementation during alcohol rehabilitation. J Am Coll Nutr 2003;22:303–10.
- Martin A, Janigian D, Shukitt-Hale B, Prior RL, Joseph JA. Effect of vitamin E intake on levels of vitamin E and C in central nervous system and peripheral tissue: implications for health recommendations. Brain Res 1999;845:50–9.
- Shalan MG, Abd Ali W Dh, Shalan AG. The protective efficacy of vitamins (C and E), selenium and silymarin supplements against alcohol toxicity. World Rabbit Sci 2007;15:103–10.
- Jurczuk M, Brzoska MM, Moniuszko-Jakoniuk J. Hepatic and renal concentrations of vitamin E and C in lead- and ethanol- exposed rats. An assessment of their involvement in the mechanisms of peroxidative damage. Food Chem Toxicol 2007;45:1478–86.
- Lebold KM, Grant KA, Freeman WM, Wiren KM, Miller GW, Kiley C, et al. Individual differences in hyperlipidemia and vitamin E status in response to chronic alcohol self-administration in cynomolgus monkeys. Alcohol Clin Exp Res 2011;35:474–83.
- Esrefoglu M. Oxidative stress and benefits of antioxidant agents in acute and chronic hepatitis. Hepat Mon 2012;12:160–7.
- Sivaram AG, Suresh MV, Indira M. Combined effect of ascorbic acid and selenium supplementation on alcohol induced oxidative stress in guinea pigs. Comp Biochem Physiol C Toxicol Pharmacol 2003;134:397–401.
- Ambadath V, Venu RG, Madambath I. Comparative study of the efficacy of ascorbic acid, quercetin, and thiamine for reversing ethanol-induced toxicity. J Med Food 2010;13:1485–9.
- Koyuturk M, Bolkent S, Ozdil S, Arbak S, Yanardag R. The protective effect of vitamin C, vitamin E and selenium combination therapy on ethanol induced duodenal mucosal injury. Hum Exp Toxicol 2004;23:391–398.
- Reitman S, Frankel S. A colorimetric method for the determination of serum glutamic oxaloacetic and glutamic pyruvic transaminases. Am J Clin Pathol 1957;28:56–63.
- Szasz G. A kinetic photometric method for serum gamma- glutamyl transpeptidase. Clin Chem 1969;15:124–36.
- Ohkawa H, Ohishi N, Yagi K. Assay of lipid peroxides in animal tissue by thiobarbituric acid reaction. Anal Biochem 1979;95:351–358.
- Mair RD, Hall T. Determination of organic peroxides by physical chemical and colorimetric methods. In: Swern D & Wiley CD (eds). Inorganic peroxides II. New York: Wiley, Intersciences; 1971. p. (2):535–538.
- Recknagel RO, Ghoshal AK. Quantitative estimation of peroxidative degeneration of rat liver microsomal and mitochondrial lipids after carbon tetrachloride poisoning. Exp Mol Pathol 1966;5:413–426.
- Abraham ZR, Packer L. Oxidative damage to proteins: spectrophotometric method for carbonyl assay. Methods Enzymol 1993;233:357–363.
- Chandrakasan G, Torchia DA, Piez KA. Preparation of intact monomeric collagen from tail tendon and skin and the structure of non helical ends in solution. J Biol Chem 1976;251:6062–7.
- Woessner JF. The determination of hydroxyproline in tissue and protein samples containing small proportions of this imino acid. Arch Biochem Biophys 1961;93:440–7.
- Lowry OH, Rosebrough NJ, Farr AL, Randall RJ. Protein measurement with the Folin phenol reagent. J Biol Chem 1951;193:265–75.
- Kakkar P, Das B, Viswanathan PN. A modified spectrophotometric assay of superoxide dismutase. Indian J Biochem Biophys 1984;21:130–2.
- Maehly AC, Chance B. The assay of catalase and peroxides. In Glick D (ed.) Methods of biochemical analysis. New York: Intersciences; 1954. p. 357–424.
- David M, Richard JS. Glutathione reductase. In: Bergmeyer HU, Bergmeyer J (eds). Methods of enzymatic analysis. New York: Academic Press; 1983. p. 258–65.
- Lawrence RA, Burk RF. Glutathione peroxidase activity in selenium deficient rat liver. Biochem Biophys Res Commun 1976;71:952–958.
- Agergaard N, Jensen PT. Procedure for blood glutathione peroxidase determination in cattle and swine. Acta Vet Scand 1982;23:515–27.
- Patterson JW, Lazarow A. Determination of glutathione. In: , Glick D, (ed.) Methods of biochemical analysis. New York: Interscience; 1955. p. 259–78.
- Chomczynski P, Sacchi N. Single-step method of RNA isolation by acid guanidiniumthiocyanate- phenol-chloroform extraction. Anal Biochem 1995;162:156–59.
- Rejitha S, Prathibha P, Indira M. Amelioration of alcohol-induced hepatotoxicity by the administration of ethanolic extract of Sida cordifolia Linn. Br J Nutr 2012;108:1256–63.
- Gwon-Soo Jung, Mi-Kyung Kim, Mi Sun Choe, Kyeong-Min Lee, Hye-Soon Kim, Young Joo Park, et al. The Orphan Nuclear Receptor SHP Attenuates Renal Fibrosis. J Am Soc Nephrol 2009;20:2162–70.
- Onyema OO, Farombi EO, Emerole GO, Ukoha AI, Onyeze GO. Effect of vitamin E on monosodium glutamate induced hepatotoxicity and oxidative stress in rats. Indian J Biochem Biophys 2006;43:20–4.
- Yanardag R, Ozsoy-Sacan O, Ozdil S, Bolkent S. Combined effects of vitamin C, vitamin E, and sodium selenate supplementation on absolute ethanol-induced injury in various organs of rats. Int J Toxicol 2007;26:513–23.
- Meagher EA, Barry OP, Burke A, Lucey MR, Lawson JA, Rokach J, et al. Alcohol- induced generation of lipid peroxidation products in humans. J Clin Invest 1999;104:805–13.
- Upansai CD, Khera A, Balaraman R. Effect of lead with vitamins E, C or spirulina on malondialdehyde conjugated dienes and hydroperoxides in rats. Indian J Exp Biol 2001;39:70–4.
- Duthie GG, Bellizzi MC. Effects of antioxidants on vascular health. Br Med Bull 1999;55:568–77.
- Fernandez V, Videla LA. Effects of acute and chronic ethanol ingestion on the content of reduced glutathione on various tissues of rat. Experientia 1981;37:392–394.
- Abhilash PA, Harikrishnan R, Indira M. Ascorbic acid supplementation causes faster restoration of reduced glutathione content in the regression of alcohol-induced hepatotoxicity in male guinea pigs. Redox Rep 2012;17:72–9.
- Lieber CS. Biochemical factors in alcoholic liver disease. Semin Liver Dis 1993;13:136–53.
- Purohit V, Russo D, Salin M. Role of iron in alcoholic liver disease: introduction and summary of the symposium. Alcohol 2003;30:93–7.
- Ramirez-Farias C, Madrigal-Santillan E, Gutierrez-Salinas J, Rodriguez-Sanchez N, Martinez-Cruz M, Valle-Jones I, et al. Protective effect of some vitamins against the toxic action of ethanol on liver regeneration induced by partial heapatectomy in rats. World J Gastroenterol 2008;14:899–907.
- Mandrekar P, Szabo G. Signalling pathways in alcohol induced liver inflammation. J Hepatol 2009;50:1258–66.
- Sunita Pujar, Kashinakunti SV, Gurupadappa K, Manjula R. Serum MDA, antioxidant vitamins and erythrocytic antioxidant enzymes in chronic alcoholic liver disease. A case control study. Al Ameen J Med Sci 2011;4:315–322.
- Koteish A, Yang S, Lin H, Huang X, Diehl AM. Chronic ethanol exposure potentiates lipopolysaccharide liver injury despite inhibitory Jun N-terminal kinase and caspase 3 activation. J Biol Chem 2002;277:13037–44.
- Win KM, Charlotte F, Mallat A, Cherqui D, Martin N, Mavier P, et al. Mitogenic effect of transforming growth factor- beta 1 on human Ito cells in culture: evidence for mediation by endogenous platelet-derived growth factor. Hepatology 1993;18:137–45.
- Bissell DM, Wang SS, Jarnagin WR, Roll FJ. Cell-specific expression of transforming growth factor-beta in rat liver. Evidence for autocrine regulation of hepatocyte proliferation. J Clin Invest 1995;96:447–55.
- Kisselva T, Brenner DA. Hepatic stellate cells and the reversal of fibrosis. J Gastroenterol Hepatol 2006;21:S84–7.
- Gressner AM. The cell biology of liver fibrogenesis- an imbalance of proliferation, growth arrest and apoptosis of myofibroblast. Cell Tissue Res 1998;293:447–52.
- Yokoyama H, Nagata S, Moriya S, Kato S, Ito T, Kamegaya K, et al. Hepatic fibrosis produced in guinea pigs by chronic ethanol administration and immunization with acetaldehyde adducts. Hepatology 1995;21:1438–42.
- George J, Chandrakasan G. Biochemical abnormalities during progression of hepatic fibrosis induced by dimethyl nitrosamine. Clin Biochem 2000;33:563–70.