Abstract
We chose hepcidin and its related factors as evaluating indicators to determine the degrees of iron overload in myelodysplastic syndromes (MDS) patients. A total of 73 patients and 28 healthy volunteers were enrolled in this study. We performed enzyme-linked immunosorbent assay to measure both bone marrow and peripheral blood serum hepcidin. Real-time quantitative polymerase chain reaction was used to determine the gene expression of growth differentiation factor 15 and twisted gastrulation 1. Serum ferritin (SF), C-reactive protein (CRP), and erythropoietin were measured by routine standard laboratory assays. CD4+ and CD19+ lymphocytes and Th polarization were detected by flow cytometry. Twenty-four MDS patients were measured their cardiac and liver iron deposition levels through magnetic resonance imaging (MRI) T2* examination. No significant difference was found between the bone marrow hepcidin levels and peripheral blood hepcidin levels (P = 0.134). Stratified according to different World Health Organization subtypes, refractory anemia with ringed sideroblasts patients had the lowest hepcidin levels (105.40 ± 5.13 ng/ml), while refractory anemia with excess blasts-1 had the highest levels (335.71 ± 25.16 ng/ml). Stratified according to International Prognostic Scoring System and WHO Classification-based Prognostic Scoring System, there was a significant difference of hepcidin levels between low-risk group and high-risk group in two systems, respectively (P = 0.033 and 0.009). The hepcidin levels of CD4+ high-expression group were demonstrated higher than the normal expression groups (P = 0.02), but the CD19+ high-expression group did not show the same result (P = 0.206). Meanwhile, patients with a Th1 polarization trend had a high level of hepcidin versus normal group (P < 0.001). Liver iron concentration (LIC) measured by MRI T2* had a closer correlation (r = 0.582, P < 0.001) to hepcidin than serum ferritin, by stepwise regression. C-reactive protein and LIC seemed to be the key determinants of hepcidin, by multivariate regression. Inflammation plays an important role in the regulation of hepcidin expression. T-lymphocyte activation and Th polarization trend might participate in the regulatory mechanism partly. The capability of organ iron load assessment of MRI T2* seems better than that of SF. It seems that hepcidin with CRP and LIC measured by MRI T2* are potential indicators of iron overload in MDS patients.
Keywords:
Introduction
Myelodysplastic syndromes (MDS) are comprised of a heterogeneous group of hematopoietic stem cell malignancies characterized by peripheral cytopenias and have a substantial risk of progression to acute myeloid leukemia.Citation1 Iron overload, mainly caused by transfusion dependencyCitation2 and ineffective erythropoiesis,Citation3 are common in MDS patients. It has been extensively concluded that excess iron will produce free radicals, which can damage DNA, proteins, lipids, and other cellular components. Those free radicals may typically damage cells in the heart, liver, and elsewhere, and finally cause significant adverse effect.Citation4 How to evaluate the degrees of iron overload exactly becomes a problem in clinical work. Hepcidin, a hormone synthesized by hepatocytes, plays a key role in the regulation of iron homeostasis through binding to ferroportin.Citation5 Hepcidin, and consequently the availability of iron for erythropoiesis, is regulated by iron, inflammation, hypoxia, and erythropoiesis.Citation6 Growth differentiation factor 15 (GDF15) has been identified as a hepcidin suppression factor that is expressed at high levels in patients with ineffective erythropoiesis.Citation7 Twisted gastrulation 1 (TWSG1) has been reported as a second potential erythroid regulator of hepcidinCitation8 and been demonstrated a pattern of increased expression during the earlier stages of erythropoiesis versus the mature, hemoglobinized precursors.Citation9 Besides, we are interested in whether lymphocytes would also have an impact on hepcidin expression.Citation10 Since Th cells participate in the inflammation reaction, Th polarization was involved in the study. Magnetic resonance imaging (MRI) T2* is the gold standard for assessing myocardial and hepatic iron at the moment.Citation11,Citation12 MRI T2* can rapidly assess iron content in the heart and liver, examining organ functional parameters concurrently. Here, we used MRI T2* to measure MDS patients’ myocardial and hepatic iron levels, together with serum hepcidin and serum ferritin (SF) to evaluate the degrees of iron overload. In this study, serum hepcidin and its related factors, SF, EPO, GDF15, TWSG1, lymphocyte subsets, Th polarization, and MRI T2* were all measured to evaluate iron overload in MDS patients.
Methods
Patients
Patients diagnosed with MDS between 2009 and 2012 at the Department of Hematology in the Sixth Hospital affiliated to Shanghai Jiaotong University (Shanghai, China) were enrolled in this study. After informed consent in accordance with the Declaration of Helsinki, 73 MDS patients were included. MDS subtypes were classified according to World Health Organization (WHO) 2008 Classification,Citation13 and stratified for prognosis according to International Prognostic Scoring System (IPSS)Citation14 and WHO Classification-based Prognostic Scoring System (WPSS).Citation15 Fifty-one patients had transfusion history, the other 22 did not. Patients were defined as transfusion-dependent and transfusion-independent according to National Comprehensive Cancer Network (NCCN) guideline.Citation16 More specifically, transfusion dependence means having ≧ 1RBC transfusion every 8 week over a 4-month period. Twenty-eight healthy volunteers, as controls, were enrolled to make a comparison and normal ranges with the respect of GDF15, TWSG1, lymphocyte subsets, and Th polarization. The study was approved by the Ethics Committee of the Sixth hospital affiliated to Shanghai Jiaotong University.
Enzyme-linked immunosorbent assay
Before centrifugation, peripheral blood and bone marrow samples obtained from patients were clotted for 30 minutes, then centrifuged for 15 minutes at 1000g. Serum was stored at −20°C in aliquots to avoid repeated freeze–thaw cycles. Both peripheral blood and bone marrow serum hepcidin were determined using a commercial enzyme-linked immunosorbent assay kit following the manufacturer's protocol (Cusabio Biotech, Wuhan, China).
Real-time quantitative polymerase chain reaction
Total RNA extracted from 2 ml bone marrow mononuclear cells with RNeazy Mini Kit (QIAGEN, Germany) was used as template for all reverse transcriptase reactions. cDNA was synthesized with random priming from 10 µl of total RNA with the aid of the RevertAidTM First Strand cDNA Synthesis Kit (Fermentas, Canada), following the manufacturer's protocol. For the polymerase chain reaction (PCR), 2 µl of cDNA solution was mixed with 10 µl of SYBR® Premix Ex TaqTMII (TaKaRa, Otsu, Japan), 0.4 µL for each of forward primers and reverse primers, and 7.2 µL of RNase-free water for a total volume of 20 µL. A fluorescent quantitation PCR cycler (LightCycler, Roche, Switzerland) was used for amplification of GDF15, TWSG1, and GAPDH with the following primer pairs: GDF15 forward (for), GTGTTGCTGGTGCTCTCGTG; GDF15 reverse (rev), CGGTGTTCGAATCTTCCCAG; TWSG1 forward (for), AGCCACACCACCAGAATGTGTC; TWSG1 reverse (rev), CACTCGCAGCAGGCATTATGA; GAPDH forward (for), GCACCGTCAAGGCTGAGAAC; and GAPDH reverse (rev), GTGGTGAAGACGCCAGTGGA. The amplification consisted of denaturation at 95°C for 5 seconds, annealing at 62°C for 20 seconds, and extension at 72°C for 10 seconds (43 cycles). The threshold cycle (Ct) was subsequently determined. Expression levels of GDF15 and TWSG1, normalized to GAPDH and relative to a calibrator, was expressed as 2−ΔΔCt (fold difference).
Biochemical assays
SF, C-reactive protein (CRP) and erythropoietin (EPO) were measured by routine standard laboratory assays. SF is determined by radioimmunoassay. CRP is determined by immune turbidimetric method. EPO is determined by immunoradiometric assay.
Flow cytometry
CD4+ lymphocytes and CD19+ lymphocytes were detected by flow cytometry which was performed using Coulter Epics-XL (Beckman Coulter, Fullerton, CA, USA) and analyzed by System II Software (Beckman Coulter). The measurement of Th subsets was performed by flow cytometry determination of cytoplasmic interferon-γ (IFN-γ) and interleukin-4 (IL-4) in marrow CD4+ cells. Briefly, bone marrow aspiration, anticoagulated by heparin lithium, was incubated with 2.5 mg/dl phorbol 12-myristate 13-acetate, 100 mg/dl ionomycin, and 10 g/dl Brefeldin A (Sigma Chemical Co., St Louis, MO, USA) at 37°C in a humidified atmosphere with 5% CO2 for 4 hours. The cells were then stained anti-CD3 with PC5-labeled and anti-CD8 with ECD-labeled (Beckman Coulter) at room temperature for 15 minutes. After treatment with lysing solution (Intra-PreP Permeabilization reagent A, Beckman Coulter) and permeabilizing solution (IntraPreP Permeabilization reagent B, Beckman Coulter), cells were stained with fluorescein-isothiocyanate-labeled anti-human IFN-γ and phycoerythrin (PE)-labeled anti-human IL-4 (Beckman Coulter) at room temperature for 15 minutes. For each tube, 10 000 events were collected in a gate created around the viable lymphocyte population. A second gate was then created around the CD3+ cells. Dot plots of CD8 versus type I and type II cytokines were created. Then, the percentages of CD8+ and CD8− cytokine-producing cells in the total CD3+ cell population were calculated. Th subsets were defined as Th1 (CD8−/INF-γ+), Th2 (CD8−/IL-4+).Citation17 Th1/Th2 > 70.6 is considered having a th1 polarization trend.
MRI T2*
The theoretical foundation of MRI T2* is that iron deposition disrupts the homogenous magnetic field and shortens T1 and T2 times in a concentration-dependent manner. Twenty-four MDS patients underwent MRI examination with a 3.0 T Siemens MRI unit (Siemens, Munich, Germany), including 4 refractory cytopenia with unilineage dysplasia (RCUD) patients, 2 ringed sideroblasts (RARS) patients, 11 refractory cytopenia with multilineage dysplasia (RCMD) patients, 3 refractory anemia with excess blasts-1 (RAEB-1) patients, and 4 MDS, unclassified (MDS-U) patients. Cardiac and liver iron levels were measured using a 10–15 seconds breath-hold multiple-gradient echo T2* sequence. Average T2* values were measured using the region of interest (ROI) in the left ventricle septum and liver parenchyma. Liver ROI were sampled in regions devoid of blood vessels. T2* values were calculated by fitting the data to mono-exponential decay curves. Liver iron concentration (LIC) were calculated using an accepted conversion formula.Citation18 Cardiac T2*<20 ms or LIC>2 mg/g dry weight is considered as a sign of iron overload.Citation4
Statistical analyses
All statistical analysis was performed using the SPSS 17.0 software (SPSS Inc., Chicago, IL, USA). Quantitative data were expressed as means plus or minus SD with significance calculated by Student's t-test or analysis of variance (ANOVA). Non-Gaussian distribution data were log-transformed first, then analyzed as quantitative data. Correlations between quantitative variables were assessed using Pearson's coefficient. To make a comparison between SF and MRI T2*, we performed a stepwise regression. A multiple linear regression was used to describe the correlations between hepcidin level and its related factors.
Results
Bone marrow (BM) hepcidin levels versus peripheral blood (PB) hepcidin levels
showed the main characteristics of study object. BM hepcidin levels were 265.66 ± 102.77 versus 301.61 ± 91.56 ng/ml of PB hepcidin levels in MDS patients. As showed, no significant difference was found between BM hepcidin levels and PB hepcidin levels (P = 0.134).
Figure 1. Bone marrow hepcidin levels vs. peripheral blood hepcidin levels in MDS patients. There was no significant difference between bone marrow hepcidin levels and peripheral blood hepcidin levels in MDS patients (P = 0.134).
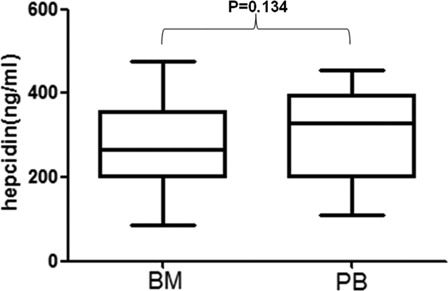
Table 1. Characteristics of MDS patients and controls
MDS patients stratified according to different WHO subtypes
As showed, hepcidin levels had a heterogeneity across the different MDS subtypes (P = 0.041 by ANOVA), with the lowest levels in patients with refractory anemia with RARS and the highest levels in patients with RAEB-1. SF, CRP, EPO, and GDF15 were consistently heterogeneous across the different MDS subtypes. On the contrary, there was no significant difference in TWSG1 between MDS subtypes, neither cardiac T2* nor LIC levels.
Table 2. Characteristics of MDS patients stratified according to WHO subtypes
MDS patients stratified according to IPSS and WPSS
Besides hepcidin, SF, CRP, EPO, GDF15, and TWSG1 all exhibited no difference between the low-risk group and the high-risk group according to IPSS (). In WPSS groups, hepcidin, SF, and GDF15 showed a significant difference between the low-risk group and the high-risk group, while there was no significant difference in EPO and TWSG1 levels between low- and high-risk WPSS groups.
Table 3. Characteristics of MDS patients stratified according to IPSS and WPSS
Transfusion-dependent patients versus transfusion-independent patients
As expected, showed that transfusion-dependent MDS patients had significantly lower levels of hepcidin as compared to transfusion-independent patients. Transfusion-dependent MDS patients also had significantly higher levels of SF, EPO, GDF15, TWSG1, and LIC.
Table 4. Transfusion-dependent patients vs. transfusion-independent patients
Hepcidin correlated with SF and LIC
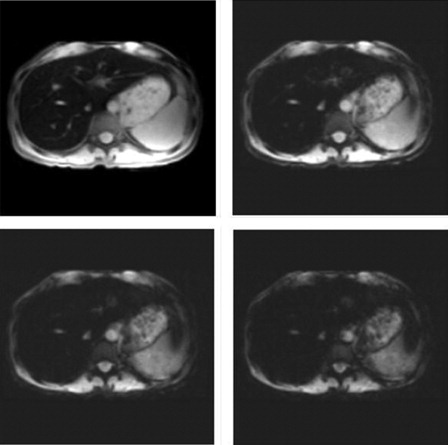
We performed a stepwise regression model including SF and LIC with hepcidin in 24 MDS patients who had undergone MRI T2* test. The regression result suggested that LIC transformed from liver T2* was correlated with hepcidin (r = 0.582, P < 0.001). As showed, the patient's SF value was 897 µg/l, but his LIC was 17.56 mg/g dry weight which meant severe iron overload.
Hepcidin levels in different lymphocyte subsets and Th polarization
We divided 22 MDS patients who had not ever been treated with transfusion into CD4+ high expression and CD4+ normal expression group, CD19+ high expression and CD19+ normal expression group, Th1/Th2 > 70.6 group and Th1/Th2≦70.6 group, respectively ( and ). The hepcidin levels of CD4+ high-expression group were demonstrated higher than the normal expression groups (P = 0.02), but the CD19+ high-expression group did not show the same result (P = 0.206). Meanwhile, there was a statistical difference between Th1/Th2 > 70.6 group and Th1/Th2 ≦ 70.6 group (P < 0.001).
Figure 2. The expression levels of hepcidin in CD4+ lymphocytes and CD19+ lymphocytes in non-transfusion-treated MDS patients. The expression level of hepcidin in CD4+ high-expression group is higher than the normal-expression group. Statistical difference has been found (P = 0.02). There is no significant difference between CD19+ high-expression group and normal-expression group (P = 0.206).
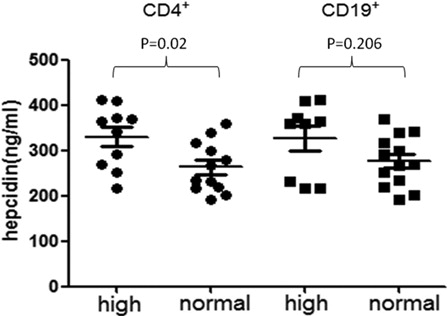
Figure 3. Hepcidin levels in T-cell polarization of Th1/Th2 in non-transfusion-treated MDS patients. There is a significant difference between Th1/Th2 > 70.6 group and Th1/Th2 ≦ 70.6 group (P < 0.001). If the ratio of Th1/Th2 is over 70.6, it is considered that the patient has a Th1 polarization trend.
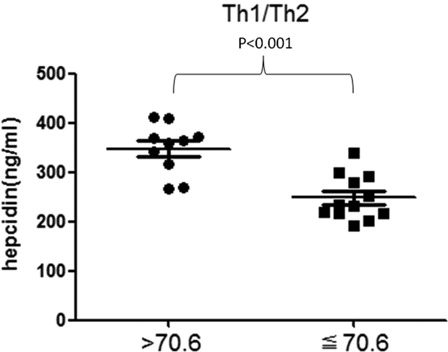
Figure 4. The MRI T2* images of one MDS patient whose SF < 1000 µg/l. The MRI T2* images of one MDS patient whoseSF < 1000 µg/l. The patient's SF value is 897 µg/l, but his LIC is 17.56 mg/g dry weight which means severe iron overload.
Hepcidin levels and its related factors in MDS
To evaluate the independent determinants of serum hepcidin levels in MDS patients we performed multivariate linear regression models including possible confounders like age, SF, GDF15, and so on (). Notably, CRP levels (r = 0.302, P = 0.001) and LIC levels (r = 0.298, P = 0.031) remained as significant predictors of serum hepcidin levels.
Table 5. Linear regression model of hepcidin predictors in MDS patients
Discussion
Iron overload in MDS patients is caused by transfusion dependency and ineffective erythropoiesis mostly. It has been demonstrated that transfusion dependency is strongly associated with decreased survival and increased risk of leukemic transformation in MDS patients with iron overload.Citation19–Citation21 Hepcidin, a peptide synthesized predominantly in the liver, is the principal regulator of iron homeostasis.Citation22 In our study, we measured hepcidin and its related factors, such as SF, CRP, GDF15, TWSG1, in order to formulate an assessment system of iron overload evaluation among MDS patients.
Previous study on hepcidin was assessed in peripheral blood or urinary. We, this time, took a look at the iron regulatory mechanism in bone marrow. First of all, PB and BM hepcidin levels of 73 MDS patients were measured. No significant difference was found between PB hepcidin and BM hepcidin, suggesting that bone marrow might have a similar iron homeostasis environment as peripheral blood did, which laid a foundation for our study.
As Santini and her colleagues did,Citation23 hepcidin levels varied broadly among the subtypes of WHO classification showed a heterogenity like MDS itself. The ratio of hepcidin to ferritin showed a difference between RA, RARS, RCMD, RAEB-1, -2, MDS-U, and 5q- syndrome, indicating a difference in the blunting of the hepcidin response to iron in different MDS subtypes. As we all know, ring sideroblasts can develop by a defect in intracellular iron metabolism in erythroid cells in RARS. Among different MDS subtypes, RARS patients had the highest hepcidin levels which indicated that RARS patients might have a severe iron load than other subtypes patients did, though RCMD patients even had a higher hepcidin level than RARS. Furthermore, the ration of hepcidin to ferritin in RARS presenting a low level demonstrates that the mechanism of iron regulation in RARS patients exhibits defect.
The severity of bone marrow disease is at least partly determined by karyotype abnormalities. Transfusion therapy also aggravates the disease. So we analyzed hepcidin levels stratified to IPSS and WPSS. Transfusion-dependence has been introduced in the WPSS. Our results, which hepcidin, SF and GDF15 in WPSS groups showed a significant difference between the low-risk group and the high-risk group while there was no significant difference of them in IPSS groups, suggested that transfusion-dependence, as a risk factor that is independent of cytogenetic risk groups,Citation19 might be the main cause of iron overload in MDS. The prognostic influence of transfusion-dependence is not only based on the severity of the underlying bone marrow disease but also on an additional component, which is most likely to be the effects of iron overload.Citation4 Moreover, transfusion-dependent MDS patients had significantly lower levels of hepcidin and significantly higher levels of SF, EPO, GDF15, TWSG1, and LIC compared to transfusion-independent patients. Long-term transfusion therapy causes iron deposition. Hepcidin should be elevated to balance iron homeostasis. However, the transfusion-dependence group showed a low hepcidin level than transfusion-independent group, which might have caused by a decompensation of multi-mechanism. Transfusion-dependent MDS patients had high levels of GDF15 and TWSG1, so did patients with ineffective erythropoiesis. We believe that it is the imbalance of iron regulation metabolism leads to a vicious cycle in MDS patients with iron overload. Namely the increased intramedullary apoptosis and ineffective hematopoiesis release the excess iron repeatedly. A large number of the excess iron causes oxidative stress elevated leading to tissue hypoxia. On the other hand, anemia cannot be controlled though red blood cells are transfused again and again. Studies have shown that when GDF15 reaches a high level (>5000 pg/ml) can inhibit the secretion of hepcidin, precisely because of severe degree of iron overload leads to elevated GDF15 expression, which in turn inhibits hepcidin. EPO found in an in vitro experiment can promote the secretion of GDF15.Citation24 High levels of EPO in transfusion-dependent patients caused GDF15 elevated and high levels of GDF15 further suppressed hepcidin synthesis.
GDF15 and TWSG1 have been demonstrated as the hepcidin suppression factors in ineffective erythropoiesis diseases.Citation9,Citation25 In our study, GDF15 and TWSG1 mRNA expression levels of transfusion-dependent patients were six- and two-fold higher than transfusion-independent patients. But neither GDF15 nor TWSG1 was correlated with hepcidin levels. The regression model included the whole population. Iron overload caused by ineffective erythropoiesis is a long-term process. We need take transfusion into account to evaluate the GDF15 and TWSG1 expression levels. Moreover, in vitro studies have shown that significant hepcidin suppression requires very high GDF15 levels.Citation26
We performed a stepwise regression model including SF and LIC with hepcidin in 24 MDS patients who had undergone MRI T2* test. Although SF itself showed a significant correlation with hepcidin (r = −0.021, P = 0.047), the stepwise regression result suggested that only LIC, transformed from liver T2*, was correlated with hepcidin (r = 0.582, P < 0.001). Moreover, it seems that SF had no correlation with LIC, either (). The concentration of SF has been shown to increase in response to iron storage, inflammation, tumor, and transfusion. Patients with MDS have tumor loads and infection may affect the SF values. It seems that MRI T2* is more accurate in monitoring organ iron load, especially liver, than SF. We strongly recommend that MDS patients, no matter he/she has been treated with transfusion or not need to be tested with MRI T2* to evaluate the degrees of heart and liver iron load. However, SF levels above 1000 µg/l remain an independent prognostic factor at present until much more MRI T2* samples to demonstrate.
Pinto and his colleagues have demonstrated that hepcidin mRNA expression increases after T-lymphocyte activation, CD4+ and CD19+ lymphocytes expressed approximately twice as much hepcidin mRNA as CD8+ lymphocytes.Citation10 Moreover, T-lymphocyte polarization is one of the parameters of immune state. We made comparisons in CD4+ lymphocytes, CD19+ lymphocytes and T-lymphocyte polarization groups in non-transfusion-treated MDS patients in order to find out the influence of immune state, especially T-lymphocyte, on hepcidin expression without transfusion therapy. No significant difference was found between CD19+ high -expression group and CD19+ normal expression, while there was a statistical difference in CD4+ groups and T-lymphocyte polarization groups. It has been demonstrated that hepcidin mRNA expression increases after T-lymphocyte activation.Citation10 The increased level of hepcidin now seen in CD4+ lymphocyte high-expression group might be related to the reported changes in serum iron levels seen in experimental and/or clinical models of acute inflammation known to involve lymphocyte activation.Citation27 Since lymphocyte activation has not been involved in our study, the results need to be further proved. On the other hand, type 1 cells secrete more tumor necrosis factor-α (TNF-α) than type 2 cells.Citation28 TNF-α mediates hepcidin induction by holotransferrin (Fe-TF) in lymphocytes.Citation10 Inflammatory stimuli acting through TNF-α suppressed hemojuvelin mRNA expression, thus perhaps preventing the iron-regulatory pathway from suppressing hepcidin during hypoferremia of inflammation. A Th1 polarization trend has been demonstrated in MDS patients compared with normal.Citation29 It seems that MDS patients with a Th1 polarization trend synthesize more TNF-α which causes increased hepcidin levels. A recent study shows that there is a necessary interaction of TNF-α with CD4+ cells in the development of delayed type hypersensitivity responses in young subjects.Citation30 Moreover, CD4+ lymphocyte and T-lymphocyte polarization might influence hepcidin levels altogether when inflammation states are included. However, it still remains unclear whether such changes of these lymphocytes precede or occur after the development of iron overload. Above all, inflammation is still the key determinant of hepcidin expression, especially when the lymphocyte is activated. Since the characteristics of MDS are heterogeneous, we chose CRP as a mark of inflammation. CRP has a close relation with hepcidin levels which is compatible with other predictors (r = 0.302, P = 0.001).
In summary, inflammation has a huge impact on hepcidin expression. T-lymphocyte activation and Th polarization trend might participate in the regulatory mechanism partly. Organ iron load levels measured through MRI T2* is more accurate than SF. It seems that hepcidin with CRP and LIC measured by MRI T2* are potential indicators of iron overload in MDS patients. But, it still remains to be demonstrated by a large sample experiment including SF, hepcidin levels, CRP, LPI, MRI T2*, liver/cardiac biopsy, intracellular iron stain, and so on.
Funding: This study was supported in part by the National Nature Science Foundation of China (NNSFC81170463).
References
- Tefferi A, Vardiman JV. Myelodysplastic syndromes. N Engl J Med. 2009;361(19):1872–85.
- Mahesh S, Ginzburg Y, Verma A. Iron overload in myelodysplastic syndromes. Leuk Lymphoma 2008;49(3):427–38.
- Tanno T, Miller JL. Iron loading and overloading due to ineffective erythropoiesis. Adv Hematol. 2010;2010:358283.
- Gattermann N, Rachmilewitz EA. Iron overload in MDS-pathophysiology, diagnosis, and complications. Ann Hematol. 2011;90(1):1–10.
- Ganz T, Nemeth E. Hepcidin and disorders of iron metabolism. Annu Rev Med. 2011;62:347–60.
- Nemeth E. Iron regulation and erythropoiesis. Curr Opin Hematol. 2008;15(3):169–75.
- Tanno T, Noel P, Miller JL. Growth differentiation factor 15 in erythroid health and disease. Curr Opin Hematol. 2010;17(3):184–90.
- Tanno T, Bhanu NV, Oneal PA, Goh SH, Staker P, Lee YT. High levels of GDF15 in thalassemia suppress expression of the iron regulatory protein hepcidin. Nat Med. 2007;13(9):1096–101
- Tanno T, Porayette P, Sripichai O, Noh SJ, Byrnes C, Bhupatiraju A. Identification of TWSG1 as a second novel erythroid regulator of hepcidin expression in murine and human cells. Blood. 2009;114(1):181–6.
- Pinto JP, Dias V, Zoller H, Porto G, Carmo H, Carvalho F. Hepcidin messenger RNA expression in human lymphocytes. Immunology. 2009;130(2):217–30.
- Fragasso A, Ciancio A, Mannarella C. Myocardial iron overload assessed by magnetic resonance imaging (MRI)T2* in multi-transfused patients with thalassemia and acquired anemias. Eur J Intern Med. 2011;22(1):62–5.
- Cheng HL, Holowka S, Moineddin R, Odame I. Liver iron overload assessment by T2* magnetic resonance imaging in pediatric patients: an accuracy and reproducibility study. Am J Hematol. 2012;87(4):435–7.
- Brunning R, Orazi A, Germing U, Porwit A, Baumann I. Myelodysplastic syndromes. In: , Swerdlow S, Campo E, Harris NL, et al.(eds.) World Health Organization classification of tumours of haematopoietic and lymphoid tissue, 4th ed. Lyon, France: IARC Press; 2008. p. 88–103.
- Greenberg P, Cox C, LeBeau MM, Fenaux P, Morel P, Sanz G, et al. International scoring system for evaluating prognosis in myelodysplastic syndromes. Blood. 1997;89(6):2079–88.
- Malcovati L, Germing U, Kuendgen A, Della Porta MG, Pascutto C, Invernizzi R. Time-dependent prognostic scoring system for predicting survival and leukemic evolution in myelodysplastic syndromes. J Clin Oncol. 2007;25(23):3503–10.
- Greenberg PL, Attar E, Bennett JM, Bloomfield CD, De Castro CM, Deeg HJ. NCCN clinical practice guidelines in oncology: myelodysplastic syndromes. J Natl Compr Cancer Netw. 2011;9(1):30–56.
- Li X, Xu F, He Q, Wu L, Zhang Z, Chang C. Comparison of immunological abnormalities of lymphocytes in bone marrow in myelodysplastic syndrome (MDS) and aplastic anemia (AA). Intern Med. 2010;49(14):1349–55.
- Ghoti H, Rachmilewitz EA, Simon-Lopez R, Gaber R, Katzir Z, Konen E. Evidence for tissue iron overload in long-term hemodialysis patients and the impact of withdrawing parenteral iron. Eur J Haematol. 2012;89(1):87–93.
- Malcovati L, Della Porta MG, Pascutto C, Invernizzi R, Boni M, Travaglino E. Prognostic factors and life expectancy in myelodysplastic syndromes classified according to WHO criteria: a basis for clinical decision making. J Clin Oncol. 2005;23(30):7594–603.
- Malcovati L, Della Porta MG, Cazzola M. Predicting survival and leukemic evolution in patients with myelodysplastic syndrome. Haematologica. 2006;91(12):1588–90.
- Platzbecker U, Hofbauer LC, Ehninger G, Hölig K. The clinical, quality of life, and economic consequences of chronic anemia and transfusion support in patients with myelodysplastic syndromes. Leuk Res. 2012;36(5):525–36.
- Park CH, Valore EV, Waring AJ, Ganz T. Hepcidin, a urinary antimicrobial peptide synthesized in the liver. J Biol Chem. 2001;276(11):7806–10.
- Santini V, Girelli D, Sanna A, Martinelli N, Duca L, Campostrini N. Hepcidin levels and their determinants in different types of myelodysplastic syndromes. PLoS One. 2011;6(8):e23109.
- Ramirez JM, Schaad O, Durual S, Cossali D, Docquier M, Beris P. Growth differentiation factor 15 production is necessary for normal erythroid differentiation and is increased in refractory anaemia with ring-sideroblasts. Br J Haematol. 2009;144(2):251–62.
- Finkenstedt A, Bianchi P, Theurl I, Vogel W, Witcher DR, Wroblewski VJ. Regulation of iron metabolism through GDF15 and hepcidin in pyruvate kinase deficiency. Br J Haematol. 2008;144(5):789–93.
- Tamary H, Shalev H, Perez-Avraham G, Zoldan M, Levi I, Swinkels DW. Elevated growth differentiation factor 15 expression in patients with congenital dyserythropoietic anemia type I. Blood. 2008;112(13):5241–4.
- van Deuren M, Kroot JJ, Swinkels DW. Time-course analysis of serum hepcidin, iron and cytokines in a C282Y homozygous patient with Schnitzler's syndrome treated with IL-1 receptor antagonist. Hematologica. 2009;94(9):1297–300.
- Gorak-Stolinska P, Truman JP, Kemeny DM, Noble A. Activation-induced cell death of human T-cell subsets is mediated by Fas and granzyme B but is independent of TNF-alpha. J Leukoc Biol. 2001;70(5):756–66.
- Tsuda H, Yamasaki H. Type I and type II T-cell profiles in aplastic anemia and refractory anemia. Am J Hematol. 2000;64(4):271–4.
- Agius E, Lacy KE, Vukmanovic-Stejic M, Jagger AL, Papageorgiou AP, Hall S. Decreased TNF-alpha synthesis by macrophages restricts cutaneous immunosurveillance by memory CD4+ T cells during aging. J Exp Med. 2009;206(9):1929–40.