
Abstract
Introduction
T-cell acute lymphoblastic leukemia (T-ALL) is caused by a defect in T-cell maturation to the mature T cell. T-ALL is a poor prognostic hematopoietic malignancy. In order to establish a successful therapeutic treatment plan, it is essential to understand the biology of T-cell development and molecules that contribute to this process. This study uses Jurkat T cells, as a well-established model for in vitro study of T-ALL to investigate the role of the microRNA (miRNA), miR-146a, on gene expressions involved in T-cell differentiation.
Materials and methods
The permanent over-expression of miR-146a was established using a lentivector that expressed GFP hsa-mir-146a miRNA. We used quantitative real-time polymerase chain reaction and flow cytometry for T-cell differentiation to monitor induction of the differentiation process by assessing changes in expression of some distinct transcription factors and cell surface markers.
Results
Ectopic expression of miR-146a resulted in significant up-regulation of PU.1, c-Fos, CCAAT/enhancer-binding protein alpha (C/EBPα) and GATA3, and slight up-regulation of Foxp3 and Runx1. There was a significant, moderate down-regulation in the expressions of Notch1, LIM-domain only (Lmo2), son of sevenless 1 (SOS1), Ikaros, and signal transducer and activator of transcription 3 (STAT3).
Conclusion
Our results indicated that ectopic expression of miR-146a could not independently induce differentiation in lymphoblastic cells. However, the expression of multiple genes involved in T-cell differentiation and T-cell CD markers were found to be affected. These results have suggested a potential tumor suppressive, immunomodulatory and cell activator role for miR146-a.
Keywords:
Introduction
Lineage specification, commitment, and differentiation of T-lymphoid cells require expression of some overlapping and distinct transcription factors (TFs), genes, and CD makers. TFs such as E2A, TCF1, LEF1, GATA3, Notch1, and Runx1 play a decisive role in initiation of T-cell differentiation.Citation1 During the commitment and maturation period of T cells from their early T-cell precursors, the expressions of TFs such as Notch1, GATA3, Runx1, Bcl11b, Ets1, and Ets2 are up-regulated, while others such as CCAAT/enhancer-binding protein alpha (C/EBPα), GATA2, LIM-domain only (Lmo2), and Pu.1 are down-regulated.Citation2 Increases or decreases in expression of TFs are essential for survival, development, differentiation, and specification of T cells. In addition, specific CD markers are expressed on the surface of T cells during their specification, each of which is characteristic of a specific T-cell type.
Among the important CD markers expressed during T-cell development are CD2, which is involved in important T-cell activation and proliferation pathways;Citation3 T-cell surface glycoprotein CD3 epsilon chain plays an essential role in T-cell development;Citation4 CD4 and CD8 are expressed on the surface of helper and cytotoxic T cells, respectively; CD25 which is present on activated T cells; and rearrangement of TCRα gene locus initiating in double positive stage.Citation5 MicroRNAs (miRNAs) are small, noncoding, post-transcriptional regulatory RNA molecules that repress gene expression. Some miRNAs such as miR-16, miR-142-3p, miR-146a, miR-150, and miR-342 have been reported to be involved in determining the fate of T cells.Citation6,Citation7 MiR-146a is an important molecule that controls hematopoiesis, lymphopoiesis, and cancer, and is located on chromosome 5.
Expression of miR-146a is increased from the naïve T cell up to the memory T-cell stage. This molecule is involved in differentiation of various T-cell types by modulating some specific important genes effective in T-cell differentiation.Citation8
The miRNAs expression atlas in hematopoietic lineage differentiation shows that miR-146a is expressed in mature T cells, but is not detected in the Jurkat cell line, which consists of undifferentiated T lymphoblasts.Citation9 This lack of expression in lymphoblasts may indicate a likely role for this molecule in the T-cell differentiation process. Some of the primary target genes of miR-146a are STAT3, Spi-1/PU.1, c-Fos, chemokine (C-X-C motif) receptor 4 (CXCR4), Lmo2 and Notch1.Citation10–Citation12 These genes have a vital effect during T-cell development (). In this study, we have utilized ectopic overexpression of miR-146a in Jurkat cells as the most common, in vitro model of T-cell acute lymphoblastic leukemia (T-ALL) to investigate the role of miR-146a on important genes which are altered during T-cell maturation.
Table 1. T-cell target genes of miR-146a
Materials and methods
Cell culture
The Jurkat cell line was purchased from Pasture Institute of Iran and maintained in RPMI-1640 medium (Gibco, Carlsbad, CA, USA) that contained 2 mmol/l glutamine, 25 mmol/l HEPES, 1.5 g/l sodium bicarbonate, 10% fetal calf serum (FCS), 50 U/ml penicillin and 50 g/ml streptomycin at 37°C in 5% CO2. Lentivirus packaging cell line HEK293T was cultured in DMEM medium supplemented with 10% FCS (Gibco, Carlsbad, CA, USA). The cells were collected and analyzed at days 14 and 28.
Recombinant lentiviral production and transduction
Lentivector-expressing GFP hsa-mir-146a miRNA and pLenti-III-GFP-Blank as the negative control were purchased from ABM Good Company, Canada. pCMV-dR8.2 dvpr (gag, pol, rev, tat) and pMD-2 (VSV-G) were kindly provided by Dr Didier Trono (School of Life Sciences, Swiss Institute of Technology, Lausanne, Switzerland).
Transfer vectors (pLenti-III-GFP-Blank, GFP hsa-mir-146a) and helper vectors (pMD-2, pCMV-dR8.2 dvpr) plasmids were co-transfected into HEK293T cells by the CaPO4 base method according to the protocol adapted from Dr Didier Trono with some modifications. In brief, HEK293T cells were plated one day before transfection, and were passaged when they reached more than 70% confluency. The medium was replaced 2 hours before transfection with fresh DMEM that contained 10% FBS. We used 21 µg of transfer vector, 21 µg of dR8, and 10.5 µg of pMD.2 DNA mixed in 33 µl of 1X TE buffer and 105 µl Cacl2 (2.5 M), which was mixed with HEPES water to volume of 1100 µl. Subsequently, we added HBSS 2X (1050 µl) during vortex to reach 2100 µl total amount for each 10-cm plate. The transfect efficiency was verified by fluorescent microscope according to GFP expression at 16 hours after transfection and changed the medium contain CaPo4 mixture. Next we added 12 ml of fresh medium with normal 10% FBS. The supernatant that contained the produced viruses (mir-146a) were collected at 24, 48, and 72 hours after transfection and added to 1 × 10⁵ Jurkat cells in 2.0 ml of complete RPMI without FBS. Cells were centrifuged at 2000 rpm for 60 minutes at 25°C according to the spinoculation method. Cells were plated in a T25 flask and incubated overnight in a 37°C, 5% CO2 incubator. The media were refreshed 24 hours after transduction. After one week of cell expansion the GFP-positive cells were sorted by BD FACSAria II.
mRNAs and miRNAs extraction, cDNA synthesis, and real-time polymerase chain reaction assays
We extracted total and Small (<200 nt) RNA from the harvested cells using the RNX Plus™ solution (Cinnagen, Iran) according to the manufacturer's instructions. RNA was quantified by absorbance at 260 nm. cDNA was synthesized from 5 µg of total RNA using a cDNA synthesis kit (Fermentas Life Sciences, St Leon-Rot, Germany) based on the manufacturer's instructions. mRNA was quantified by real-time polymerase chain reaction (PCR) with the Fermentas SYBR Green Mastermix (Fermentas Life Sciences, St Leon-Rot, Germany) in a Rotor-Gene 6000 system (Corbett, Concorde, NSW, Australia) according to the manufacturer's instructions. The TaqMan® MicroRNA Reverse Transcription Kit (Applied Biosystems, Grand Island, NY, USA) was used according to the manufacturer's instructions for reverse transcription with target specific stem loop primers provided in the TaqMan® miRNA assays. hsa-miR-146a TaqMan miRNA assays were used. Also we follow the MIQE guidelines for better experimental practice and more reliable and unequivocal interpretation of our teal-time PCR results.Citation23 For mRNA, the data were normalized using the endogenous HPRT1, β2m, and GAPDH controls. The following primers were used for cDNA synthesized from mRNA: FOXP3 forward (F): TGGCATCATCCGACAAGG; FOXP3 reverse (R): AGGAACTCTGGGAATGTGC; PU.1 F: GGAGAC AGGCAGCAAGAAG;PU.1R:TTGTCCACCCACCAGATG; C/EBPα F: TGGGCGGCATCTGCGAG; C/EBPα R: CCAGGAACTCGTCGTTGAAGG; Ikaros F: ATCTCTCGTGCTGGACAG; Ikaros R: TTCGTTCTCCTTCTCGTAGC; SOS1 F: GTGGTTTGAGAAATGTATTGTAG; SOS1 R: CTGGCGACTTGGTATTTG; c-Fos F: GCAAGGTGGAACAGTTATCTC; c-Fos R: GCAGGTTGGCAATCTCG; GATA2 F: AGC CGG CAC CTG TTG TGC AA; GATA2 R: TGA CTT CTC CTG CAT GCA CT;GATA3 F: GAGACAGAGCGAGCAACG; GATA3 R: CTCGGGTCACCTGGGTAG; Lmo2 F: CCCTTCAGAGGAACCAGT G; Lmo2 R: GCAGTCCTCGTGCCAGTAC; Ets2 F: CAGCGGCAGGATGAATG; Ets2 R: CATCAAAGGTGTCAAAGGC; Runx1 F: GATGCAGGATAC AAGGCAG; Runx1 R: CACAGAAGGAGAGGCAATG; STAT3 F: CGGCGTCCAGTTCACTAC; STAT3 R: CCCAGAGTCTTTGTCAATGC; STAT6 F: GAGCCACTACAAGCCTGAAC; STAT6 R: CCATTCCAAGGTCATAAGAAG; Notch1 F:CTGGTCAGGGAAATCGTG; Notch1 R:TGGGCAGTGGCAGATGTAG; CXCR4 F: CGC CAC CAA CAG TCA GAG; CXCR4 R: AAC ACA ACC ACC CAC AAG TC; CD2 F: GGAGTCGGAGAAATGATGAG; CD2 R: TGGTGGAGGAGGATGTTG; CD3ε F: GCCTCTCTACTTCCTGTGTG; CD3ε: CCATTTCTTCATTACCATCTTGC; CD4 F: ATTGGGCTAGGCATCTTC; CD4 R: AAACCGGTGAGGACACTG; CD8 F: CAACCACAGGAACCGAAG; CD8R: TGAATACACAGGGAGGAAGAC; CD25 F: AGCGGAGACAGAGGAAGAG; CD25 R:GGCAAGCACAACGGATG;TCRα F: CATCTGTCAGGAGAGGCTTC; TCRα R: GGTCAGGAGCAGGTCAAAC; HPRT1 F: CCT GGC GTC GTG ATT AGT G; HPRT1 R: TCA GTC CTG TCC ATA ATT AGT CC; β2m F: ATG CCT GCC GTG TGA AC; β2m R: ATC TTC AAA CCT CCA TGA TG; GAPDH F CCT CAA GAT CAT CAG CAA TG; GAPDH R: CAT CAC GCC ACA GTT TCC.
Flow cytometry
To detect surface markers, we used purified PE-conjugated antibody against CD3, CD7, and CD8 (DAKO, Glostrup, Denmark) according to the manufacturer's instructions. PE-conjugated mouse IgG1 antibody (DAKO, Glostrup, Denmark) was used as an isotype-matched control. After labeling, the cells were washed and suspended in 1% (w/v) paraformaldehyde. And processed in a FACS flow cytometer PARTEC PAS III (Partec, Munster, Germany) equipped with an argon and red diode laser. FloMax 2.4 software (PartecFloMax Operating and Analyzing Software; Partec) was used to create the histograms. Cells were gated out with a forward versus side scatter window.
Statistical analysis
Data were analyzed using the Statistical Package for the Social Sciences (SPSS version 13.0). Each experiment was repeated at least three times. REST software (2009, QIAGEN, Valencia, USA) was used to analyzed real-time PCR data. P ≤ 0.01 was considered to be statistically significant.
Results
Ectopic miR-146a expression
Jurkat cells were FACS-purified and analyzed by real-time PCR to confirm ectopic expression of miR-146a. The results indicated that expression of miR-146a increased 474.4 fold in Jurkat cells compared with control cells (A). In addition, we evaluated the expression of miR-146a in nontransduced Jurkat cells and compared them with normal PB-MNC. Expression of miR-146a was negligible in nontransduced Jurkat cells (B).
Figure 1. (A) Quantification of ectopic miR-146a expression in transduced Jurkat cells in comparison with group transduced by the backbone of the vector. (B) Relative expression of miR-146a in non-transduced Jurkat in compared with normal PB-MNC, which show marked down-regulation in none transduced Jurkat cells.

Regulatory transcription factors and key T-cell identity genes
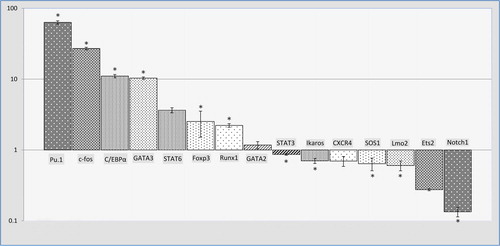
We measured transcript levels of PU.1, c-Fos, C/EBPα, GATA2, GATA3, STAT3, STAT6, Foxp3, Runx1, Ikaros, SOS1, Lmo2, Ets2, Notch1, and CXCR4 in transduced Jurkat cells and control cells. Our intent was to examine the changes in T-lineage TFs and regulatory gene expression during the expected differentiation. The results showed significant up-regulation of PU.1 (63.338), c-Fos (27.096), C/EBPα (11.043), and GATA3 (10.339), and slight up-regulation of Foxp3 (2.523) and Runx1 (2.219). There was a significant, moderate down-regulation in the expression of Notch1 (0.134) and Lmo2 (0.603), SOS1 (0.639), Ikaros (0.702), and STAT3 (0.862), respectively. No significant changes were seen in the expressions of STAT6, Ets2, GATA2, and CXCR4 TFs ().
Figure 2. Expression analysis of regulatory transcription factors (TFs) using real-time PCR.
Transcription of T-lymphocyte markers
mRNA transcripts of CD2, CD3ɛ, CD4, CD8, CD25, and TCRα markers were measured by quantitative real-time PCR to evaluate T-cell differentiation.
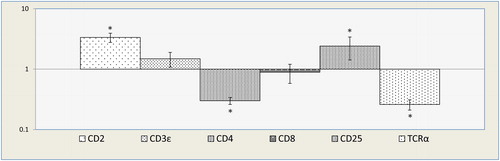
Gene expression analyses of CD2, CD3ε, CD4, CD8, CD25, and TCR-α in miR-146a transduced Jurkat cells showed a statistically significant increase in CD2 (3.352 fold) and CD25 (2.412 fold). A decrease in CD4 (0.3 fold) and TCRα (0.26 fold) was observed. There was no significant change in CD3ɛ and CD8 expression (P > 0.01; ). These data have indicated that ectopic over-expression of miR-146a has no inducing effect on differentiation of the T-lymphoblast model, but it only up-regulates the expression of the molecules involved in T-cell activation.
Figure 3. Expression analysis of T-lymphocyte markers using real-time PCR.
Surface marker expression
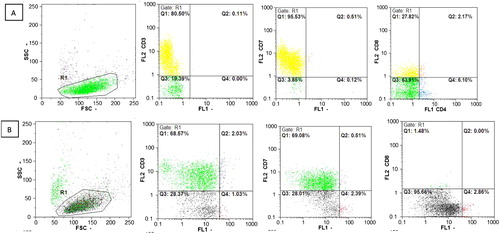
The expressions of CD3, CD7, and CD8 on the cell surface were detected by flow cytometric assay at day 28 after transduction (). The results showed that cells which expressed CD3 (70.60%), CD7 (69.59%), and CD8 (1.48%) at day 28 decreased in compared with the group of control cells that only transduced with the backbone of the vector CD3 (80.61%), CD7 (96.04%), and CD8 (29.99%).
Figure 4. Expression analysis of surface markers CD3, CD7, and CD8 using flow cytometry. (A) Distribution of cells by size and granularity. CD expression in the group transduced by the backbone of the vector. (B) Distribution of cells by size and Granularity. CD expression in the group transduced by the miR-146a.
Discussion
In this study we evaluated the differentiation effects of miR-146a on the Jurkat cell line (T lymphoblast). In addition, we assessed for vital TFs involved in T-cell differentiation and T-cell CD markers. This led to the identification of a gene profile controlled by miR-146a. We observed that miR-146a might induce and suppress the expression of several TFs. According to the results, miR-146a significantly induced up-regulation of GATA3 expression, which should be up-regulated during T-cell differentiation.Citation2 In contrast, we observed that ectopic expression of miR-146a significantly induced up-regulation of the expression of PU.1, TF which was expected to be down-regulated during T-cell differentiation.Citation2 In agreement with this finding, Ghani et al. have shown that miR-146a is not only up-regulated by PU.1, but is also a vital regulator in the initiation of fetal macrophage development. They have also shown that PU.1 induces myeloid differentiation from HSCs.Citation24 In contrast to previous reports which have stated that Foxp3 induction is efficiently suppressed by PU.1 and GATA3,Citation25 surprisingly we observed up-regulation of Foxp3 along with PU.1 and GATA3. Although PU.1 expression has an essential role in T-cell development, forced expression out of temporal context might lead to interference with differentiation as suggested by Anderson et al.Citation15
Runx1, Notch1, and Ets2 are TFs that have increased expression throughout the T-cell differentiation stages. In this study, we observed up-regulation in the expression of Runx1, down-regulation of Notch1, and no significant change in expression of Ets2. Recently, Runx1 has been identified as a tumor-suppressor gene in T-ALL,Citation26 thus this finding may assist with prediction of miR-146a as a tumor-suppressor molecule. Repressing Notch1 by miR-146a has been reported by Mei et al.Citation27 in glioblastoma. Activating mutations in the Notch1 pathway are frequent in T-ALL,Citation28 therefore miR-146a could be used as targeted therapy in this disease because of its ability to suppress Notch1 expression.
The expression levels of other TFs such as C/EBPα, Lmo2, and GATA2, should decrease during T-cell differentiation. However, in this study, there was up-regulation of C/EBPα, down-regulation of Lmo2, and no significant change in GATA2.
An inverse correlation was previously observed in the expression of C/EBPα with CD7.Citation29 Our results showed C/EBPα up-regulation along with decreased CD7 expression, which confirmed this report. In addition, there was an inverse correlation between the silencing of C/EBPα and aberrant activation of Notch1, according to the criteria of Wouters et al.Citation30
Aberrant increase in Lmo2 expression is found in 9% of T-ALL cases.Citation19 Our findings have shown a repressing effect of miR-146a on Lmo2, a predicted target gene. This miR, therefore, would be an appropriate candidate for effective target therapy in cases of Lmo2-induced T-ALL.
Previous reports shown high expression levels of Ikaros throughout the T-cell differentiation stages;Citation2 however, there was decrease expression in this study. In addition, we evaluated expression of the son of sevenless 1 (Sos1) gene involved in T-cell development and maturationCitation31 and noted reduced expression.
There were no significant changes in the expression levels of STAT6, GATA2, and CXCR4 TFs which indicated the lack of effect of miR-146a. Real-time quantitative PCR analyses revealed up-regulation level in CD2 and CD25 (both involved in T-cell activation) and down-regulation in CD4 and TCRα, with no significant change in CD3ɛ after ectopic expression of miR-146a. However, flow cytometry results showed that the expressions of CD3, CD7, and CD8 decreased in T cells transduced by miR-146a. We observed, for first time, significant reduction in CD8 expression a target for miR-146a. Thus, CD8 can be presumed to be a validated target for this miR.
Hori et al.Citation32 have shown high Foxp3 expression levels in CD25+, CD4+ T cells in mice compared to CD25− CD4+ T cells. We observed this expression with CD25+ CD4− cells. Since T-reg cells are Foxp3, CD4 and CD25 positive,Citation33 we can postulate that miR-146a has an effect during the development of T-reg in addition to an immunomodulatory role.
Conclusion
We observed reduced expressions of Notch1, ETS2, Lmo2, CXCR4, STAT3, CD8, and CD4 among the miR-146a target genes listed in . Interestingly, we observed up-regulation in PU.1, Foxp3, and c-fos, which are also target genes for miR-146a.
We also assessed expression of other TFs such as STAT3, GATA2, GATA3, Runx1, SOS1, CEBP/α, and Ikaros. Although these genes are not miR-146a target genes, they are involved in T-cell differentiation. Generally, decreased expression of key genes and CD markers which should be increased during T-cell development and differentiation such as Notch1, ETS2, Ikaros, SOS1, CD3, CD4, CD8, CD25, and TCRα, as well as increased expression of the TFs that should be decreased during T-cell differentiation such as PU.1 and CEBP/α is a reason for the absence of differentiation effect of this miR on T-cell lymphoblasts. Perhaps the expression of miR out of temporal context or in aberrant phase in cell development results in imbalance of cellular genes and lack of cell maturation.
Although this miR had no differentiation effect upon T-cell lymphoblasts, its up-regulation on Runx1 and down-regulation on Notch1 and Lmo2 could enable miR-146a to be a potential therapy in diseases caused by these three TFs.
Funding source
This work was supported by the Faculty of Medical Sciences of Tarbiat Modares University, Tehran, Iran, and partial support by the Stem Cell Technology Research Center, Tehran, Iran.
Authors’ contributions
Saki N, Abroun S, Soleimani M, and Mortazavi Y proposed the research and revised the manuscript. The manuscript was written by Saki N and Abroun S. Technical laboratory tests were performed by Saki N and the Stem Cell Technology Research Center Tehran staff, Fallah P, Arefian E and Bakhtiari HA.
Acknowledgment
The authors thank Drs Behzad Popak, Fakher Rahim, Mohammad Ali Jahangirpour, and Ehsan Janzamin for technical advice and insightful comments.
References
- Dias S, Xu W, McGregor S, Kee B. Transcriptional regulation of lymphocyte development. Curr Opin Genet Dev. 2008;18(5):441–8.
- Rothenberg EV, Zhang J, Li L. Multilayered specification of the T-cell lineage fate. Immunol Rev. 2010;238(1):150–68.
- Taylor A, Verhagen J, Akkoc T, Wenig R, Flory E, Blaser K, et al. IL-10 suppresses CD2-mediated T cell activation via SHP-1. Mol Immunol. [Research Support, Non-U.S. Gov't] 2009;46(4):622–9.
- Dave VP. Role of CD3 epsilon-mediated signaling in T-cell development and function. Crit Rev Immunol. [Research Support, Non-U.S. Gov't Review] 2011;31(1):73–84.
- Graux C, Cools J, Michaux L, Vandenberghe P, Hagemeijer A. Cytogenetics and molecular genetics of T-cell acute lymphoblastic leukemia: from thymocyte to lymphoblast. Leukemia: Official Journal of the Leukemia Society of America, Leukemia Research Fund, UK [Research Support, Non-U.S. Gov't Review] 2006;20(9):1496–510.
- Merkerova M, Belickova M, Bruchova H. Differential expression of microRNAs in hematopoietic cell lineages. Eur J Haematol. 2008;81(4):304–10.
- Starczynowski DT, Kuchenbauer F, Wegrzyn J, Rouhi A, Petriv O, Hansen CL, et al. MicroRNA-146a disrupts hematopoietic differentiation and survival. Exp Hematol. 2011;39(2):167–78 e4.
- Curtale G, Citarella F, Carissimi C, Goldoni M, Carucci N, Fulci V, et al. An emerging player in the adaptive immune response: microRNA-146a is a modulator of IL-2 expression and activation-induced cell death in T lymphocytes. Blood [Research Support, Non-U.S. Gov't] 2010;115(2):265–73.
- Landgraf P, Rusu M, Sheridan R, Sewer A, Iovino N, Aravin A, et al. A mammalian microRNA expression atlas based on small RNA library sequencing. Cell 2007;129(7):1401–14.
- Vergoulis T, Vlachos IS, Alexiou P, Georgakilas G, Maragkakis M, Reczko M, et al. TarBase 6.0: capturing the exponential growth of miRNA targets with experimental support. Nucleic Acids Res. 2012;40(Database issue):D222–9.
- Labbaye C, Testa U. The emerging role of MIR-146A in the control of hematopoiesis, immune function and cancer. J Hematol Oncol. 2012;5:13.
- Kozomara A, Griffiths-Jones S. miRBase: integrating microRNA annotation and deep-sequencing data. Nucleic Acids Res. 2011;39(Database issue):D152–7.
- Dweep H, Sticht C, Pandey P, Gretz N. miRWalk – database: prediction of possible miRNA binding sites by “walking” the genes of three genomes. J Biomed Inform. [Research Support, Non-U.S. Gov't] 2011;44(5):839–47.
- Stritesky GL, Muthukrishnan R, Sehra S, Goswami R, Pham D, Travers J, et al. The transcription factor STAT3 is required for T helper 2 cell development. Immunity [Research Support, N.I.H., Extramural] 2011;34(1):39–49.
- Anderson MK, Hernandez-Hoyos G, Dionne CJ, Arias AM, Chen D, Rothenberg EV. Definition of regulatory network elements for T cell development by perturbation analysis with PU.1 and GATA-3. Dev Biol. 2002;246(1):103–21.
- Jabeen R, Chang HC, Goswami R, Nutt SL, Kaplan MH. The transcription factor PU.1 regulates gammadelta T cell homeostasis. PLoS One [Research Support, N.I.H., Extramural] 2011;6(7):e22189.
- Xiao G, Deng A, Liu H, Ge G, Liu X. Activator protein 1 suppresses antitumor T-cell function via the induction of programmed death 1. Proc Natl Acad Sci USA. [Research Support, Non-U.S. Gov't] 2012;109(38):15419–24.
- Trampont PC, Tosello-Trampont AC, Shen Y, Duley AK, Sutherland AE, Bender TP, et al. CXCR4 acts as a costimulator during thymic beta-selection. Nat Immunol. [Research Support, N.I.H., Extramural Research Support, Non-U.S. Gov't] 2010;11(2):162–70.
- Curtis DJ, McCormack MP. The molecular basis of Lmo2-induced T-cell acute lymphoblastic leukemia. Clin Cancer Res. 2010;16(23):5618–23.
- Sugimoto K, Maekawa Y, Kitamura A, Nishida J, Koyanagi A, Yagita H, et al. Notch2 signaling is required for potent antitumor immunity in vivo. J Immunol. [Research Support, Non-U.S. Gov't] 2010;184(9):4673–8.
- Geiger TL, Tauro S. Nature and nurture in Foxp3(+) regulatory T cell development, stability, and function. Hum Immunol. [Research Support, N.I.H., Extramural Research Support, Non-U.S. Gov't Review] 2012;73(3):232–9.
- Yu Y, Wang J, Khaled W, Burke S, Li P, Chen X, et al. Bcl11a is essential for lymphoid development and negatively regulates p53. J Exp Med. [Research Support, Non-U.S. Gov't] 2012;209(13):2467–83.
- Bustin SA, Benes V, Garson JA, Hellemans J, Huggett J, Kubista M, et al. The MIQE guidelines: minimum information for publication of quantitative real-time PCR experiments. Clin Chem. [Guideline Research Support, Non-U.S. Gov't] 2009;55(4):611–22.
- Ghani S, Riemke P, Schonheit J, Lenze D, Stumm J, Hoogenkamp M, et al. Macrophage development from HSCs requires PU.1-coordinated microRNA expression. Blood 2011;118(8):2275–84.
- Hadjur S, Bruno L, Hertweck A, Cobb BS, Taylor B, Fisher AG, et al. IL4 blockade of inducible regulatory T cell differentiation: the role of Th2 cells, Gata3 and PU.1. Immunol Lett. 2009;122(1):37–43.
- Della Gatta G, Palomero T, Perez-Garcia A, Ambesi-Impiombato A, Bansal M, Carpenter ZW, et al. Reverse engineering of TLX oncogenic transcriptional networks identifies RUNX1 as tumor suppressor in T-ALL. Nat Med. 2012;18(3):436–40.
- Mei J, Bachoo R, Zhang CL. MicroRNA-146a inhibits glioma development by targeting Notch1. Mol Cell Biol. 2011;31(17):3584–92.
- Tzoneva G, Ferrando AA. Recent Advances on NOTCH Signaling in T-ALL. Curr Top Microbiol Immunol. 2012;360:163–82.
- Rohrs S, Scherr M, Romani J, Zaborski M, Drexler HG, Quentmeier H. CD7 in acute myeloid leukemia: correlation with loss of wild-type CEBPA, consequence of epigenetic regulation. J Hematol Oncol. 2010;3:15.
- Wouters BJ, Jorda MA, Keeshan K, Louwers I, Erpelinck-Verschueren CA, Tielemans D, et al. Distinct gene expression profiles of acute myeloid/T-lymphoid leukemia with silenced CEBPA and mutations in NOTCH1. Blood 2007;110(10):3706–14.
- Kortum RL, Rouquette-Jazdanian AK, Samelson LE. Ras and extracellular signal-regulated kinase signaling in thymocytes and T cells. Trends Immunol. 2013;34(6):259–268.
- Hori S, Nomura T, Sakaguchi S. Control of regulatory T cell development by the transcription factor Foxp3. Science 2003;299(5609):1057–61.
- Wachstein J, Tischer S, Figueiredo C, Limbourg A, Falk C, Immenschuh S, et al. HSP70 enhances immunosuppressive function of CD4(+)CD25(+)FoxP3(+) T regulatory cells and cytotoxicity in CD4(+)CD25(-) T cells. PLoS One 2012;7(12):e51747.