
Abstract
Objective
Quantitative assessment of BAX transcripts and protein in acute myeloid leukemia (AML).
Methods
We quantitatively evaluated BAX gene transcripts by real-time polymerase chain reaction (TaqMan probe chemistry) and protein expression by flow cytometry.
Results
Consecutive 112 AML patients with a median age of 16 (1–59) years were recruited in the study. By flow cytometry, the percentage expression was in linear correlation with relative median fluorescent intensity (RMFI; R = 0.4425; P < 0.001). However, there was no linear relationship between the transcript copies of the BAX with its RMFI (R = −0.0559; P = 0.586). The expression of the BAX at both protein and transcript level was significantly higher in AML patients as compared with normal control. RMFI of the BAX were higher in the cohort with lower white blood cell count (P = 0.029). None of the other baseline characteristics correlated with either the BAX transcript or the RMFI. BAX expression did not correlate with complete remission rate, event free, disease free, and overall survival.
Conclusion
BAX gene expression in AML was evaluated first time with two different methods but did not correlate with the survival outcome
Introduction
Apoptosis is a multi-step, inherent pathway of cell death which is programmed in all of the cell lineages. The receptor-mediated apoptotic pathway is driven by a class of Bcl2-associated protein X (BAX) and other proteins of the same family (Bak, Bad, Bid, Bim, Bmf, NOXA, and PUMA) which forms homo or heterodimers with other proteins of the anti-apoptotic class (Bcl-2, Bcl-XL, and Mcl-1). The BAX family of death agonists acts at the mitochondria to induce apoptosis. The expression of BAX is regulated by the tumor suppressor protein p53, and it is involved in p53-mediated apoptosis.Citation1
Acute myeloid leukemia (AML) is an aggressive clonal hematologic malignancy which is characterized by the predominance of differentially matured myeloblasts. The primary induction treatment regimen of AML treatment is chemotherapy which kills the myeloblasts by inducing either receptor-mediated or mitochondrial-mediated pathway of apoptosis. Hence, in AML, apoptosis holds the key for early response to treatment and acquired resistance to chemotherapy results in reduced rates of remission, higher rates of relapse, and finally contributes to poor outcome.
Biologically, the role of BAX as a proapoptotic protein is evident but clinically there is heterogeneity with respect to the prognostic significance of BAX expression in various malignancies. This might be due to differences in the methods of assessment of BAX which vary in specificity and sensitivity. There is lack of data with regard to the relationship of BAX at transcript and protein level, and its effect on the outcome in AML has been variable with some studies reporting a poor outcome with increased BAX expression and another reporting the inverse. In view of these lacunae, we prospectively assessed BAX gene transcripts and its flow-cytometric expression, and also evaluated their inter-relationship. The secondary objective of the study was to evaluate if Bax expression had any impact on the outcome in AML.
Materials and methods
Patient selection, treatment, and sampling
Newly diagnosed consecutive de novo AML patients' ≤60 years were enrolled from March 2008 till June 2010 prospectively. Acute promyelocytic leukemia (APML) was excluded. The study was approved by the institute ethics committee and informed consent was taken (prior to therapy) for evaluation of the peripheral blood and/or bone marrow for this study. The patients were classified into good, intermediate, and poor risk cytogenetic groups as per the standard criteria.Citation2
All of the patients were treated with uniform induction protocol (daunorubicin at 60 mg/m2 over 2 hours for 3 days with cytarabine 100 mg/m2/day over 24 hours infusion for 7 days); patients who were not in complete remission (CR) post first induction received ADE protocol (cytarabine 100 mg/m2 slow intravenous push twice a day for 10 days,Citation3 daunorubicin 50 mg/m2 daily for 3 days and Etoposide 100 mg/m2 daily for 5 days). Patients who were not in CR after two inductions were declared refractory. After achieving remission, the patients received three cycles of high-dose cytarabine at 18 gm/m2/cycle.
Five milliliters peripheral blood (N = 78 patients) (if peripheral blast count was more than 30%) or otherwise 5 ml bone marrow (N = 34 patients) was collected by using ethylenediaminetetraacetic acid (EDTA) as anticoagulant in EDTA coated sterile vacutainer (BD). For the controls, mononuclear cells (MNCs) from bone marrow aspirates of 10 different patients were taken who had a solid tumor and underwent a bone marrow examination as part of a metastatic workup (notably all of the control samples were free of tumor cells in the bone marrow). All of the samples were processed within 6 hours of collection.
Absolute quantification by Taqman probe-based real-time polymerase chain reaction
Total RNA was isolated from 10 million MNCs by using TRIzol® method. RNA was evaluated for quality and quantity by spectrophotometry. cDNA was synthesized from 1 µg aliquots of total RNA in a 20 µl standard reaction mixture by using reverse transcription (RT) kit (Roche, Mannheim, Germany) according to the manufacturer's instructions. cDNAs were processed further for absolute quantification of the transcripts.
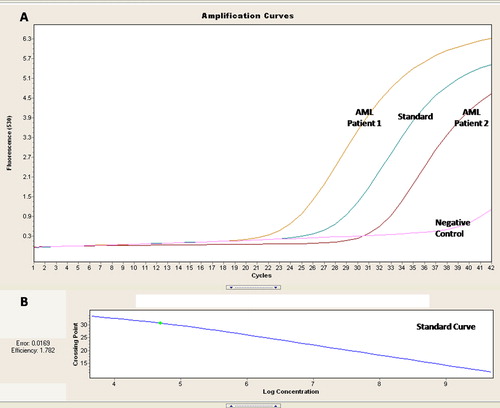
Absolute quantification of the BAX transcripts was done by RT polymerase chain reaction (PCR) using TaqMan probes chemistry. Probe for BAX was conjugated with 6-carboxyfluorescein (FAM) as reporter dye and BlackBerry Quencher (BBQ) at 5′ and 3′, respectively (Forward Primer (18) 5′CCGCCGTGGACACAGACT3′, Probe (25) 5′TGCCACTCGGAAAAAGACCTCTCGG 3′ Reverse Primer (21) 5′TTGCCGTCAGAAAACATGTCA 3′ product size 69) (Roche). The standard was prepared by using cloned quantified plasmids of BAX amplicon. Four different concentrations (102 to 108 copies/μl) of plasmid prepared by serial dilution were used in duplication for the standard curve. For absolute quantification experiment of the AML patients, 5 × 10⁴ plasmids were quantified and considered as reference transcript for quality check. Quantitative RT-PCR analysis was performed in a Light Cycler 2.0 (Roche). Beta actin transcripts were used as housekeeping gene. Standards with known copies of plasmids were used in all of the experiments for normalization and quantification. The standard curve was prepared and saved; the same was imported for analysis ().
Figure 1. RQ PCR for assessment of the BAX transcripts in AML patients. (A) Amplification curves for 2 AML patients with the standard of known concentration and negative control. (B) Standard curve for the quantification of the BAX transcript.
Flow cytometry
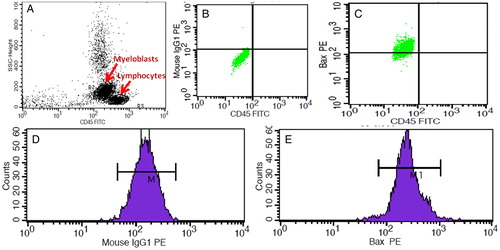
MNCs were separated from the peripheral blood or the bone marrow by using density gradient media (Ficoll hypaque; Sigma 1077, Sigma–Aldrich, Inc. USA). Isolated MNCs were washed twice and finally resuspended in phosphate buffered saline (PBS). Myeloblasts were characterized and gated by side scatter and CD45 antibody conjugated with fluorochromes fluorescein isothiocyanate. Expression of BAX was evaluated on a dim CD45-gated population. Total one million MNCs (volume: 100 µl) were initially stained for surface antigen by using CD45 antibody (Becton Dickinson, San Jose, CA, USA) by incubating for 20 minutes followed by washing twice in PBS. For the cytoplasmic antigen, the cells were permeabilized and fixed by using Cytofix/Cytoperm Kit (Becton Dickinson) as per the manufacturer's instructions. Enriched, fixed, and CD45 conjugated myeloblasts were subjected to BAX staining with phycoerythrin conjugated antibody (Becton Dickinson) and isotype control in separate tubes. Total 50 000 events were acquired for each tube in all of the experiments. Multi parameter flow cytometry analysis was performed by using a FACS Calibur flow-cytometer and cell quest pro software (Becton Dickinson). We assessed and calculated the percentage expression of BAX and relative fluorescence intensity by using respective isotype control as suggested in the previous study of the apoptotic markersCitation4 ().
Figure 2. Flow cytometry-based assessment of the BAX protein in AML patients. (A) Gating of the myeloblasts on the basis of the CD 45 expression. (B) BAX isotype control on the gated myeloblasts used to demarcate the negative selection. (C) BAX expression on the gated myeloblasts. (D) MFI of the BAX isotype control. (E) MFI of the BAX on the gated myeloblasts.
Statistical analysis
Data were expressed as median (range) and mean ± SD; the differences between the values were determined by using Kruskal–Wallis test and independent Student's t–test, respectively. Median values of the quantitative variables were used as a cutoff point for categorization into high or low expression. The mean values of the quantitative variables were compared with the baseline patient characteristics. Log mean of the transcripts (copy number) was compared with the baseline patient characteristics as the range was wide. The linear relationship between the transcripts number and the expression by flow cytometry were assessed by Pearson correlation coefficient. Outcome analysis was assessed based on CR rate, event-free survival (EFS), and overall survival (OS). EFS was defined as the time between diagnosis and first event such as failure to achieve CR, relapse, or death. OS was defined as the time between diagnosis and death or last follow-up. The endpoint of the study was 31 December 2012. Kaplan–Meier curves were obtained for the survival analysis followed by the log rank test to compare the statistical significance between the groups. P value of ≤0.05 was considered significant. All of the statistical analysis was done by using Stata 11.5.
Results
Baseline patient characteristics and outcome
Total 168 patients were registered in our center during the study period. After exclusion (biphenotypic leukemia (n = 4), age >60 years (n = 11), APML (n = 14), unwilling for therapy (n = 10), and logistical issues (n = 17)), finally 112 patients were recruited. Median age of all of the patients enrolled in this study was 16 (1–59) years. Of all the enrolled patients, 64 of 112 (57.1%) were of pediatric age group (≤18 years) while 48 of 112 (42.8%) were >18 years of age. The baseline patient characteristics are shown in . Out of the 112 patients, 85 (76%) patients achieved CR at the end of either one or two induction chemotherapy cycles (53 (83%) for pediatric and 32 (67%) for adults, P = 0.026). At median follow-up time of 15.5 months (range: 0.5–57.3), EFS was 28.0 ± 4.22% (20.1–36.5), and OS 36.4 ± 4.9% (27.1–45.7). High white blood cell (WBC) (more than the median) count was associated with poor CR rate (84% vs. 65%, P = 0.018), EFS (33% vs. 23% P = 0.051) but not with OS (41% vs. 24% P = 0.080). Other clinical factors like hemoglobin, platelets, cytogenetics, and Flt3 ITD did not predict either EFS or OS in this cohort.
Table 1. Patients characteristics
Expression of the BAX by real-time PCR and flow cytometry
There was a trend toward higher expression of BAX in adults as compared with the pediatric patients at both transcript and protein level, but this difference was not statistically significant ().
Table 2. Expression of the BAX cytoplasmic protein (percentage and relative median fluorescence intensity RMFI by flow cytometry) and transcript (Q PCR)
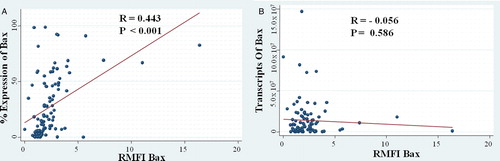
By flow cytometry, the percentage expression was in linear correlation with the relative median fluorescent intensity (RMFI; R = 0.4425; P < 0.001) (A). However, there was no linear relationship between the transcript copies of BAX with its RMFI (R = −0.0559; P = 0.586) (B).
Figure 3. (A) Correlation of the BAX percentage expression with the RMFI. (B) Correlation of the BAX transcripts expression with the protein expression.
BAX expression: patients vs. controls
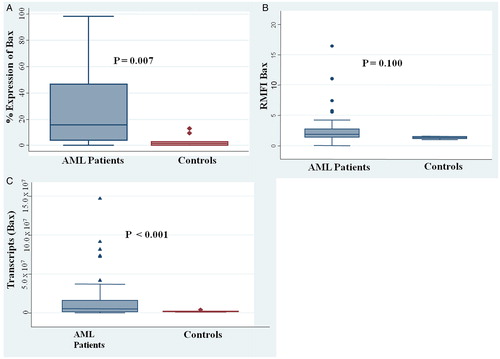
The expression of BAX at both protein and transcript level was significantly higher in AML patients as compared with normal control. At the protein level, the mean percentage expression of BAX was 3.2 ± 1.34 in controls vs. 26.9 ± 2.74 in AML patients (P = 0.007) (A). The median RFMI for the patients was 2.3 ± 0.20 vs. 1.2 ± 0.06 in the controls (P = 0.100) (B). At the transcript level, the transcripts of BAX were higher in AML patients (12.7 × 10⁶) in comparison to the controls (1.88 × 10⁶) (P < 0.001) (C).
Figure 4. Box plots (A) Comparison of the percentage BAX expression of the AML patients with control. (B) Comparison of the RMFI of the BAX of the AML patients with control. (C) Comparison of the BAX transcripts of the AML patients with control.
Relationship of the BAX transcripts with the baseline patient characteristics and the clinical outcome
The transcripts and the RMFI of the BAX were higher in the cohort with lower WBC count but the difference was significant only for the RMFI (P = 0.029) (). None of the other baseline characteristics correlated with either the BAX transcript or the RMFI (). BAX expression did not correlate with CR rate, EFS, DFS, and OS ().
Table 3. Correlation of the BAX transcript expression with the baseline patient characteristics
Table 4. BAX expression (transcript level, more than or less than the median) with the remission and the outcome
Discussion
This is the first study in consecutive AML patients where BAX was quantified for m-RNA and protein expression by high end sensitive and specific tools. In our cohort, the percentage expression of BAX by flow cytometry correlated with its RMFI expression. However, our data of the BAX copy number (transcripts) did not directly correlate with its RMFI expression. None of the previous studies have evaluated BAX at both transcript and protein level in the same cohort of AML or any other cancer (). However, this discordance between the transcript and the RMFI is similar to the findings of Bcl2 where the transcript and the protein expression was discordant in lymphoid tissuesCitation21,Citation22 and lymphomaCitation23 suggesting that the translation and the posttranslational control of protein synthesis is critical for BCL-2 and other structurally similar proteins involved in the execution of apoptosis in the cell.
Table 5. Studies of the BAX expression and their impact on the clinical outcome
Notably, our patient cohort was also different from the Western cohort as presentation of AML is early in India (median age ≤30 years).Citation24 A possible explanation could be that one-third of the Indian population is below 15 years as compared with 20% in the west; furthermore, the incidence of AML increases exponentially with age more than 65 years and only 5% of the population in India is above 65 years as compared with the west where 13% population is above 65 years.
Relative transcripts of the BAX with respect to glyceraldehyde 3-phosphate dehydrogenase (GAPDH) (which has been reported to be constant in various tumors and cell lines) were evaluated in AML-enriched myeloblasts by Köhler et al.'sCitation18 study, who observed that the BAX expression was 2.5 times and 1.9 times that of the GAPDH at baseline presentation and post induction respectively. In this study, we observed that the absolute copy number of the BAX transcript and the corresponding protein expression in the enriched myeloblasts (Ficol layering) was significantly higher than the control samples. This reiterates the fact that the myeloblasts have a higher expression of BAX as compared with normal cells (expressing dim CD 45 in the control samples).
Patients with low WBC had a higher CR rate and this translated into good survival outcomes as well. BAX transcript expression was higher in those with low WBC count but its RMFI did not correlate with the WBC count. None of the previous studies have reported such an association of the BAX with the baseline hematological parameters.
The notion that the BAX is proapoptotioc and thus there would be a good clinical outcome with high BAX transcript and protein expression have been supported and favored hypothetically and experimentally,Citation14 but the data of the previous studies in AML and various other malignancies appear to give conflicting resultsCitation5–Citation20 (). Köhler et al. reported that high BAX transcripts are predictive of poor outcome whereas Ong et al. reported that high BAX protein expression predicts good outcome in AML.Citation17,Citation18 Our results suggest that neither the transcript nor the protein of BAX had any impact on AML outcome. Evaluating the impact of the BAX expression on the outcome was our secondary objective; nevertheless, the limitation of our study is the small number of patients and thus we performed a post hoc power analysis on non-significant (P > 0.05) EFS and OS results. The power for the BAX transcript to detect difference in EFS and OS was nearly 10% and suggests that the number of patients was probably inadequate. To achieve an acceptable power of 80%, one would have had to recruit at least 2000 patients to show that there is a significant difference for the survival outcome based on the BAX transcript and/or the protein expression.
One of the limitations of our study was that instead of the bone marrow samples, we analyzed the peripheral blood samples in patients with peripheral blast count more than 30%. Notably, there was no difference in the BAX mean transcript and the RMFI expression in patients where the sample was obtained from the peripheral blood versus those obtained from the bone marrow (transcript: 8.8 × 10⁶ vs. 14.5 × 10⁶, P = 0.189; RMFI: 2.26 vs. 2.39, P = 0.763). Another limitation was that we did not enrich the blasts. However, there was no significant linear relationship between the transcripts and the RMFI value versus the blast percentage of the analyzed sample (transcript: R = −0.0066, P = 0.944; RMFI: R = −0.0586, P = 0.5625). This suggests that even though the blasts were not enriched yet the values of the transcripts obtained did not vary with the blast percentage.
To conclude, this is the first study where the BAX has been evaluated in consecutive AML patients at both the transcript and the protein level. Our data suggest that the BAX transcript does not correlate with its RMFI, and that neither the BAX transcript nor the protein expression at baseline predicts the outcome in AML patients.
Source of funding
This study was funded by the Institute Research Grant from the All India Institute of Medical Sciences, New Delhi, India.
Acknowledgement
Surender Kumar Sharawat is thankful to the Indian Council of Medical Research (ICMR) New Delhi, India for a Senior Research Fellowship.
References
- Miyashita T, Reed JC. Bcl-2 oncoprotein blocks chemotherapy-induced apoptosis in a human leukemia cell line. Blood 1993;81:151–7.
- Grimwade D, Walker H, Oliver F, Wheatley K, Harrison C, Harrison G, et al. The importance of diagnostic cytogenetics on outcome in AML: analysis of 1,612 patients entered into the MRC AML 10 trial. The Medical Research Council Adult and Children's Leukaemia Working Parties. Blood 1998;92:2322–33.
- Liu Yin JA, Wheatley K, Rees JK, Burnett AK. Comparison of ‘sequential’ versus ‘standard’ chemotherapy as re-induction treatment, with or without cyclosporine, in refractory/relapsed acute myeloid leukaemia (AML): results of the UK Medical Research Council AML-R trial. Brit J Haematol. 2001;113:713–26.
- Del Poeta G, Venditti A, Del Principe MI, Maurillo L, Buccisano F, Tamburini A, et al. Amount of spontaneous apoptosis detected by Bax/Bcl-2 ratio predicts outcome in acute myeloid leukemia (AML). Blood 2003;101:2125–31.
- Marx D, Binder C, Meden H, Lenthe T, Ziemek T, Hiddemann T, et al. Differential expression of apoptosis associated genes bax and bcl-2 in ovarian cancer. Anticancer Res. 1997;17:2233–40.
- Friess H, Lu Z, Graber HU, Zimmermann A, Adler G, Korc M, et al. Bax, but not Bcl-2, influences the prognosis of human pancreatic cancer. Gut 1998;43:414–21.
- Tai YT, Lee S, Niloff E, Weisman C, Strobel T, Cannistra SA. BAX protein expression and clinical outcome in epithelial ovarian cancer. J Clin Oncol. 1998;16:2583–90.
- Bairey O, Zimra Y, Shaklai M, Okon E, Rabizadeh E. Bcl-2, Bcl-X, Bax, and Bak expression in short- and long-lived patients with diffuse large B-cell lymphomas. Clin Cancer Res. 1999;5:2860–6.
- Giatromanolaki A, Sivridis E, Stathopoulos GP, Fountzilas G, Kalofonos HP, Tsamandas A, et al. Bax protein expression in colorectal cancer: association with p53, bcl-2 and patterns of relapse. Anticancer Res. 2001;21:253–9.
- Kymionis GD, Dimitrakakis CE, Konstadoulakis MM, Arzimanoglou I, Leandros E, Chalkiadakis G, et al. Can expression of apoptosis genes, bcl-2 and bax, predict survival and responsiveness to chemotherapy in node-negative breast cancer patients? J Surg Res. 2001;99:161–8.
- Gessner C, Liebers U, Kuhn H, Stiehl P, Witt C, Schauer J, et al. BAX and p16INK4A are independent positive prognostic markers for advanced tumour stage of nonsmall cell lung cancer. Eur Respir J. 2002;19:134–40.
- Katkoori VR, Suarez-Cuervo C, Shanmugam C, Jhala NC, Callens T, Messiaen L, et al. Bax expression is a candidate prognostic and predictive marker of colorectal cancer. J Gastrointest Oncol. 2010;1:76–89.
- Hogarth LA, Hall AG. Increased BAX expression is associated with an increased risk of relapse in childhood acute lymphocytic leukemia. Blood 1999;93:2671–8.
- Nuessler V, Stötzer O, Gullis E, Pelka-Fleischer R, Pogrebniak A, Gieseler F, et al. Bcl-2, bax and bcl-xL expression in human sensitive and resistant leukemia cell lines. Leukemia 1999;13:1864–72.
- Wuchter C, Karawajew L, Ruppert V, Buchner T, Schoch C, Haferlach T, et al. Clinical significance of CD95, Bcl-2 and Bax expression and CD95 function in adult de novo acute myeloid leukemia in context of P-glycoprotein function, maturation stage, and cytogenetics. Leukemia 1999;13:1943–53.
- Kornblau SM, Vu HT, Ruvolo P, Estrov Z, O'Brien S, Cortes J, et al. BAX and PKCα modulate the prognostic impact of BCL2 expression in acute myelogenous leukemia. Clin Cancer Res. 2000;6:1401–9.
- Ong YL, McMullin MF, Bailie KE, Lappin TR, Jones FG, Irvine AE. High bax expression is a good prognostic indicator in acute myeloid leukaemia. Brit J Haematol. 2000;111:182–9.
- Köhler T, Schill C, Deininger MW, Krahl R, Borchert S, Hasenclever D, et al. High Bad and Bax mRNA expression correlate with negative outcome in acute myeloid leukemia (AML). Leukemia 2002;16:22–9.
- Narayan S, Chandra J, Sharma M, Naithani R, Sharma S. Expression of apoptosis regulators Bcl-2 and Bax in childhood acute lymphoblastic leukemia. Hematology 2007;12:39–43.
- Hess CJ, Berkhof J, Denkers F, Ossenkoppele GJ, Schouten JP, Oudejans JJ, et al. Activated intrinsic apoptosis pathway is a key related prognostic parameter in acute myeloid leukemia. J Clin Oncol. 2007;25:1209–15.
- Chleq-Deschamps CM, LeBrun DP, Huie P, Besnier DP, Warnke RA, Sibley RK, et al. Topographical dissociation of BCL-2 messenger RNA and protein expression in human lymphoid tissues. Blood 1993;81:293–8.
- Kondo E, Nakamura S, Onoue H, Matsuo Y, Yoshino T, Aoki H, et al. Detection of bcl-2 protein and bcl-2 messenger RNA in normal and neoplastic lymphoid tissues by immunohistochemistry and in situ hybridization. Blood 1992;80:2044–51.
- Akagi T, Kondo E, Yoshino T. Expression of Bcl-2 protein and Bcl-2 mRNA in normal and neoplastic lymphoid tissues. Leuk Lymphoma 1994;13:81–7.
- Ghosh S, Shinde SC, Kumaran GS, Sapre RS, Dhond SR, Badrinath Y, et al. Haematologic and immunophenotypic profile of acute myeloid leukemia: an experience of Tata Memorial Hospital. Indian J Cancer 2003;40:71–6.