Abstract
Background
The purpose was to investigate the effects of one dose of NaHCO3 per day for five consecutive days on cycling time-to-exhaustion (T lim) at ‘Critical Power’ (CP) and acid–base parameters in endurance athletes.
Methods
Eight trained male cyclists and triathletes completed two exercise periods in a randomized, placebo-controlled, double-blind interventional crossover investigation. Before each period, CP was determined. Afterwards, participants completed five constant-load cycling trials at CP until volitional exhaustion on five consecutive days, either after a dose of NaHCO3 (0.3 g·kg-1 body mass) or placebo (0.045 g·kg-1 body mass NaCl).
Results
Average T lim increased by 23.5% with NaHCO3 supplementation as compared to placebo (826.5 ± 180.1 vs. 669.0 ± 167.2 s; P = 0.001). However, there was no time effect for T lim (P = 0.375). [HCO3 -] showed a main effect for condition (NaHCO3: 32.5 ± 2.2 mmol·l-1; placebo: 26.2 ± 1.4 mmol·l-1; P < 0.001) but not for time (P = 0.835). NaHCO3 supplementation resulted in an expansion of plasma volume relative to placebo (P = 0.003).
Conclusions
The increase in T lim was accompanied by an increase in [HCO3 -], suggesting that acidosis might be a limiting factor for exercise at CP. Prolonged NaHCO3 supplementation did not lead to a further increase in [HCO3 -] due to the concurrent elevation in plasma volume. This may explain why T lim remained unaltered despite the prolonged NaHCO3 supplementation period. Ingestion of one single NaHCO3 dose per day before the competition during multiday competitions or tournaments might be a valuable strategy for performance enhancement.
Trial registration
Trial registration: ClinicalTrials.gov IdentifierNCT01621074
Electronic supplementary material
The online version of this article (doi:10.1186/1550-2783-10-16) contains supplementary material, which is available to authorized users.
Copyright comment
This article is published under license to BioMed Central Ltd. This is an Open Access article distributed under the terms of the Creative Commons Attribution License (http://creativecommons.org/licenses/by/2.0), which permits unrestricted use, distribution, and reproduction in any medium, provided the original work is properly cited.
Background
Competitive sports performance is strongly dependent on optimal muscle function. During cycling exercise across the heavy and severe intensity domains [Citation1], energy is provided more and more by anaerobic glycolysis. This leads to an increased rate of accumulation of metabolites, which have been linked with muscle fatigue (e.g. Pi, ADP, H+, and extracellular K+). Cycling exercise at the threshold between the heavy and severe domain, i.e. at ‘Critical Power’ (CP), can, in contrast to the theoretical concept [Citation2], only be sustained for as long as 20 to 40 min [Citation3] before task failure. Furthermore, it was shown that CP overestimates the highest possible metabolic steady state [Citation4, Citation5] and, consequently, that exercise at or above CP is associated with a decline in muscle and blood pH [Citation6, Citation7]. An activity-induced decrease in intracellular pH has been suggested to limit exercise because it inhibits glycogenolysis and glycolysis [Citation8], increases muscular K+-release [Citation9] and inhibits sarcoplasmatic Ca2+-release [Citation10, Citation11]. Furthermore, it induces a metabolic acidosis that might impair muscle function [Citation12] and compromise performance. To blunt the fall in intracellular pH and prolong time-to-exhaustion (T lim), nutritional modulation might be a promising avenue. With respect to endurance exercise, to date especially sodium bicarbonate (NaHCO3) has gained much attention. However, the mechanisms by which NaHCO3 ingestion may enhance performance are not fully understood. It is believed that NaHCO3 ingestion leads to an increase in blood bicarbonate concentration ([HCO3 -]), which in turn increases extracellular buffer capacity. More precisely, it is proposed that the higher [HCO3 -] gradient between blood and the intramyocellular compartment enhances H+-efflux out of the muscle cell, thereby delaying the fall in intracellular pH [Citation13], which in turn may delay an impairment in optimal muscle function and performance [Citation14, Citation15]. Therefore, NaHCO3 supplementation would be expected to improve T lim at CP if muscle pH is a limiting factor for exercise tolerance.
Basically, three types of NaHCO3 supplementation protocols can be applied: acute (single dose), chronic (multiple dose) and multiday acute supplementation (one dose per day before competition for consecutive days of competition). During the acute delivery mode participants take one single dose (mostly 0.3 g∙ kg-1 body mass NaHCO3) 60 to 90 min before the start of competition. During the chronic delivery mode participants take a daily amount of NaHCO3 (mostly 0.5 g∙ kg-1 body mass), divided in 2 to 3 portions, for several days before competition takes place. On the day of competition, no NaHCO3 is consumed [Citation16, Citation17]. The multiday acute delivery mode comprises the ingestion of acute doses on consecutive days of competition. In contrast to the chronic loading protocol, acid–base balance is perturbed on every day during the multiday acute delivery mode. This fact leads to major differences regarding the acid–base status and accordingly the underlying mechanisms as well as the effectiveness of the different delivery modes. While the acute and chronic supplementation protocols are scientifically well described, data on the effects of multiday acute supplementation are lacking. There are several studies, which investigated NaHCO3 ingestion during tournament-like sports, but only for single events. For example, it was shown that NaHCO3 supplementation increases tennis performance [Citation18] but does not affect prolonged intermittent cycling exercise performance [Citation19]. However, up to date, no study investigated the effect of a consecutive multiday supplementation on consecutive multiday performance. Since consecutive, acute-load daily use of NaHCO3 might represent an interesting option to increase performance during multiday competitions or tournaments that involve exercise in the heavy and severe intensity domains, further research is warranted. In particular, scientific knowledge is limited with respect to the recovery of the body’s acid–base balance after high-intensity exercise with NaHCO3 supplementation and consequently, the initial positions on the following days remain elusive.
Thus, the purpose of this randomized, placebo-controlled, double-blind interventional crossover study was to investigate if multiday acute NaHCO3 supplementation in well-trained endurance athletes leads to changes in T lim at CP during constant-load cycle ergometer trials on a day-to-day basis with daily acute NaHCO3 vs. placebo supplementation for 5 days. Furthermore, we aimed to investigate if differences in T lim can be explained by alterations in [HCO3 -] and if the high amount of ingested Na+ influences plasma volume (PV) and thus [HCO3 -]. Given that exercise at or above CP leads to muscle and blood acidification [Citation6, Citation7], and that [HCO3 -] increases extracellular buffer capacity [Citation13], we hypothesized that consecutive, acute-load daily supplementation of NaHCO3 increases T lim relative to placebo. We assumed that an increase in [HCO3 -] after the first intake is responsible for the rise in T lim. Since during multiday NaHCO3 intake, a high amount of Na+ is ingested and absorbed, detrimental effects on endurance performance are possible. In fact, a higher [Na+] leads to water retention and thereby results in PV expansion [Citation20]. An increase in PV decreases blood ion concentrations, and as such results in a diminished [HCO3 -], which in turn could counteract the benefits associated with NaHCO3 intake. It is therefore questionable, whether [HCO3 -] can be increased beyond the concentration reached after the first day of supplementation on all subsequent days of supplementation. Consequently, we hypothesized that PV expands following a high Na+ intake, limiting any further increase in [HCO3 -], and consequently T lim, beyond that observed after the first day of supplementation.
Methods
Participants
Eleven well-trained male cyclists and triathletes volunteered to participate in this study. The participants were recruited from different cycling or triathlon clubs. Two of them were excluded from the analysis because they contravened our instructions. One participant did not refrain from high-intensity exercise and the other markedly increased the training volume during or before the second testing sessions (see below). Another participant had to abort the measurements because of illness. The physical characteristics of the remaining eight participants were (mean ± SD) age 31.4 ± 8.8 years, height 184.6 ± 6.5 cm, body mass 74.1 ± 7.4 kg, peak power output (P peak) during ramp test 402.0 ± 29.1 W, peak oxygen uptake (V̇ O2peak) 61.0 ± 4.3 ml∙ kg-1∙ min-1. These athletes were all involved in their early preparation phase of training (pre-season). During this phase, the training consisted of constant-load rides at low-intensity. The participants were instructed to maintain their individual, low-intensity training programs. Additionally, they were advised to refrain from any high-intensity exercise during the testing sessions and to continue their nutritional habits. The determination of CP after the wash-out phase served to ascertain that no training effect occurred during the first phase of the study. None of the participants included was currently using buffer substances or any other ergogenic agents that may have compromised the administration of NaHCO3. Participants were fully informed about the purposes, benefits and risks associated with this study and completed a routine health questionnaire before giving written informed consent. This study was approved by the Swiss Federal Institute of Technology Zurich (ETH) ethics committee and was conducted in accordance with the Declaration of Helsinki.
Experimental overview
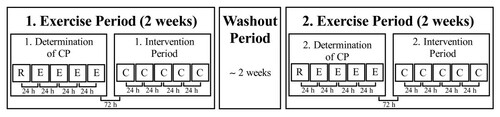
Using a randomized, placebo-controlled, double-blind interventional crossover design, all participants completed two exercise periods, each consisting of ten testing sessions (Figure ). These periods were separated by at least one week and on average 2.3 ± 2.1 weeks of washout, during which the participants maintained their low-intensity training programs. During both periods, the first five tests were conducted to determine CP and consisted of one incremental test and four constant-load tests to volitional exhaustion. The determination of CP was followed by a five-day intervention period, which was conducted either with NaHCO3 or sodium chloride (NaCl) supplementation. On each day during the intervention period, a constant-load trial at CP was performed. All tests were carried out under temperature-controlled laboratory conditions (19–24°C) and at the same time of day. The participants had a 23 h 34 min ± 53 min and 23 h 22 min ± 45 min rest period between the single tests during the placebo and NaHCO3 trials, respectively. All test devices were calibrated before, and whenever indicated after each test under the terms of the manufacturer’s recommendations. An independent researcher randomly assigned the two conditions to the participants and administered the non-distinguishable placebo or NaHCO3 tablets without revealing the ingredient. The investigator performing the tests was also blinded to the treatment. No feedback on test performance was given to the participants until all trials had been finished.
Figure 1 Study design. C, constant-load trials at ‘Critical Power’ (CP); E, constant load tests; R, incremental ramp test.
Supplementation
NaHCO3 was administered orally as tablets (Bullrich Salz Magentabletten, delta pronatura Dr. Krauss & Dr. Beckmann, Egelsbach, Germany). The NaHCO3 and placebo tablets (NaCl, delta pronatura Dr. Krauss & Dr. Beckmann, Egelsbach, Germany) were matched by shape and taste. During the two conditions either 0.3 g·kg-1 body mass of NaHCO3 or 0.045 g∙ kg -1 body mass of NaCl [Citation21, Citation22] had to be ingested 90 min before [Citation17] each of the five consecutive constant-load trials. Each supplement was consumed during a 15-min period with 0.75 dm3 still water to minimize gastrointestinal discomfort or any other adverse effects [Citation8, Citation23]. One NaHCO3 tablet contained 850 mg of NaHCO3, whereas one placebo tablet contained 130 mg of NaCl, which assured the intake of equal number of pills during the varying conditions (i.e. 0.35 tablets∙ kg-1 body mass). If a participant’s body mass was such that they required to consume a non-round number of tablets, the participants were instructed to consume the number of pills rounded to the nearest whole pill required to obtain the dose. To minimize falsification of the pill count, participants were given an unknown (to them) number of pills in excess of needs and were asked to return any remaining pills at the end of the study.
Determination of ‘critical power’
Five cycle ergometer tests were performed to determine CP [Citation24]. On the first visit, the seat and handle bar of the cycle ergometer (Ergoselect 200 K, Ergoline, Bitz, Germany) were adjusted. These settings were adopted for all consecutive trials. Participants started with a ramp cycle ergometer test to determine P peak and V̇ O2peak. After a 3-min rest, the ramp test started at 100 W and involved power increases of 9 W every 18 s (30 W∙ min-1) until volitional exhaustion. For all tests, participants were asked to maintain a cadence of 80 revolutions per min throughout the test. Volitional exhaustion, i.e. task failure, for all cycling tests was defined as the point in time when participants stopped pedaling or the cadence fell below 75 revolutions per minute for > 5 s. On each of the following testing days, one constant-load trial at different power output was completed to determine CP. After a 3-min rest, participants started with a 5-min warm-up at 75 W [Citation25]. The power was then increased immediately to 85%, 90%, 95% or 105% of P peak in a randomized order (modified from Brickley et al.[Citation25] including the 85% stage). These endurance capacity tests were conducted until task failure. Using the T lim from these tests, CP was then calculated from the linear power-time-1 equation [Citation24].
Constant-load cycling trials at ‘critical power’
During each of the two intervention periods, five constant-load trials at CP were completed on five consecutive days. These trials started with a 3-min rest and were followed by a 5-min warm-up at 75 W. Subsequently, power was immediately increased to the previously calculated CP and participants were encouraged to maintain the given cadence for as long as possible.
Gas exchange and heart rate analysis
Participants were equipped with a facemask, which covered their mouth and nose (Hans Rudolph, Shawnee, KS, USA). The facemask was connected with an anti-bacterial filter (PALL PRO1087, Pall, East Hills, NY, USA) to an Innocor™ device (Innocor™, Innovision, Odense, Denmark). Pulmonary gas exchange and ventilation were continuously measured breath by breath throughout all ergometer trials. Throughout all cycling tests, heart rate was recorded (Polar S610i, Polar Electro, Kempele, Finland). V̇ O2peak, V̇ O2 during the constant-load trials at CP (V̇ O2,CLT), carbon dioxide output during the constant-load trials at CP (V̇ CO2,CLT), respiratory exchange ratio during the constant-load trials at CP (RERCLT) and heart rate during the constant-load trials at CP (HRCLT) were determined as the highest mean over a 10-s period. The V̇ O2 slow component was calculated as the difference between the changes in V̇ O2 between min 2 and task failure and between min 2 and 6.
Blood analysis
For the analysis of [HCO3 -], [Na+], pH and actual base excess (ABE) 125 μl blood from the same earlobe were always obtained 75 min after the NaHCO3 ingestions and 15 min before the constant-load trials at CP on 1 and day 5. Blood was collected in a heparinized glass capillary tube and analyzed using a clinical blood gas analyzer (ABL 505, Radiometer, Copenhagen, Denmark). Venous blood samples (4 ml) were collected from the cubital vein before the constant-load trials at CP on days 1 and 5 (medica, Medizinische Laboratorien Dr. F. Kaeppeli, Zurich, Switzerland). These blood samples were analyzed for hemoglobin concentration and hematocrit, which were used to calculate changes in PV according to Dill and Costill [Citation26].
Body composition measurement
A densitometer (Lunar iDXA™, GE Healthcare, Madison, WI, USA) was used for the determination of total lean body mass and lean soft tissue mass of the legs. Dual-energy X-ray absorptiometry (DXA) measurements were performed just before the constant-load trials every second day throughout the intervention periods to assess leg lean mass as an indicator of glycogen content. According to the DXA two-component soft tissue model, lean soft tissue mainly consists of water, proteins, glycogen and soft tissue minerals [Citation27]. Water and glycogen content are further interconnected since each gram of glycogen binds 3–4 g of water [Citation28]. To ensure a similar provision of carbohydrates in the immediate post-exercise period, participants were given 0.75 dm3 of a regeneration drink (57 g carbohydrates∙ portion-1, Carbo Basic Plus, Winforce, Menzingen, Switzerland) instantly after completion of each constant-load trial.
Statistical analysis
To assess differences in T lim, blood values, gas exchange, heart rate, and body composition a two-way repeated-measures ANOVA having two levels of condition (NaHCO3 and placebo) and five levels of time (5 days of testing) was used. The assumption of sphericity was tested using Mauchly’s test. If the assumption of sphericity was violated, the degrees of freedom were corrected using the Greenhouse-Geisser estimates of sphericity. When F ratios were significant, post hoc comparisons of main effects were performed using a Student’s paired t-test with Bonferroni correction. PV data were not normally distributed and thus log-transformed before using the described analysis. All data are presented as means ± SD. The effect size is denoted as ηp 2 (partial eta-squared). The level of significance was set at P < 0.05. The statistical analyses were conducted using the software SPSS Statistics 20.0 (SPSS, Chicago, IL, USA).
Results
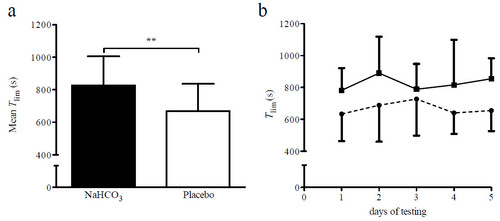
As judged by the leftover pill count, average compliance with NaHCO3 and placebo supplementation was 100%. T lim increased by 23.5% following NaHCO3 ingestion (F (1,7) = 35.45, P = 0.001, ηp 2 = 0.84; Figure a). However, there was neither an effect of time (F (4,28) = 1.1, P = 0.375, ηp 2 = 0.14) nor an intervention x time interaction (F (4,28) = 0.74, P = 0.464, ηp 2 = 0.01; Figure b). No differences in CP, as measured before the first and second supplementation period, could be found (306.8 ± 21.4 W vs. 309.0 ± 30.4 W; F (1,7) = 0.15, P = 0.708, ηp 2 = 0.02). Also, no difference could be found between CP as determined before the NaHCO3 and placebo intervention (304.3 ± 25.6 W vs. 311.5 ± 26.5 W; F (1,7) = 1.99, P = 0.202, ηp 2 = 0.22).
Figure 2 Time-to-exhaustion with NaHCO2 and placebo supplementation. a) Mean ± SD time-to-exhaustion (T lim ) with NaHCO3 and placebo, respectively, **P < 0.01; b) T lim with NaHCO3 (solid line) and placebo (dashed line) on the 5 days of testing are presented as group mean ± SD (n = 8).
The NaHCO3 intervention resulted in a significantly higher [HCO3 -] relative to placebo (F (1,7) = 118.71, P < 0.001, ηp 2 = 0.94; Table ). However, there was neither a main effect for time (F (1,7) = 0.05, P = 0.835, ηp 2 = 0.01) nor an intervention x time interaction (F (1,7) = 0.04, P = 0.855, ηp 2 = 0.01). [Na+] increased after NaHCO3 (F (1,7) = 12.44, P = 0.012, ηp 2 = 0.68) but remained constant with placebo supplementation. [Na+] did not significantly change over time (F (1,7) = 0.49, P = 0.509, ηp 2 = 0.08) with either condition. The mean ABE were significantly higher during the NaHCO3 compared to the placebo trials (F (1,7) = 100.42, P < 0.001, ηp 2 = 0.94), but not between days of testing (F (1,7) = 0.01, P = 0.920, ηp 2 = 0.00). Blood pH was increased with NaHCO3 supplementation (F (1,7) = 42.04, P < 0.001, ηp 2 = 0.86), showing no change between the testing days (F (1,7) = 1.11, P = 0.327, ηp 2 = 0.14). There was a main effect for a PV increase during interventions (F (1,7) = 19.22, P = 0.003, ηp 2 = 0.73; Table ) and days of testing (F (1,7) = 18.12, P = 0.004, ηp 2 = 0.72), as well as a significant intervention x time interaction (F (1,7) = 22.05, P = 0.002, ηp 2 = 0.76).
Table 1 [HCO 3 - ], [Na + ], ABE, pH and PV 75 min after supplement ingestion on the first and the fifth day of testing with either NaHCO 3 or placebo supplementation
The NaHCO3 ingestion resulted in a significant intervention x time interaction for total lean body mass (F (1,7) = 7.77, P = 0.027, ηp 2 = 0.53; Table ). In addition, total lean body mass raised over the five consecutive testing days in both conditions (F (2,14) = 10.97, P = 0.001, ηp 2 = 0.61; Table ). Lean soft tissue mass of the legs did not change neither during the interventions (F (1,7) = 3.16, P = 0.119, ηp 2 = 0.31) nor across the days of testing (F (2,14) = 1.38, P = 0.283, ηp 2 = 0.17; Table ).
Table 2 Total lean body mass and lean soft tissue mass of the legs on the different days of testing with either NaHCO 3 or placebo ingestion
V̇ O2,CLT and V̇ CO2,CLT did not differ between the interventions (F (1,7) = 1.453, P = 0.267, ηp 2 = 0.17 and F (1,7) = 1.132, P = 0.323, ηp 2 = 0.14; Table ) or between the days of testing (F (2,14) = 0.631, P = 0.667, ηp 2 = 0.39 and F (2,14) = 0.145, P = 0.964, ηp 2 = 0.020). None of the daily V̇ O2,CLT (data not shown) differed from V̇ O2peak (F (2,14) = 0.081, P = 0.923, ηp 2 = 0.011). There was no difference in the V̇ O2 slow component between the NaHCO3 and placebo intervention (0.08 ± 0.31 vs. 0.03 ± 0.28 l∙ min-1 for the NaHCO3 and placebo intervention, respectively; P = 0.504). RERCLT also was not different between interventions (F (1,7) = 2.947, P = 0.130, ηp 2 = 0.30) and days of testing (F (2,14) = 0.821, P = 0.523, ηp 2 = 0.11). HRCLT decreased during the 5 testing days (F (4,28) = 5.97, P = 0.001, ηp 2 = 0.46; Table ) but there was no main effect for condition (F (1,7) = 0.04, P = 0.852, ηp 2 = 0.01).
Table 3 Peak values during the CLT at CP for V O 2 , V CO2, RER and HR on the first and fifth day of testing with either NaHCO 3 or placebo supplementation
Discussion
Several new findings have been observed in this randomized, placebo-controlled, double-blind interventional crossover investigation. First, multiday NaHCO3 supplementation for 5 days increased T lim at CP on each day relative to placebo in highly trained athletes. Second, there was no difference in the increased T lim over the 5 days of supplementation with NaHCO3 or NaCl. Third, the increase in T lim was paralleled by increases in [HCO3 -], pH and ABE. Fourth, [HCO3 -] and [Na+] in the blood stabilized over time in the NaHCO3 condition. Fifth, calculated PV increased during the NaHCO3 more than in the placebo intervention.
We found that NaHCO3 supplementation led to an increase in T lim at CP and that the improvement in T lim was paralleled by an increase in blood [HCO3 -], pH and ABE, indicating that the alteration in T lim appears to be linked to an elevated extracellular buffer capacity. In fact, it has been shown that an increased [HCO3 -] gradient between the intra- and extramyocellular compartment leads to an amplified H+-efflux from the muscle cell and delays the fall in intramyocellular pH [Citation8, Citation14]. We observed a trend for higher [La-] during the constant-load tests following NaHCO3 supplementation (P = 0.070, data not shown), supporting the notion that the increased H+-concentration resulted from a lactate-proton symport. A fall in intramyocellular [H+] is associated with muscle fatigue due to 1) an inhibition of glycogenolysis and glycolysis [Citation8], 2) increased muscular K+ release, 3) lesser contractility of the heart muscle [Citation9], 4) inhibition of the sarcoplasmatic calcium release [Citation10] and 5) inhibition of the actin-myosin interactions [Citation11]. Thus, delaying the fall in intramyocellular pH might postpone the fatigue process and prolong intact muscle function. Indeed, our results showed that the ingestion of NaHCO3 induced metabolic alkalosis, which in turn enhanced T lim at CP and thus improved high-intensity exercise in the range of 10 to 20 min duration.
As hypothesized, T lim at CP could be increased with NaHCO3 supplementation. This is in contrast to the theoretical model, which states that an intramyocellular metabolic steady state exists at exercise intensities up to CP. However, our results support the notion that CP overestimates the metabolic steady state [Citation4, Citation5]. Furthermore, our result that NaHCO3 increased T lim at CP extends previous findings showing that NaHCO3 supplementation increases exercise above CP relative to placebo [Citation14, Citation29]. In the latter studies, short high-intensity tests, during which intramyocellular pH falls rapidly from the beginning of exercise, were completed. During these types of tests, the finite work capacity above CP (W ′ ) is drawn on after the start of exercise and becomes reduced. In light of our findings, these results might be interpreted to mean that NaHCO3 simply increases W’. However, Vanhatalo et al.[Citation23] showed that NaHCO3 does not increase W’ during a 3-min all-out test, and concluded that changes in intramyocellular pH might not influence W’ in this particular test setting, and that for short all-out exercise, [PCr] dynamics is more important in determining W’. In our constant-load trials at CP, W’ was supplied to a large extent by anaerobic glycolysis. Therefore, we assume that NaHCO3 supplementation increases W’ in conditions where acidification occurs during exercise. Our result that the estimated V̇ O2 slow component was not different between the two interventions lends further credence to this notion, although the influence of NaHCO3 on the V̇ O2 slow component remains ambiguous (reduction: [Citation30]; no change: [Citation31]). In our study, the identical V̇ O2 slow component for both, the NaHCO3 and placebo condition, indicated that V̇ O2peak was attained at the same point in time. Based on the fact that the depletion of W’ coincides with the attainment of V̇ O2peak[Citation32], our results indicate that NaHCO3 ingestion did not increase the rate of W’ utilization but rather W’ itself. Further support for our assumption comes from another study, where average power in a 60 min cycling time trial was found to be higher with NaHCO3 as compared to placebo [Citation33]. During a 60 min time trial, power output will fluctuate around CP with power peaks occurring e.g. at the start and during (final) sprints. In these occasions, i.e. when exercising above CP, W’ will be reduced. Consequently, a higher W’ can increase performance during tests of longer duration, especially if pacing strategies are implemented.
We also found that five bolus intakes on five consecutive days did not result in an increase of T lim beyond the value observed after the first intake. Thus, multiday administration of NaHCO3 did not lead to a cumulative effect on endurance capacity. Accordingly, [HCO3 -], blood pH, and ABE after multiday NaHCO3 administration also remained unchanged relative to the initial rise after the first bolus. The most obvious explanation would be that during each CP-trial a certain amount of NaHCO3 was used, leading to lower values for [HCO3 -], pH and ABE post vs. pre test. During the following 24 h of recovery, the body would then be expected to re-establish the resting values. On the following day, the participants then would start the CP trial at similar (complete recovery) or lower [HCO3 -], blood pH, and ABE (incomplete recovery) relative to the first day, whereby an additional increase in performance would not be expected. Although we did not measure [HCO3 -], pH and ABE before supplementation on the following days, these two described cases can be most likely excluded. The reason for this is that [Na+] also did not increase during the consecutive 5 days of NaHCO3 supplementation despite the fact that Na+, unlike HCO3 -, was not used as a buffer during the CP trials, and that the high amount of ingested Na+ could not be used completely through sweating. The predicted sweating rate during exercise of 1 dm3∙ h-1 water, with a sweat [Na+] of 50 mEq∙ dm3[Citation34] would have led to a Na+ loss of ~0.36 g. This calculated sweat-induced loss of Na+ corresponds to ~20% of the daily Na+ intake during the placebo intervention. Regarding the substantially higher Na+ intake during the NaHCO3 intervention, the sweat-induced loss of Na+ was negligible during this intervention.
As shown in this study, the NaHCO3 intervention led to an increase in [Na+] and plasma osmolality after the first bolus administration. This increase was counteracted by an expansion in PV. The increase in PV was to such an extent that pre-exercise blood [HCO3 -], pH, and ABE remained constant during the 5 days of testing. This proposed mechanism of PV expansion has already been described by Máttar et al.[Citation35], who showed that plasma [Na+] and plasma osmolality were increased after NaHCO3 injections in acute cardiac resuscitation. Other mechanisms to counteract increases in [Na+] and plasma osmolality comprise a shift of fluid from the intra- to the extramyocellular compartment [Citation36], a stimulation of arginine vasopressin secretion [Citation37], which leads to an intensified water retention from the kidneys [Citation38], and a stimulation of the thirst center whereby more fluid is consumed [Citation37]. In accordance with our results, McNaughton et al.[Citation29] found an increase in plasma [Na+] after the first of five doses of NaHCO3 but no further increase of plasma [Na+] on the following days. The elevation of PV in the present study is mirrored by the measured increase in DXA whole-body lean mass. In the DXA two-component soft tissue model, lean mass comprises water, proteins, glycogen and non-bone minerals [Citation27]. As increases in protein, glycogen and non-bone minerals can virtually be excluded (see below), the increase in whole-body lean mass must have resulted from an increase in whole body water, which led to an expansion in PV. Our findings are in accordance with the report of Lands et al.[Citation39] who found a significantly higher value for DXA-derived whole-body lean mass after saline infusion given to healthy male participants. Finally, our finding that HRCLT was reduced lends further credence to our result that PV increased as a consequence of NaHCO3 supplementation, because PV expansion simultaneously increases stroke volume and reduces sympathetic nervous activity, leaving V̇ O2,CLT unaffected [Citation40].
In our study, DXA-derived leg lean mass did neither change between interventions nor over time (Table ). As with each gram of glycogen stored in muscle tissue 3–4 g of water is bound [Citation28], and body water is present within the lean soft tissue compartment [Citation27], a decrease in leg lean mass in such a short time (2 days) would indicate a loss of glycogen. In turn, glycogen loss would implicate incomplete regeneration, which would manifest itself in a reduced anaerobic work capacity and, accordingly, decreased performance [Citation41]. Since our participants displayed neither a reduction in leg lean mass nor performance, the provided regeneration drink and the participants’ daily nutritional intake were sufficient to restore glycogen from day to day, allowing them to perform maximally on each day.
Our results have at least two practical implications. First, since the [HCO3 -] gradient between intramyocellular compartment and blood did not decrease over time, NaHCO3 can be taken daily in multiday competitions or tournaments lasting ≤ 5 d without the risk of reducing performance. Second, the apparent PV expansion in response to the high ion intake (see above) blunted any further increase in [HCO3 -]. If the same mechanism would be true for the chronic supplementation protocol, the effectiveness of this protocol should be questioned, as it seems that [HCO3 -] cannot be increased limitlessly, i.e. that it probably reaches a ceiling. The observed ceiling effect was probably based on a metabolic compensation mechanism preventing a disproportionate increase in [HCO3 -]. A respiratory compensation mechanism is unlikely to have occurred in our study because there were no differences between the NaHCO3 and placebo intervention for V̇ CO2 (P = 0.903, data not shown) and RER (P = 0.556, data not shown) during the resting measurements before the constant-load tests. Of further note is that the standard chronic protocol comprises a daily dose of 0.5 g NaHCO3 kg-1 body mass [Citation42], which might accentuate the increase in PV and possible side effects. Thus, one adequate dose of NaHCO3 administered before the competition should be effective in mediating all of the performance-enhancing effects without the need of a “loading phase”. In this context, our results expand the findings of McNaughton and Thompson [Citation16] as well as Siegler et al.[Citation17], who compared different acute and chronic protocols and found that there are no differences between these ingestion protocols with respect to exercise performance.
It may be argued that the present findings could be limited by 1) differences in performance ability throughout the study period and 2) decreasing motivation. Regarding the first point we have shown that CP was neither different between the first and second intervention period nor before the NaHCO3 and placebo condition. An increase in CP from the first to the second intervention would have indicated a training effect, whereas a decrease in CP would have indicated incomplete recovery. Hence, we can assume that the participants had the same performance ability throughout the study, allowing a comparison of T lim between the two conditions. Regarding the second point, decreasing motivation in a single participant would be evident from a decrease in T lim within or between interventions. Considering the single variations in T lim irrespective of condition, during which no distinct increases or decreases in T lim over time (i.e. from the second to the fifth test day) were identified, a decreasing motivation can be excluded for all participants. In addition, V̇ O2,CLT, V̇ CO2,CLT and RERCLT were not different between conditions and days of testing. This indicates that the participants’ effort was constant during the whole study period.
Conclusion
In conclusion, multiple acute, consecutive day NaHCO3 supplementation led to an increase in T lim at CP after the first bolus intake. However, while T lim remained elevated in the NaHCO3 condition, it was not further altered with prolonged NaHCO3 supplementation. The increase in T lim was accompanied by a higher [HCO3 -] gradient between the blood and the intramyocellular compartment, which stabilized over time in the NaHCO3 intervention. In contrast to the theoretical CP-model, where metabolites should reach a steady state during exercise at CP, and consequently, buffer substances should be ineffective in enhancing T lim, we showed that in practice T lim can be increased with NaHCO3 supplementation. Furthermore, the high amount of ingested Na+ caused a sustained elevation in PV, which inhibited a further increase in [HCO3 -], and consequently limited the performance-enhancing effect. Therefore, this study indicates that NaHCO3 can be taken daily in multiday competitions or tournaments to maintain performance ability throughout the whole duration of the competition.
Abbreviations
| ABE | = | Actual base excess |
| CP | = | Critical power |
| DXA | = | Dual-energy x-ray absorptiometry |
| [HCO3-] | = | Blood bicarbonate concentration |
| HRCLT | = | Heart rate during the constant-load trials at CP |
| NaCl | = | Sodium chloride |
| NaHCO3 | = | Sodium bicarbonate |
| Ppeak | = | Peak power output |
| PV | = | Plasma volume |
| RERCLT | = | Respiratory exchange ratio during the constant-load trials at CP |
| Tlim | = | Time-to-exhaustion |
| V̇ O2peak | = | Peak oxygen uptake |
| V̇ O2 | = | CLT: V̇ O2 during the constant-load trials at CP |
| V̇ CO2 | = | CLT: Carbon dioxide output during the constant-load trials at CP |
| W’ | = | The finite work capacity above CP |
Authors’ original file for figure 1
Download PDF (58.6 KB)Authors’ original file for figure 2
Download PNG Image (36.7 KB)
Acknowledgments
We thank delta pronatura Dr. Krauss & Dr. Beckmann KG (Egelsbach, Germany) and Winforce AG (Menzingen, Switzerland) for the NaHCO3 and placebo tablets, and the regeneration drink, respectively, which were kindly provided as a gift.
Competing interests
The authors declare that they have no competing interests.
Authors’ contributions
SMM, SMG, MT designed the study. SMG and SMM were involved in data collection. SMG, SMM, and MT were involved in statistical analysis and drafted the manuscript. SMM, SMG, SF, UB, CAW, and MT interpreted the data and reviewed the manuscript. All authors read and approved the final manuscript.
Related Research Data
References
- JonesAM VanhataloA BurnleyM MortonRH PooleDC Critical power: implications for the determination of V O 2max and exercise tolerance. Med Sci Sports Exerc 2010 42 1876 1890 https://doi.org/10.1249/MSS.0b013e3181d9cf7f 20195180
- MonodH ScherrerJ The work capacity of a synergic muscular group Ergonomics 1965 8 329 338 https://doi.org/10.1080/00140136508930810
- BrickleyG DoustJ WilliamsCA Physiological responses during exercise at critical power Eur J Appl Physiol 2002 88 146 151 1:STN:280:DC%2BD38nnsFWhtQ%3D%3D https://doi.org/10.1007/s00421-002-0706-1 12436283
- JenkinsDG QuigleyBM Blood lactate in trained cyclists during cycle ergometry at critical power Eur J Appl Physiol Occup Physiol 1990 61 278 283 1:STN:280:DyaK3M7jtVGjtg%3D%3D https://doi.org/10.1007/BF00357613 2282914
- PringleJS JonesAM Maximal lactate steady state, critical power and EMG during cycling Eur J Appl Physiol 2002 88 214 226 1:CAS:528:DC%2BD38XptFGisbY%3D https://doi.org/10.1007/s00421-002-0703-4 12458364
- JonesNL SuttonJR TaylorR ToewsCJ Effect of pH on cardiorespiratory and metabolic responses to exercise J Appl Physiol 1977 43 959 964 1:CAS:528:DyaE1cXhvFyqtw%3D%3D 24031
- JonesAM WilkersonDP DiMennaF FulfordJ PooleDC Muscle metabolic responses to exercise above and below the “critical power” assessed using 31P-MRS Am J Physiol Regul Integr Comp Physiol 2008 294 R585 R593 1:CAS:528:DC%2BD1cXit1ylu7g%3D https://doi.org/10.1152/ajpregu.00731.2007 18056980
- Hollidge-HorvatMG ParolinML WongD JonesNL HeigenhauserGJ Effect of induced metabolic alkalosis on human skeletal muscle metabolism during exercise Am J Physiol Endocrinol Metab 2000 278 E316 E329 1:CAS:528:DC%2BD3cXhsVOgsr4%3D 10662717
- FabiatoA FabiatoF Effects of pH on the myofilaments and the sarcoplasmic reticulum of skinned cells from cardiac and skeletal muscles J Physiol 1978 276 233 255 1282422 1:STN:280:DyaE1c7ntlGgsg%3D%3D https://doi.org/10.1113/jphysiol.1978.sp012231 25957
- DonaldsonSK HermansenL BollesL Differential, direct effects of H+ on Ca2+-activated force of skinned fibers from the soleus, cardiac and adductor magnus muscles of rabbits Pflugers Arch 1978 376 55 65 1:CAS:528:DyaE1cXls1Skt7g%3D https://doi.org/10.1007/BF00585248 30066
- LannergrenJ WesterbladH Force decline due to fatigue and intracellular acidification in isolated fibres from mouse skeletal muscle J Physiol 1991 1991 434 307 322 https://doi.org/10.1113/jphysiol.1991.sp018471
- FittsRH Cellular mechanisms of muscle fatigue Physiol Rev 1994 74 49 94 1:CAS:528:DyaK2cXhvVOktrs%3D 8295935
- ForbesSC RaymerGH KowalchukJM MarshGD NaHCO3-induced alkalosis reduces the phosphocreatine slow component during heavy-intensity forearm exercise J Appl Physiol 2005 99 1668 1675 1:CAS:528:DC%2BD2MXht1CrtbnJ https://doi.org/10.1152/japplphysiol.01200.2004 16002768
- BishopD EdgeJ DavisC GoodmanC Induced metabolic alkalosis affects muscle metabolism and repeated-sprint ability Med Sci Sports Exerc 2004 36 807 813 1:CAS:528:DC%2BD2cXkvFaisr4%3D https://doi.org/10.1249/01.MSS.0000126392.20025.17 15126714
- MainwoodGW Worsley-BrownP The effects of extracellular pH and buffer concentration on the efflux of lactate from frog sartorius muscle J Physiol 1975 250 1 22 1348336 1:CAS:528:DyaE2MXkvFCisr8%3D https://doi.org/10.1113/jphysiol.1975.sp011040 16992502
- McNaughtonL ThompsonD Acute versus chronic sodium bicarbonate ingestion and anaerobic work and power output J Sports Med Phys Fitness 2001 41 456 462 1:CAS:528:DC%2BD38XksFGgsg%3D%3D
- SieglerJC MidgleyAW PolmanRC LeverR Effects of various sodium bicarbonate loading protocols on the time-dependent extracellular buffering profile J Strength Cond Res 2010 24 2551 2557 https://doi.org/10.1519/JSC.0b013e3181aeb154 20040895
- WuCL ShihMC YangCC HuangMH ChangCK Sodium bicarbonate supplementation prevents skilled tennis performance decline after a simulated match J Int Soc Sports Nutr 2010 7 33 2978121 https://doi.org/10.1186/1550-2783-7-33 20977701
- PriceMJ CrippsD The effects of combined glucose-electrolyte and sodium bicarbonate ingestion on prolonged intermittent exercise performance J Sports Sci 2012 30 975 983 https://doi.org/10.1080/02640414.2012.685086 22616569
- HeerM Frings-MeuthenP TitzeJ BoschmannM FrischS BaeckerN BeckL Increasing sodium intake from a previous low or high intake affects water, electrolyte and acid–base balance differently Brit J Nutr 2009 101 1286 1294 1:CAS:528:DC%2BD1MXnt1Ght74%3D https://doi.org/10.1017/S0007114508088041 19173770
- McNaughtonL Bicarbonate ingestion: effects of dosage on 60 s cycle ergometry J Sports Sci 1992 10 415 423 1:STN:280:DyaK3s%2FlvFGrtw%3D%3D https://doi.org/10.1080/02640419208729940 1331493
- StephensTJ McKennaMJ CannyBJ SnowRJ McConellGK Effect of sodium bicarbonate on muscle metabolism during intense endurance cycling Med Sci Sports Exerc 2002 34 614 621 1:CAS:528:DC%2BD38Xjt1ChsLc%3D https://doi.org/10.1097/00005768-200204000-00009 11932569
- VanhataloA McNaughtonLR SieglerJH JonesAM Effect of induced alkalosis on the power-duration relationship for “all-out” exercise Med Sci Sports Exerc 2010 42 563 570 1:CAS:528:DC%2BC3cXitlShsLc%3D https://doi.org/10.1249/MSS.0b013e3181b71a4a 19952817
- HillDW The critical power concept A review. Sports Med 1993 16 237 254 1:STN:280:DyaK2c%2FmvFWltg%3D%3D https://doi.org/10.2165/00007256-199316040-00003 8248682
- BrickleyG GreenS JenkinsDG McEineryM WishartC DoustJD WilliamsCA Muscle metabolism during constant- and alternating-intensity exercise around critical power Int J Sports Med 2007 28 300 305 1:CAS:528:DC%2BD2sXltlOgsrk%3D https://doi.org/10.1055/s-2006-924354 17024627
- DillDB CostillDL Calculation of percentage changes in volumes of blood, plasma, and red cells in dehydration J Appl Physiol 1974 37 247 248 1:STN:280:DyaE2c3pvV2ntw%3D%3D 4850854
- PietrobelliA FormicaC WangZ HeymsfieldSB Dual-energy X-ray absorptiometry body composition model: review of physical concepts Am J Physiol 1996 271 6 Pt 1 E941 E951 1:CAS:528:DyaK2sXmtFCrug%3D%3D 8997211
- OlssonKE SaltinB Variation in total body water with muscle glycogen changes in man Acta Physiol Scand 1970 80 11 18 1:CAS:528:DyaE3cXlt1ymtro%3D https://doi.org/10.1111/j.1748-1716.1970.tb04764.x 5475323
- McNaughtonL BackxK PalmerG StrangeN Effects of chronic bicarbonate ingestion on the performance of high-intensity work Eur J Appl Physiol 1999 80 333 336 1:CAS:528:DyaK1MXkvVSjsr0%3D https://doi.org/10.1007/s004210050600
- BergerNJA McNaughtonLR KeatleyS WilkersonDP JonesAM Sodium bicarbonate ingestion alters the slow but not the fast phase of V̇ O2 kinetics Med Sci Sports Exerc 2006 38 1909 1917 1:CAS:528:DC%2BD28XhtFymtL3I https://doi.org/10.1249/01.mss.0000233791.85916.33 17095923
- SantallaA PérezM MontillaM VicenteL DavisonR EarnestC LuciaA Sodium bicarbonate ingestion does not alter the slow component of oxygen uptake kinetics in professional cyclists J Sports Sci 2003 21 39 47 https://doi.org/10.1080/0264041031000070949 12587890
- BurnleyM JonesAM Oxygen uptake kinetics as a determinant of sports performance Eur J Sports Sci 2007 7 63 79 https://doi.org/10.1080/17461390701456148
- McNaughtonL DaltonB PalmerG Sodium bicarbonate can be used as an ergogenic aid in high-intensity, competitive cycle ergometry of 1 h duration Eur J Appl Physiol 1999 80 64 69 1:CAS:528:DyaK1MXisFOjsrw%3D https://doi.org/10.1007/s004210050559
- MontainSJ CheuvrontSN SawkaMN Exercise associated hyponatremia: quantitative analysis to understand the aetiology Br J Sports Med 2006 40 98 106 2492017 1:STN:280:DC%2BD28%2Fkt1Oluw%3D%3D https://doi.org/10.1136/bjsm.2005.018481 16431994
- MáttarJA WeilMH ShubinH SteinL Cardiac arrest in the critically ill: II. Hyperosmolal states following cardiac arrest Am J Med 1974 56 162 168 https://doi.org/10.1016/0002-9343(74)90593-2 4812073
- HeFJ MarkanduND SagnellaGA DeWardenerHE MacGregorGA Plasma sodium: ignored and underestimated Hypertension 2005 45 98 102 1:CAS:528:DC%2BD2cXhtFaiu7zP https://doi.org/10.1161/01.HYP.0000149431.79450.a2 15557392
- RobertsonGL SheltonRL AtharS The osmoregulation of vasopressin Kidney Int 1976 10 25 37 1:CAS:528:DyaE28XltVKqsr0%3D https://doi.org/10.1038/ki.1976.76 181630
- RoosJC KoomansHA Dorhout MeesEJ DelawiIM Renal sodium handling in normal humans subjected to low, normal and extremely high sodium supplies Am J Physiol 1985 249 6 Pt 2 F941 F947 1:CAS:528:DyaL28Xmt1ygtA%3D%3D 3907374
- LandsLC HornbyL HohenkerkJM GlorieuxFH Accuracy of measurements of small changes in soft-tissue mass by use of dual-energy X-ray absorptiometry Clin Invest Med 1996 19 279 285 1:STN:280:DyaK2s%2Fgs1arsA%3D%3D 8853576
- KanstrupIL EkblomB Acute hypervolemia, cardiac performance, and aerobic power during exercise J Appl Physio 1982 52 1186 1191 1:STN:280:DyaL383jvVyqtQ%3D%3D
- MiuraA SatoH SatoH WhippBJ FukubaY The effect of glycogen depetion on the curvature constant parameter of the power-duration curve for cycle ergometry Ergonomics 2000 43 133 141 1:STN:280:DC%2BD3c7isFegug%3D%3D https://doi.org/10.1080/001401300184693 10661696
- DouroudosII FatourosIG GourgoulisV JamurtasAZ TsitsiosT HatzinikolaouA MargonisK MavromatidisK TaxildarisK Dose-related effects of prolonged NaHCO3 ingestion during high-intensity exercise Med Sci Sports Exerc 2006 38 1746 1753 1:CAS:528:DC%2BD28XhtValtbvP https://doi.org/10.1249/01.mss.0000230210.60957.67 17019296
Authors’ original submitted files for images
Below are the links to the authors’ original submitted files for images.