Abstract
Local mountain meteorology of the landscape around Longyearbyen in central Svalbard is analyzed through the decade from 2000 to 2011. Standard meteorological stations from close to sea level and up to 464 m a.s.l. located on different periglacial landforms, have been used. During winters with little sea ice, strong temperature inversions do not develop, and then there is a distinct cooling with height, as opposed to when sea ice is present. Airflow is accelerated due to topography and direction deflected in the confined valleys, whereas open plateaus have on average 1 m/s lower wind speeds with a regional SE direction. The permafrost thermal state is largely controlled by meteorology, with permafrost in the valley bottoms as cold as on the mountain plateaus. The periglacial landform most exposed to climatic variability is ice-wedges, which seem to crack mainly during shorter cooling periods. Such activity is also linked to temperature inversions, and thus also occur mainly when sea ice is present. Solifluction is mainly controlled by the balance between summer thawing and winter freezing in combination with snow dynamics, whereas avalanches are mainly wind controlled. Avalanches and avalanche controlled landforms are least sensitive to climatic variability.
Introduction
The geographical location of the Svalbard archipelago at 78°N, and its close interaction with the sea in the fjords dissecting the west coast of the main island Spitsbergen, provide conditions for a warm high arctic maritime climate, not found this far north in any other part of the Arctic (CitationEckerstorfer and Christiansen, 2011a). To understand how the geomorphology of Svalbard's high-relief landscape is affected by climatic variability, we have studied the detailed local meteorology of the landscape around the main settlement Longyearbyen in central Svalbard, where also periglacial process studies are performed.
Svalbard has the longest historical meteorological high arctic record homogenized for the Longyearbyen area, the last part being obtained from the presently operating official meteorological station at the Longyearbyen airport. This station is located close to the sea. No continuous meteorological measurements have been collected in the highlands, which constitute the largest parts of the Svalbard landscape. Thus in 2000 and 2001 we established two meteorological stations in the highlands surrounding Longyearbyen.
Here we present, analyze, and compare the last 10-year meteorological record from three investigated meteorological stations located in a transect from the Longyearbyen airport official meteorological station at 28 m a.s.l., close to the sea; to the Gruvefjellet meteorological station at 464 m a.s.l., located on the mountain plateau blockfield area right above Longyearbyen; to the Janssonhaugen meteorological station at 251 m a.s.l., located on an inland mountain top site in the inner part of the Adventdalen valley. We use meteorological analysis to improve the understanding of the meteorological sensitivity of different periglacial landforms, which constitute large parts of the landscape in the Longyearbyen central Svalbard area.
Study Area
GEOMORPHOLOGY
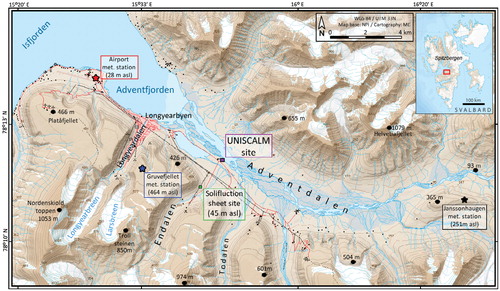
The landscape around the Longyearbyen settlement is located at 78° N, 15° E, in the center of the Svalbard archipelago, and on the main island Spitsbergen (). Geologically, the area is largely controlled by the subhorizontal layering of sedimentary rocks of Early Permian to Eocene age, with increasingly younger rocks exposed towards the southwest (CitationDallmann et al., 2001). Geomorphologically, the landscape is characterized by widespread plateaus dissected by wide glacially eroded valleys, which today contain only smaller cirque glaciers. Therefore the main part of the landscape is periglacial, consisting of steep, concave mountain sides with fluvially eroded gorges on either side and with flat braided river plains in the larger valley bottoms, such as the wide Adventdalen and the Longyeardalen valleys (). The overall relief in the area is around 1000 m, with the highest peak, Nordenskioldstoppen, reaching 1053 m a.s.l. ().
The periglacial landscape has continuous permafrost without any high vegetation (CitationHumlum et al., 2003). Temperatures in the top of the permafrost vary from -6 °C to -3 °C in the area around Longyearbyen (CitationChristiansen et al., 2010).
METEOROLOGICAL CHARACTERISTICS OF SVALBARD
The synoptic air flow over the Svalbard area is largely affected by the location of the polar front and its seasonal displacements. Generally low pressures near Iceland and high pressures over Greenland, the North Pole, and Russia control Svalbard's meteorology (CitationHanssen-Bauer et al., 1990). This pattern is relatively weak in summer, and stronger in winter. Typically from the north, cold anti-cyclonic, high pressure air masses extend down over the Svalbard area, causing longer cold and stable conditions during winter. However, during the winter season meridional moisture transport along the North Atlantic cyclone track brings warm air masses with precipitation to Svalbard (CitationDickson et al., 2000) from the west, and causes large temperature variation during winter, with several above or close to freezing events.
FIGURE 1. Topographical overview of the study area around Longyearbyen in central Svalbard, with the locations of the three meteorological stations (filled stars) and other research sites mentioned in the text.
Uniquely, the meteorology of the central Spitsbergen area around Longyearbyen has been recorded since 1912 (CitationFørland et al., 1997), presumably making this Svalbard meteorological record the longest series from the High Arctic. This is the series being presently collected at the Longyearbyen airport official meteorological station, from now on simply called “Airport” in this paper ().
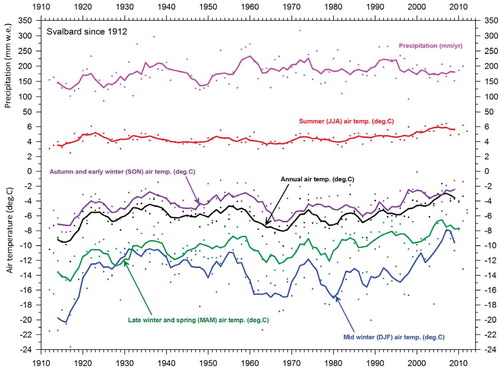
The long meteorological record shows the distinct warming period around 1920, where within 5 years the mean annual air temperature (MAAT) at sea level changed from about -9 °C to -4 °C, reflecting the termination of the Little Ice Age. Later in the 1960s, MAAT dropped by about 5 °C, until it gradually started rising towards the end of the 20th century (). The precipitation is very low on average—about 190 mm annually—throughout the entire record, making the study area an arctic desert. However, precipitation is very difficult to measure correctly as most of the precipitation falls as snow, and often snow drifting is not sampled correctly by the rain buckets used as standard instrumentation for precipitation, even at arctic meteorological stations. Despite using snow depth sensors, still no completely correct precipitation values are obtained. Thus we refrain from analyzing the precipitation records in this study. Humlum (Citation2002) modeled precipitation gradients as rising by 5–10% per 100 m of altitude in central Nordenskioldsland ().
The snowpack in the area around Longyearbyen is strongly influenced by the maritime setting, but has otherwise rather continental characteristics. It is thin, spatially highly variable due to the low precipitation amounts and constant wind in the barren landscape. It is also cold and highly stratified, containing a depth hoar base and several wind slabs enabling slab avalanching. In between, ice layers are common due to mid-winter rain-on-snow events caused by the maritime setting (CitationEckerstorfer and Christiansen, 2011a).
Methods
THE GRUVEFJELLET, JANSSONHAUGEN, AND LONGYEARBYEN AIRPORT METEOROLOGICAL STATIONS
The Airport meteorological station is located on raised marine beaches in a wide open flat area 28 m a.s.l., approximately 200 m south of the southern shore of the Isfjorden fjord (). It is located inside the airport fenced off area, close to the runway. There is free access to the daily data from the station through the e-climate service (met.no; CitationNorwegian Meteorological Institute, 2010). It records air temperature, wind speed and direction at the standard height of 2 m above the ground. The precipitation gauge was moved out from the airport area recently, but only approximately 100 m away on the same raised marine terrace. There is an improvement in the resolution of the wind direction data from mid-2005.
The Gruvefjellet meteorological station was established in the central part of the Gruvefjellet mountain plateau at 464 m a.s.l. () in August 2001. It is located in the middle of the plateau on an extensive blockfield, thus avoiding plateau edge effects and recording the regional air flow as unaffected by the morphology as possible. A borehole was drilled down to 5 m in winter 2008 and instrumented with a thermistor string (CitationChristiansen et al., 2010). Thus we know that the active layer is around 0.8 m and the mean annual ground temperature at 5 m is -5.3 °C (CitationChristiansen et al., 2010).
FIGURE 2. Mean annual precipitation and air temperature at Longyearbyen, Svalbard, since 1912, showing annual observations (points) and running 5-year average (solid lines). The older part of the data series represents a homogenized time series (CitationNordli et al., 1996), whereas the new part of the series is from the Longyearbyen airport official station, called Airport in this paper. Data from the Norwegian Meteorological Institute (Citation2010; accessed in 2011).
The Janssonhaugen meteorological station was established on the eastern summit of the Janssonhaugen mountain at 251 m a.s.l. () in May 2000. The site has medium-sized 1- to 1.5-mdiameter polygons and consists mainly of medium- to fine-grained sediments on top of the sedimentary bedrock below. The station is located about 15 m north of the 102-m-deep PACE borehole drilled in 1998 (CitationSollid et al., 2003).
Until 2006 Aanderaa equipment was recording all parameters at both the Gruvefjellet and Janssonhaugen stations, each from a boom sitting 3 m above the ground, preventing polar bear interaction. New stations have since 2006 been recording air temperatures using PT1000 sensors, and wind speed and direction using Young 05103 combined speed and direction instruments also at 3 m above the ground. Data is stored every hour in CRl000 Campbell dataloggers. Wind data is recorded every 15 seconds, but only values averaged hourly are stored. At Janssonhaugen the old station physically disappeared sometime between spring 2005 and autumn 2006, thus preventing a period of overlap operation, and leaving a hole in the data series from June 2005 to November 2006. At Gruvefjellet we ran the two stations with an overlap period of more than one year. Comparing the two data series we did not find any significant deviations, thus we simply started using the new station data from 1 December 2006 for the Gruvefjellet meteorological station.
Both the Gruvefjellet and the Janssonhaugen meteorological stations provide free online access to all collected data through the UNIS website (http://www.unis.no). This secures continuous operation, and is possible as each station has a modem. Using LoggerNet software they transfer data directly to UNIS using the mobile telephone network several times daily. This is an important part of being able to directly use the data to observe and understand on-going meteorology, and how this controls active landforming processes.
METEOROLOGICAL ANALYSES
Analyses are performed on data covering the period from summer 2000 to summer 2011, to allow for a full decade of data to be included also for the Gruvefjellet site. We analyzed daily average values from the three meteorological stations. Daily values were calculated from the hourly values that have been stored for each of the stations during the period of operation. We present data in different ways as they are relevant for improved understanding of the periglacial landscape dynamics. For mean annual air temperatures we use the hydrological year from 1 September to 31 August, enabling one continuous winter in the same year. Thus we do not use calendar years. The same applies for the wind data. For the cumulated thawing degree days (TDD) these are for full calendar years, as the main amount of energy comes through the entire summers, while for the cumulated freezing degree days (FDD) we again use the hydrological year. We also present monthly values, but only include months with full data coverage. Running annual averages have been calculated based on the daily values. Summer is defined as the months June, July, and August; autumn as September, October, and November; winter as December, January, and February; and spring as March, April, and May.
Results
AIR TEMPERATURE
Large interannual air temperature variations characterize all three stations, however, with the summer values being much more constant than winters (Figs. 3, 4; ). The rest of the year generally has much more variation. Each late autumn, winter, or early spring has at least one to four months that are warmer than the general sine-shaped annual temperature curve would indicate (). This demonstrates the influence of the warm sea.
FIGURE 3. Daily air temperature values from upper Airport (red), middle Gruvefjellet (blue), and lower Janssonhaugen (black) from 2000 to 2011. Running 365-day averages are included except for Janssonhaugen due to the discontinuous data record, due to missing data.
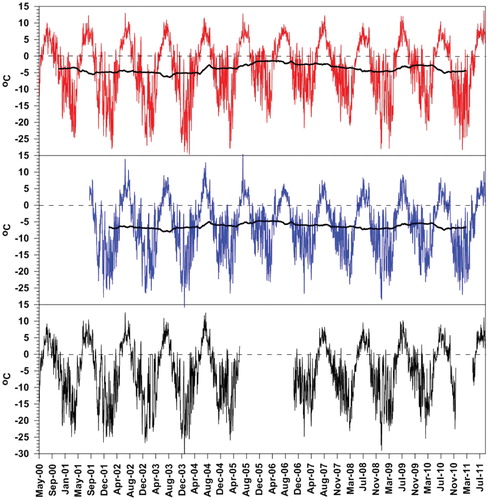
The Airport station is significantly warmer than the two inland stations (, , and ). Typically the Gruvefjellet station is coldest as it is located highest, while Janssonhaugen shows intermediate values. This is most pronounced during the two warmest summer months, July and August, but also particularly in the relatively warmer months in the mid-winter period any time from November to April. The periods of May and June and September and October are when air temperatures are most interannually stable over the investigated decade. Then, temperatures are transitioning from spring to summer and in autumn, and thus generally within the -5 to +5 °C interval.
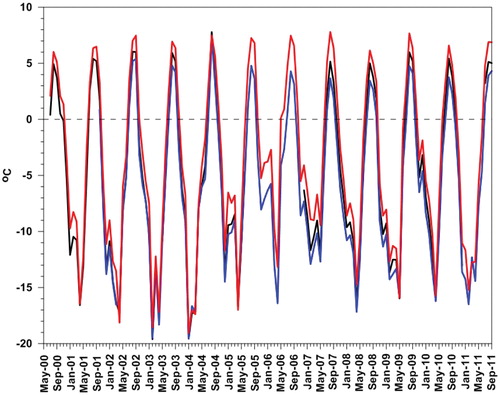
The summer of 2004 was significantly different as all three stations recorded almost identical high decadal monthly values, from 7.5 °C at Airport and Gruvefjellet, to 7.8 °C at Janssonhaugen (). All other years had much larger monthly temperature differences among the three stations in the warmest summer months of July and August. In July 2004 large amounts of sea ice entered Isfjorden, partly blocking ship transportation. In particular, the Adventfjorden ( and )—and by this also Longyearbyen—was blocked by sea ice for a longer period. The sea ice had a cooling effect near the coast, and whereas this was clearly the warmest month of the decade for both Gruvefjellet and Janssonhaugen stations, it was only close to being the warmest for the Airport station.
FIGURE 4. Monthly mean air temperature values from Airport (red), Gruvefjellet (blue), and Janssonhaugen (black) meteorological stations from 2000 to 2011.
The interannual winter variability is particularly pronounced at the Airport station. In winters without too many warming events, the air temperature is more alike at the three stations (). Exceptional were the overall warmer winters of, particularly, 2004–2005, 2005–2006, and 2006–2007. Then the difference in monthly air temperatures was several degrees between Airport and the other two stations, whereas the difference between the Gruvefjellet and the Janssonhaugen stations was only minor. This happened when the sea was almost totally ice free in Isfjorden, and thus clearly able to significantly warm the Airport station, but much less so for the stations at higher altitude and inland.
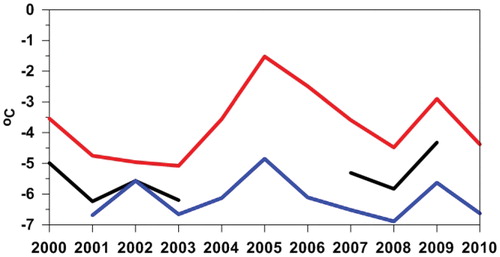
The mean hydrological annual air temperature values () show the same overall variation for all 3 stations. But the variation was significantly larger at the Airport station, varying from -5.0 °C to -1.5 °C, compared to a variation at Gruvefjellet only from -7.0 °C to -5.0 °C, and at Janssonhaugen only from -6.2 °C to -4.9 °C. Studying the running mean of 365 days based on the daily values () gives almost the same result. So clearly the further inland the station, the less interannual variability.
TABLE 1 Annual air temperature, wind speed, thawing degree days (TDD), and freezing degree days (FDD) for the three meteorological stations Airport (Airp.), Janssonhaugen (Jans.), and Gruvefjellet (Gruv.). All annual values are calculated for hydrological years from 1 September to 31 August to include full winters. Only TDD is calculated for entire summers using calendar years. TDD is therefore calculated only for the first year in the annual ranges. TDD in 2011 is added for all stations. For Janssonhaugen TDD is only calculated from 5 May until 1 September. Blank parts of the table represent years with missing data, preventing mean annual values or sums to be calculated.
FIGURE 5. Mean annual air temperatures (MAAT) for the hydrological years starting in the year labeled on the χ-axis. Red Airport, blue Gruvefjellet, and black Janssonhaugen meteorological stations.
WIND SPEED AND DIRECTION
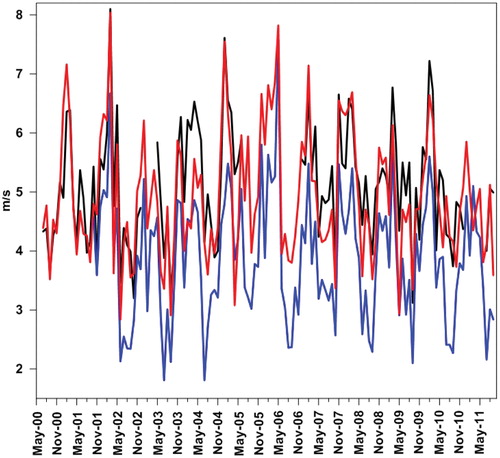
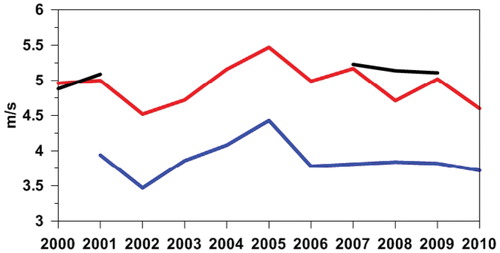
All three sites have an overall annual pattern with the lowest wind speeds during the summer, and highest wind speeds during the late autumn and winter months of November, December, January, and February (; ). Only in 2006 did the highest wind speeds occur in April, which had a mean wind speed 3–4 m/ s higher than during any April in the studied decade, both for Gruvefjellet and Airport stations. From Janssonhaugen there is unfortunately no data from this period. Generally the mean annual wind speed is 1 m/s lower at Gruvefjellet compared to the other two stations (). Janssonhaugen and Airport wind speeds generally follow the same pattern, but with some deviations. Often the wind speed is higher at Janssonhaugen compared to the Airport site. The overall decadal variability in wind speeds is small, with a small peak in the 2005–2006 year ().
All three sites have a dominant wind direction from SE, except for Janssonhaugen, where ENE winds dominate until the end of 2007 when it changed somewhat to be more from E to SE, but back again in summer 2011 to ENE (). This deviation must be due to an instrument problem during the end of 2007, as the values returned to ENE after instrument checking and restarting in 2011 (). However, both Airport and Janssonhaugen also have a dominance of winds from the SW to NW sector (). Winds in this sector are not dominant at Gruvefjellet (). The two dominant wind directions at Airport change somewhat seasonally, with the SE winds dominant in winter, while the SW to NW winds dominate in summer (). At Janssonhaugen also, the SW to NW winds have a slight tendency for summer dominance, while the ENE winds are constant throughout the year ().
The presented wind speed and direction data show the great importance of topography on the airflow in the Svalbard landscape. Janssonhaugen, with its location in the narrow inner part of the Adventdalen valley, often experiences the strongest winds, most likely due to acceleration of the winds being channelized there. Airport also has relatively strong winds, but due to its location in the open outer part of the Adventdalen there is less acceleration of the winds, and more winds also from the direction of the open fiord. The overall regional airflow is mainly from the SE to W demonstrated by the unconfined Gruvefjellet station data; while at both of the other sites topography channels the airflow. This also explains the lower average wind speed at Gruvefjellet.
LAPSE RATES BETWEEN GRUVEFJELLET AND AIRPORT STATIONS
Lapse rates have been calculated between the Gruvefjellet and Airport stations, showing large fluctuations in the monthly values (). Some months have positive or only slightly negative values (0.37 to -0.21), indicating higher or relatively high air temperatures at Gruvefjellet mountain compared to the lower Airport site. This typically occurs during periods with longer inversions caused by stationary high pressure providing cold and stable conditions. This happens often in winter when cold air descends into the valleys. However, this also happened in July 2004 () when sea ice was widespread in the Isfjorden fiord, thereby cooling the air temperature at sea level more than on Gruvefjellet mountain, which recorded its warmest July during the investigated decade ().
FIGURE 6. Sea ice in Adventfjorden seen towards the Longyearbyen Airport on 20 July 2004.
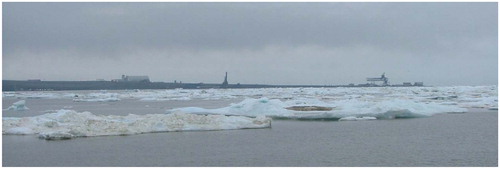
FIGURE 7. Monthly mean wind speed values from Airport (red), Gruvefjellet (blue) and Janssonhaugen (black) meteorological stations from 2000 to 2011.
Over the decade there are clear changes in the overall lapserate conditions. At the beginning and end of the decade generally large variability occurred, with averages around -0.4 to -0.6 °C/ 100 m. Significantly less variability and more negative lapse rates characterize the period May 2005 to October 2008, with averages of -0.7 to -0.8 °C/100 m. During this period air temperatures deviated more between the two stations ( and ). It coincides also with the period with almost no sea ice in Isfjorden, and generally warmer winters. Presumably lack of sea ice resulted in atmospheric warming close to sea level, causing a significant increase in the lapse rates, as the higher located landscape was relatively less affected by this warming.
FIGURE 8. Annual mean wind speeds for the hydrological years starting with the values indicated on the χ-axis for the Airport (red), Gruvefjellet (blue), and Janssonhaugen (black) meteorological stations.
FREEZING AND THAWING DEGREE DAYS
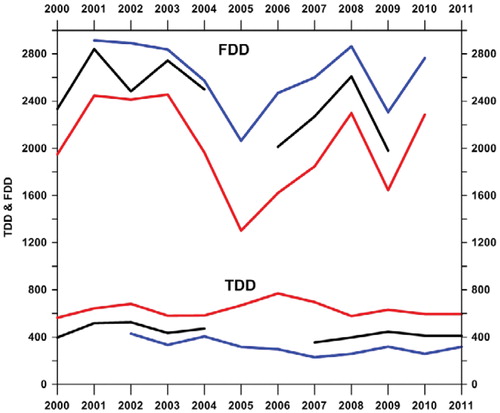
Clearly in this permafrost environment the number of freezing degree days (FDD) is much larger than the number of thawing degree days (TDD) (; ). The Airport station has the highest number of TDD and the smallest number of FDD, whereas conditions are opposite for Gruvefjellet station, which is highest, with Janssonhaugen station in an intermediate position (). The relatively stable and cool summers recorded through the investigated decade are reflected in the small interannual variation in TDD (). The overall interannual variability follows the same pattern for the FDD for all three sites, whereas this is not the case for the TDDs. During the 2004–2007 period the Gruvefjellet station had a decreasing TDD, which was contemporary with a significant increase in TDD at the Airport station, while during the remaining part of the decade the changes in TDD followed the same pattern for all three stations ().
The hydrological year 2005–2006 is special with the smallest number of FDD primarily at the Airport site, but also with a minimum at the Gruvefjellet site. The Airport site had a clear peak in TDD in the summer of 2006, while this was not the case for the Gruvefjellet site. The sea ice of July 2004 also caused a relatively low TDD for the Airport site, but not for the other two sites ().
FIGURE 9. Daily wind direction values from Airport (red, upper part), Gruvefjellet (blue, middle part) and Janssonhaugen (black, lower part) meteorological stations from 2000 to 2011.
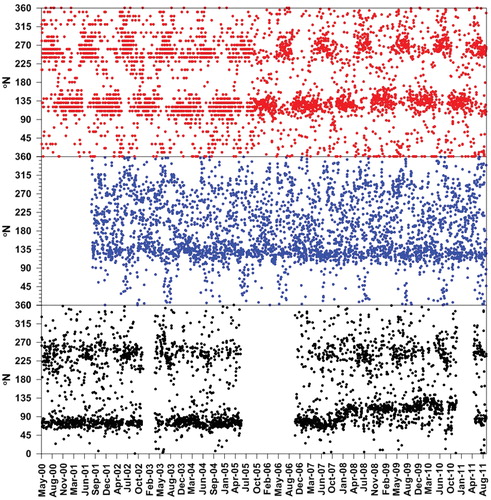
FIGURE 10. Monthly lapse-rate values between Gruvefjellet and Airport stations (blue curve). A running 23 months average calculation is also included (black curve) from 2000 to 2011.
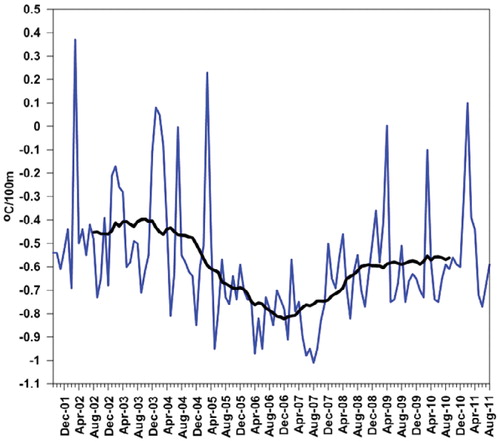
FIGURE 11. Thawing degree days (TDD) (lower part) and freezing degree days (FDD) (upper part) from Airport (red), Gruvefjellet (blue), and Janssonhaugen (black) meteorological stations. FDD is calculated for the hydrological year to include one entire winter, while TDD is calculated for entire summers within calendar years. FDD years start with the value on the χ-axis. TDD for 2011 for Janssonhaugen is only calculated for the period 5 May to 31 August.
Longyearbyen 2000–2011 Meteorological Characteristics
The data series presented show large interannual, interseasonal, and intermonthly variability during the analyzed decade. This is mainly due to the maritime location of the Svalbard archipelago and its large climatic sensitivity. According to the traditional Köppen-Geiger climate classification, all three stations were clearly within the definition of polar tundra climate, ET (CitationKottek et al., 2006).
The data presented show that the Svalbard periglacial archipelago landscape, even in the mountains of central Svalbard, is significantly affected by maritime conditions all year-round, primarily due to the high variability in sea ice extension both summer and winter. This is opposite to most other arctic coastal areas, which are only affected significantly by their coastal proximity during summer and not during winter, due to much more stable sea ice cover conditions, such as reported from the north slope of Alaska (CitationRomanovsky and Osterkamp, 1995) and the western Canadian arctic coast (CitationBurn, 1997).
Svalbard's high-relief landscape is affected by temperature inversions during calm high-pressure situations. The decadal analysis shows that during winters with little sea ice, temperature inversions tend to not affect the monthly lapse-rate values. Instead, a distinct cooling with height is observed, as opposed to when sea ice is present, and conditions become slightly more continental allowing temperature inversions. The airflow is also accelerated due to the topography, and the direction is deflected in the confined parts of the landscape, particularly in narrow valleys, whereas the open plateaus and the less confined parts of the landscape have lower wind speeds.
Discussion
We use the above analysis of the meteorological conditions in the Longyearbyen area for improved understanding of how different periglacial landforms are meteorologically affected.
SEA ICE CONTROL ON THE PERIGLACIAL LANDSCAPE IN SVALBARD
It is clear from the above that the sea ice extent influences significantly the meteorological conditions in the Longyearbyen area. A close link between sea ice cover and air temperature in Svalbard has been documented (CitationBenestad et al., 2003).
The year 2004 has been recognized as having maximum ice cover in the area west of Svalbard within the 2000–2009 period, coinciding with the decadal maximum in heat transport by the West Spitsbergen Current (CitationTeigen et al., 2011). This agrees well with the theory that heavy ice conditions west of Spitsbergen might correspond with high heat input into the Arctic (CitationTeigen et al., 2011). The longest period in the studied decade of relatively high lapserates also occurred during the 4-month period from December 2003 to March 2004 (), indicating the presence of an extensive sea ice cover. Additionally, the July 2004 sea ice occurrence in Isfjorden led to an absolute decadal high July lapse-rate of —0.004 °C/100 m. Contemporarily, the highest July air temperatures were recorded at the two highest located stations, but not at the Airport station close to sea level.
The satellite record of sea ice coverage over the West Spitsbergen Current reveals that in the period 2006–2009, annual sea ice concentrations were only 10–17% of the mean (for the period 1979–2000) (CitationTeigen et al., 2011). Particularly, late winter and spring 2006 had a longer period with the highest winter air temperatures of the studied decade (). Cottier et al. (Citation2007) captured the oceanic response to large scale atmospheric circulation patterns in winter 2006 west of Svalbard by describing, based on oceanographie observations, how switching the hydrography from an arctic- to an Atlantic-dominated system caused increased shelf water temperatures due to wind-induced coastal upwelling. They concluded that despite low regional air temperatures in February 2006 heat released over the entire shelf system prevented ice formation. Consequently, the dynamic response to wind direction potentially had a greater effect on shelf water temperatures, and thus sea ice formation particularly in the Isfjorden, than changes in air temperature (CitationCottier et al., 2007). At the same time an extremely large, high-pressure system over Russia and Eastern Europe blocked the usual pathway of low-pressure systems to Norway and into the Barents Sea, thus directing them towards the Fram Strait and the Eurasian Basin (CitationCottier et al., 2007). Rogers et al. (Citation2005) found during relatively mild winters, cyclone frequency increased over the Fram Strait area immediately west of Svalbard, bringing a warm sector over the islands, when high pressure occurred over Scandinavia and the Barents Sea, whereas relatively cold winters had increased cyclone frequency in the Barents Sea.
Isaksen et al. (Citation2007a) have quantified the warming effect occurring down to 15 m in the bedrock recorded in the Janssonhaugen mountain top borehole, associated with this 2006 sea ice minimum. The ground surface temperature was 2.3 °C above the 1999–2005 average, while the mean permafrost ground top temperature at the permafrost table was 1.8 °C above the 1999–2005 average. The active layer increased by 0.18 m. These findings represent the maximum ground thermal effect to be expected in the Svalbard landscape of such a warming, due to the exposed mountain top bedrock location of the Janssonhaugen borehole. However, in most lowlands and sedimentary parts of the Svalbard landscape the effect would have been smaller, due to larger nival and thermal offsets, as is also partly pointed out by Isaksen et al. (Citation2007a). They refer to the contemporary smaller increase in active layer thickness of only 10 cm in the nearby Endalen ice-rich, fine-grained solifluction sheet site ().
The September 2007 arctic annual minimum sea ice extent reached the previous observational record low (CitationStroeve et al., 2008). The spatial pattern of sea ice conditions for both June—August and September—November 2007 shows that most of the sea ice loss occurred along the northern Siberian and Alaskan coasts, which was also were the strongest land temperature warming occurred (CitationKumar et al., 2010). Further analyses of monthly evolving surface temperatures over the Arctic Ocean region reveal an abrupt emergence of warm conditions in September, in concert with the month of largest sea ice loss. Kumar et al. (Citation2010) found that the direct impact of the 2007 sea ice loss on the magnitude of arctic warming and its spatial extent is the principal factor responsible for arctic amplification of global warming trends. Lawrence et al. (Citation2008) found that the rapid sea ice loss in 2007 can force a strong acceleration of arctic land warming, which can trigger rapid degradation of currently warm permafrost and may increase the vulnerability of colder permafrost for subsequent degradation under continued warming. They modeled the accelerated warming signal to penetrate up to 1500 km inland, and to be apparent throughout most of the year, peaking in autumn.
Svalbard was less affected by changes in sea ice extent during 2007 than Alaska and eastern Siberia (CitationKumar et al., 2010), but sea ice extent was reduced in the period 2006–2009 compared to the 1979–2000 period (CitationTeigen et al., 2011). Mean annual air temperatures were in the middle of a decreasing period in 2007 for the analyzed stations (), and with no significant September air temperature or wind maximums. But a clear decadal lapse-rate minimum occurred in July, August, and September 2007 of, respectively, -0.95, -1.01, and -0.95 °C/100 m (). And the months January, March, June, July, August, September, October, and November 2007 had the lowest monthly lapse-rates of the investigated decade, clearly stressing the relatively warm sea level temperatures compared to higher grounds. Furthermore, TDD was at the decadal minimum for both of the higher meteorological stations, while the Airport station had the second highest decadal TDD.
PERIGLACIAL CONDITIONS DURING THE 2000–2011 DECADE AND THEIR METEOROLOGICAL CONTROL
During the International Polar Year 2008–2009 investigations of the overall thermal characteristics of different periglacial landforms were initiated in the Longyearbyen area (CitationChristiansen et al., 2010). The coldest permafrost of around -6 °C was found in the center of the Adventdalen valley and is explained primarily by significant wind-driven snow transport in combination with temperature inversions, whereas areas with accumulation of snow patches have the warmest permafrost also occurring in Adventdalen (CitationChristiansen et al., 2010). Thus the local meteorological variability plays a rather large role in controlling the permafrost ground thermal state, in combination with the geomorphology, topography, and ground lithology.
Permafrost in Svalbard is traditionally characterized as continuous (CitationHumlum et al., 2003). However, in the years without sea ice, the lowermost parts of the landscape in particular reached relatively high MAAT values, as shown for the Airport in 2005-2006, when MAAT was -1.7 °C, while the upper parts of the landscape at Gruvefjellet had MAATs of -5 °C (). This stresses that permafrost in the lower parts of the landscape is more exposed to the larger climatic amplitude of the Svalbard meteorology that exists there.
Etzelmüller et al. (2011) report a present substantial decadal warming rate at the permafrost surface (approximately 2 m depth) in the order of 0.07 °C/year, and associated active layer thickening, with indications of accelerated warming during the last decade (CitationIsaksen et al., 2007b) from the Janssonhaugen bedrock borehole next to the Janssonhaugen meteorological station, which is the only borehole with a decadal temperature record in Svalbard. Unfortunately, the Janssonhaugen meteorological record is not continuous during the investigated decade, but due to its close correlation to the Gruvefjellet meteorological station, it is likely that the maximum decadal air temperature at Janssonhaugen would have been occur- ring in 2006, as was the case for the two other meteorological stations involved in this analysis. Therefore, it would be interesting to know if an accelerating warming rate can still be observed in the permafrost at Janssonhaugen at shallow depths.
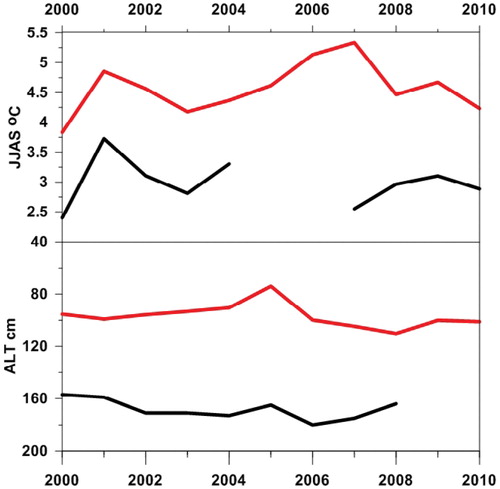
The relatively warm Svalbard permafrost leads to primarily one-sided, top-down, active layer freezing (CitationChristiansen et al., 2010), which makes the active layer especially sensitive to meteorological variations. Decadal 2000–2010 active layer thickness has been measured by summer thaw progression measurements in the 121 grid points of the Circumpolar Active Layer Monitoring (CALM) UNISCALM grid, located in the lower Adventdalen area () (CitationChristiansen and Humlum, 2008) and is also reported from the Janssonhaugen borehole CALM data. Plotting these values and the thawing season June, July, August, and September (JJAS) mean air temperature values from the Airport and Janssonhaugen stations show only little correlation (), so there are obviously also other factors (e.g. cloud cover) that control the active layer thickness as suggested by Christiansen and Humlum (Citation2008).
The interannual active layer thickness variability in the two above-mentioned Svalbard CALM sites shows only some correspondence (). Both UNISCALM and Janssonhaugen had a significant minimum in active layer thickness in summer 2005, which was after the 2004–2005 winter of a relatively low FDD (). The second thinnest UNISCALM active layer was then recorded in summer 2004, occurring when summer sea ice affected air temperatures near Isfjorden, and with a relatively low annual TDD value recorded at the Airport site (). The UNISCALM active layer was thickest in 2008, and with 2007 as the second thickest, both are in the period with minimum sea ice cover, and thus associated with warming, particularly of the UNISCALM site close to sea level. The second highest Airport TDD was in 2007, while in contrast TDD was among the smallest during the decade in 2008. The Janssonhaugen bedrock borehole had its 2000–2008 maximum in 2006, coinciding with the year with minimum sea ice cover (CitationIsaksen et al., 2007a); however, it was less affected by the summer 2004 sea ice occurrence in Isfjorden, most likely as Janssonhaugen is located further inland. Opposite to the UNISCALM site, the Janssonhaugen site had a relatively shallow thaw in summer 2008, despite the JJAS air temperature average being medium on the decadal scale, but with a relatively high FDD in the previous 2007–2008 winter ().
FIGURE 12. Thawing season June, July, August, and September (JJAS) mean air temperatures (upper part) from Airport (red) and Janssonhaugen (black), and the active layer thickness (lower part) as measured in the UNISCALM grid as an average of all the 121 grid points (red) and in the Janssonhaugen borehole (black).
During the period 2005 to 2008 in Endalen (), continuous solifluction movement was recorded in a low-angle solifluction sheet, a widespread periglacial landform on the lower slopes of the study area (CitationHarris et al., 2011). Interannual solifluction variability was found to be due to a combination of summer air temperature variation and winter snow cover duration and thickness variability. Deepest thaw (106 cm) in Endalen was recorded during the 2006 summer with the second highest summer (JJAS) air temperatures, and highest TDD at the Airport site ( and ), the meteorological station which is altitudinally closest to Endalen. The summer with the highest air temperatures in 2007 at the Airport () had a significantly shallower thaw depth (100 cm) and thus less solifluction activity, as the thaw front did not reach the transient layer, as it did in the summers of both 2006 and again in 2008 (CitationHarris et al., 2011). The airport TDD was low in summer 2007 compared to the maximum decadal value in summer 2006, but even smaller in summer 2008 (). FDD in 2005–2006 was the decadal minimum, with 2006–2007 as the second lowest, and with 2007–2008 as the fourth lowest (). Therefore, the explanation is presumably that snow thickness increased later in the 2006–2007 winter compared to the 2007–2008 winter (CitationHarris et al., 2011, see ), allowing more ground cooling in winter 2006–2007, thereby explaining the shallower thaw in summer 2007 compared to the two adjacent summers.
Thaw settlements recorded at the surface of the solifluction sheet in Endalen exceeded frost heave values in each year, and the end of summer ground surface elevation was reduced by 6.2 cm from 2005 to 2008, reflecting the thickness of ground ice lost over the period (CitationHarris et al., 2011). Clearly this 3-year period falls within the period of the highest air temperatures of the decade ( and ) during the sea ice minimum. Most likely solifluction will thus have been smaller in the early and late part of the decade, with more extensive sea ice coverage.
The most widespread ground thermal contraction cracking observed since regular field observations of cracking started in autumn 2003 in the Adventdalen ice-wedge study site (CitationChristiansen, 2005) was observed during March 2010. Widespread ground cracking was seen in a thick ice crust covering the ground. We recorded a maximum depth of more than 2 m in open cracks, clearly indicating that they extended into the permafrost, and thus that ice-wedge growth could happen. The snow cover was transformed into massive ice, which enabled enhanced ground thermal cooling, compared to a normal snow cover. This extensive transformation from snow to ice occurred due to the mid-January 2010 warm spell with large amounts of rain (CitationEckerstorfer and Christiansen, 2011c). Then extensive ground cooling occurred in February and March, when longer relatively cold stable high-pressure periods occurred. This is reflected in the smallest decadal February lapse-rate, and an average but relatively small March decadal lapse-rate, due to more extensive sea ice, leading to relatively low air temperatures in the lowlands. This happened despite FDD being relatively small (), and no extreme monthly meteorological values. So typically ice-wedge cracking seems to be more controlled by shorter-than-monthly meteorological events, rather than average monthly or even average winter temperatures, as also pointed out earlier by Christiansen (Citation2005).
Widespread wet snow avalanching occurred during January 2010 and March 2011. These events (CitationEckerstorfer and Christiansen, 2011c) do, however, not show up in the average monthly meteorological values as something extraordinary. The main meteorological cause of these events was significantly increased (by almost 400%) precipitation compared to the 1912–2010 Longyearbyen airport record.
Systematic snow avalanche monitoring around Longyearbyen from 2006 to 2009 showed clear meteorological control. Snowstorms induced by passing low-pressure systems resulted in 19 major avalanche cycles (lasting between 1 and 12 days), in which 80% of all observed avalanches released (CitationEckerstorfer and Christiansen, 2011b). Natural slab avalanches were particularly triggered by precipitation and snowdrift 24, 48, and 72 hours prior to their occurrence (CitationEckerstorfer and Christiansen, 2011d). Snowdrifting over the extensive plateau mountains accumulates cornices along the lee-facing edge (CitationEckerstorfer and Christiansen, 2011b). Accumulation wind speeds were measured to be on average 12 m/s (CitationVogel et al., 2012). Induced by air temperature fluctuations, tension cracks between the cornice mass and the snow on the plateau were observed, detaching the cornice from the ridge. This process eventually led to cornice failures, triggering avalanches on the slope below (CitationVogel et al., 2012). Such cornice-fall avalanches constitute 50% of all avalanches. Humlum et al. (Citation2007) documented how avalanche-derived rock glaciers occur in the Longyearbyen area mainly due to extensive cornice-fall avalanching. Both rock glaciers and avalanche fan sedimentation are thus primarily meteorologically controlled by wind and partly by precipitation, as wind is redistributing snow by drifting. The wind speed and direction did not undergo large changes during the studied decade compared to changes in the air temperature. Thus avalanches and avalanche-derived rock glaciers seem to represent periglacial landforms that are less sensitive to meteorological variability.
Conclusions
Our analysis of the decadal meteorological variability and how this affects periglacial processes indicates that most periglacial landforms are controlled by a combination of air temperature, snow precipitation, and wind speed and direction. Those landforms largely controlled by wind, such as avalanches and rock glaciers, are probably those that will be least susceptible to the range of decadal-scale meteorological variability documented for this last decade. Oppositely, the ice-rich ice-wedge polygons particularly are strongly controlled by winter air temperature, but also to some degree by precipitation.
As the permafrost in Svalbard is the warmest this far north in the Arctic (CitationRomanovsky et al., 2010), it is important to under stand the response of the ground thermal regime to the future climate. One-dimensional transient ground heat conduction modeling has been performed using historical surface air temperature records and potential future temperatures calculated from downscaled air temperature projections from an ensemble of general circulation models (GCMs) for the 21st century (Etzelmüller et al., 2011). This predicts a general warming of the Svalbard permafrost, and permafrost degradation near the coasts at altitudes below ca. 100 m a.s.l. in well-drained, dry bedrock sites, where taliks likely will develop (Etzelmüller et al., 2011). Our direct periglacial meteorological sensitivity analysis, however, shows that modeling the future permafrost thermal and periglacial landform responses to changing climate, by only forcing the models with air temperature represents a very simple approach, as also precipitation and wind will have to be included as forcing parameters. Such modeling, however, does not exist yet at periglacial landform scale.
With future expected climatic changes along with the characteristically large interannual meteorological variability, the Svalbard periglacial landscape has high sensitivity towards such changes. GCMs predict continued or even exponentially increased warming in the Svalbard regions (CitationFørland et al., 2009). Simulations from the IPCC multi-model data sets indicate that the increase in mean temperature will be combined with an increase in the frequency of very warm winters and summers (CitationChristensen et al., 2007). Wavelet modeling based on the entire meteorological record from the Airport station, however, suggests that the observed late 20th century warming in Svalbard is not going to continue, but that the period of warming may be followed by variable, but generally not higher temperatures for at least the next 20–25 years (CitationHumlum et al., 2011). No permafrost modeling has yet been done using the results of such wavelet-based analyses, but clearly this would generally suggest no increase in permafrost thawing in the near future. The natural cyclic variations of sea ice extent, air temperature, and precipitation also directly cause a fundamental variability in the periglacial processes, as our analytical overview here has demonstrated.
Acknowledgments
The establishment and continuous operation of the two mountain meteorological stations at Gruvefjellet and at Janssonhaugen has only been possible due to UNIS internal research funding and logistical assistance also provided by UNIS logistical and scientific staff. The upgrades of the Janssonhaugen and Gruvefjellet meteorological stations in 2006 were funded by the expansion of UNIS, when moving into the Svalbard Science Park. Both new stations were delivered by the Instrument services at As, ITAS. Stephan Claes in the UNIS technical staff is thanked for operating and performing the shift of the meteorological stations at Gruvefjellet and Janssonhaugen in cooperation with us, and both he and Heinrich Eggenfellner, head of the UNIS IT department, are thanked for developing and maintaining the UNIS online weather website. Ulrich Neumann is thanked for field assistance with maintaining the UNIS meteorological stations. Lene Kristensen and Jomar Finseth kindly assisted with establishing the Gruvefjellet new meteorological station on site. We also like to thank the two reviewers for providing useful comments.
Related Research Data
References Cited
- Benestad, R. E. , Hanssen-Bauer, I. , Skaugen, T. E. , and Førland, E. J. , 2003: Associations between the sea ice and the local climate on Svalbard. Met. no KLIMA 1–07/02, 13 pp.
- Burn, C. R. , 1997: Cryostratigraphy, paleogeography, and climate change during the early Holocene warm interval, western arctic coast, Canada. Canadian Journal of Earth Sciences , 34: 912–925.
- Christensen, J. H. , Hewitson, B. , Busuioc, A. , Chen, A. , Gao, X. , Held, I. , Jones, R. , Kolli, R. K. , Kwon, W.-T. , Laprise, R. , Magaña Rueda, V. , Mearns, V. , Menéndez, C. G. , Räisänen, J. , Rinke, A. , Sarr, A. , and Whetton, P. , 2007: Regional climate projections. In Solomon, S. , Qin, D. , Manning, M. , Chen, Z. , Marquis, M. , Averyt, K. B. , Tignor, M. , and Miller, H. L. (eds.), Climate Change 2007: the Physical Science Basis. Contribution of Working Group I to the Fourth Assessment Report of the Intergovernmental Panel on Climate Change. Cambridge and New York: Cambridge University Press, 849–940.
- Christiansen, H. H. , 2005: Thermal regime of ice-wedge cracking in Adventdalen, Svalbard. Permafrost and Periglacial Processes , 16: 87–98.
- Christiansen, H. H. , and Humlum, O. , 2008: Interannual variations in active layer thickness in Svalbard. In Kane, D. L. , and Hinkel, K. M. (eds.), Ninth International Conference on Permafrost Proceedings. Fairbanks: University of Alaska, Institute of Northern Engineering, 257–262.
- Christiansen, H. H. , Etzelmüller, B. , Isaksen, K. , Juliussen, H. , Farbrot, H. , Humlum, O. , Johansson, M. , Ingeman-Nielsen, T. , Kristensen, L. , Hjort, J. , Holmlund, P. , Sannel, A. B. K. , Sigsgaard, C.; kerman, H. J. , Foged, N. , Blikra, L. H. , Pernosky, M. A. , and Ødegrd, R. , 2010: The thermal state of permafrost in the Nordic area during the International Polar Year 2007–2009. Permafrost and Periglacial Processes, 21: 156–181.
- Cottier, F. R. , Nilsen, F. , Inall, M. E. , Gerland, S. , Tverberg, V. , and Svendsen, H. 2007: Wintertime warming of an arctic shelf in response to large-scale atmospheric circulation. Journal of Geophysical Research, 34: L10607, http://dx.doi.org/10.1029/2007GL029948 .
- Dallmann, W. K. , Kjærnet, T. , and Nøttvedt, A. , 2001 : Geological map of Svalbard, 1:100,000 Sheet C9G Adventdalen. Temakart No. 31/ 32, Norwegian Polar Institute, 4–55.
- Dickson, R. R. , Osborn, T. J. , Hurrell, J. W. , Meincke, J. , Blindheim, J. , Adlandsvik, B. , Vinje, T. , Alekseev, G. , Maslowski, W. , and Cattle, H. , 2000:. The Arctic Ocean response to the North Atlantic Oscillation. Journal of Climate , 13: 2671–2696.
- Eckerstorfer, M. , and Christiansen, H. H. , 2011a: The “high arctic maritime snow climate” in central Svalbard. Arctic, Antarctic, and Alpine Research , 43: 11–21, http://dx.doi.org/10.1657/1938-424643.1.11 .
- Eckerstorfer, M. , and Christiansen, H. H. , 2011b: Topographical and meteorological control on snow avalanching in the Longyearbyen area, central Svalbard 2006–2009. Geomorphology , 134: 186–196.
- Eckerstorfer, M. , and Christiansen, H. H. , 2011c: Meteorology, topography and snowpack conditions causing extreme mid-winter slush and wet slab avalanches in High Arctic maritime Svalbard. Permafrost and Periglacial Processes , 23: 15–25, http://dx.doi.org/ 10.1002/ppp.734 .
- Eckerstorfer, M. , and Christiansen, H. H. , 2011d: Relating meteorological variables to the natural slab avalanche regime in high arctic Svalbard. Cold Regions Science and Technology , 69: 184–193, http://dx.doi.Org/10.1016/j.coldregions.2011.08.008 .
- Etzelmüller, B. , Schuler, T. V. , Isaksen, K. , Christiansen, H. H. , Farbrot, H. , and Benestad ., 2011: Modelling the temperature evolution of Svalbard permafrost during the 20th and 21st century. The Cryosphere, 5: 1–13, http://www.the-cryosphere.net/5/1/2011/, http://dx.doi.org/10.5194/tc-5-1-2011 .
- Førland, E. J. , Hanssen-Bauer, I. and Nordli, P. Ø. , 1997: Climate statistics and longterm series of temperature and precipitation at Svalbard and Jan Mayen. Met.no KLIMA , 65 pp.
- Førland, E. J. , Benestad, R. E. , Flatøy, F. , Hanssen-Bauer, I. , Haugen. J. E. , Isaksen, K. , Sorteberg, A. , and Aadlandsvik, B. , 2009: Climate development in north Norway and the Svalbard region during 1900–2100. Tromsø: Norwegian Polar Institute, 44 pp.
- Hanssen-Bauer, I. , Kristensen Solås, M. , and Steffensen, E. L. , 1990: The climate of Spitsbergen. DNMI-Rapport, Klima , 39: 40 pp.
- Harris, C. , Kern-Luetschg, M. , Christiansen, H. H. , and Smith, F. , 2011 : The role of interannual climate variability in controlling solifluction processes, Endalen, Svalbard. Permafrost and Periglacial Processes , 22: 239–253, http://dx.doi.org/10.1002/ppp.727 .
- Humlum, O. , 2002: Modelling late 20th-century precipitation in Nordenskiöld Land, Svalbard, by geomorphic means. Norwegian Journal of Geography , 56: 96–103.
- Humlum, O. , Instanes, A. , and Sollid, J. L. , 2003: Permafrost in Svalbard: a review of research history, climatic background and engineering challenges. Polar Research , 22: 191–215.
- Humlum, O. , Christiansen, H. H. , and Juliussen, H. , 2007: Avalanche-derived rock glaciers in Svalbard. Permafrost and Periglacial Processes , 18: 75–88.
- Humlum, O. , Solheim, J. E. , and Stordahl, K. , 2011: Identifying natural contributions to late Holocene climate change. Global and Planetary Change, 79: 145–156.
- Isaksen, K. , Benestad, R. E. , Harris, C. , and Sollid, J. L. , 2007a: Recent extreme near-surface permafrost temperatures on Svalbard in relation to future climate scenarios. Geophysical Research Letters, 34: L17502, http://dx.doi.org/10.1029/2007GL031002 .
- Isaksen, K. , Sollid, J. L. , Holmlund, P. , and Harris, C. , 2007b: Recent warming of mountain permafrost in Svalbard and Scandinavia, Journal of Geophysical Research—Earth, 112(F2): F02S04, http://dx.doi.org/10.1029/2006JF000522 .
- Kottek, M. , Grieser, J. , Beck, C. , Rudolf, B. , and Rubel, F. , 2006: World Map of the Köppen-Geiger climate classification updated. Meteorologische Zeitschrift , 15: 259–263.
- Kumar, A. , Perlwitz, J. , Eischeid, J. , Quan, X. , Xu, T. , Zhang, T. , Hoerling, M. , Jha, B. , and Wang, W. , 2010: Contribution of sea ice loss to arctic amplification. Geophysical Research Letters, 37: L21701, http://dx.doi.org/10.1029/2010GL045022 .
- Lawrence, D. M. , Slater, A. G. , Tomas, R. A. , Holland, M. M. , and Deser, C. , 2008: Accelerated arctic land warming and permafrost degradation during rapid sea ice loss. Geophysical Research Letters, 35: L11506, http://dx.doi.org/10.1029/2008GL033985 .
- Nordli, P. Ø. , Hanssen-Bauer, I. , and Førland, E. , 1996: Homogeneity analyses of temperature and precipitation series from Svalbard and Jan Mayen. The Norwegian Meteorological Institute, Technical Report 16/96.
- Norwegian Meteorological Institute , 2010: Met.no. eklima. Free access to weather-and climate data from historical data to real time observations. <http://www.eklima.no>, accessed October 2011.
- Rogers, J .C. , Yang, L. , and Li, L. , 2005: The role of Fram Strait winter cyclones on sea ice flux and on Spitsbergen air temperatures. Geophysical Research Letters, 32: L06709, http://dx.doi.org/10.1029/2004GL022262 .
- Romanovsky, V. E. , and Osterkamp, T. E. , 1995: Interannual variations of the thermal regime of the active layer and near-surface permafrost in northern Alaska. Permafrost and Periglacial Processes , 6: 313–335.
- Romanovsky, V. E. , Smith, S. L. , and Christiansen, H. H. , 2010: Permafrost thermal state in the polar northern hemisphere during the International Polar Year 2007–2009: a synthesis. Permafrost and Periglacial Processes , 21: 106–116.
- Sollid, J. L. , Holmlund, P. , Isaksen, K. , and Harris, C. , 2003: Deep permafrost boreholes in western Svalbard, northern Sweden and southern Norway. Norwegian Geographical Journal, 54: 186–191.
- Stroeve, J. , Serreze, M. , Drobot, S. , Gearheard, S. , Holland, M. , Maslanik, J. , Meier, W. , and Scambos, T. , 2008: Arctic sea ice plummets in 2007. Eos Transactions of the American Geophysical Union , 89(2): http://dx.doi.org/10.1029/2008EO020001 .
- Teigen, S. H. , Nilsen, F. , and Skogseth, R. , 2011: Heat exchange in the sea west of Svalbard. Manuscript, Paper IV in CitationTeigen, S. H., 2011 : Water mass exchange in the sea west of Svalbard. Ph.D. thesis, Department of Geophysics, University of Bergen, Bergen, Norway, 172 pp.
- Vogel, S. , Eckerstorfer, M. , and Christiansen, H. H. , 2012: Cornice dynamics and meteorological control at Gruvefjellet, central Svalbard. The Cryosphere, 6: 157–171.