
Abstract
Hurricanes are intense, frequent disturbances of Caribbean ecosystems and are important agents in structuring the region’s ecological patterns and processes. The rugged topography and diverse vegetation of Caribbean tropical montane forests interact with hurricane forces to create complex disturbance patterns. In this study, we used a 158-yr historical database of hurricane tracks to calculate fine-scale hurricane return intervals across the Caribbean, and Landsat imagery and field inventory to reconstruct wind and rain disturbance from Hurricane Georges in the Cordillera Central, Dominican Republic. Spatial patterns of disturbance from Georges and the relationship of disturbance with hurricane meteorology, topography, and vegetation were analyzed for the landscape. The long-term hurricane return interval for the Cordillera Central was 14.4 yrs. Damage from hurricane Georges was distributed over a small portion of the study area (∼330 km2 study area); only 11.3% of the study area was disturbed by wind and 4.3% by flooding. Multiple logistic regression showed that hurricane meteorology, topography, and vegetation were all significant predictors of patterns of wind disturbance. In particular, wind disturbance was concentrated in high-elevation forest types, with 12% of the total disturbed area in cloud forest and 82% in pine forest. Within the wind-disturbed areas, the degree of mortality varied markedly by forest type, with the proportion of dead basal area 9.8% higher in cloud forest, 11.4% higher in transitional pine, and 50.5% higher in pine forest compared to controls. Although much of the landscape was undisturbed by Georges, the regularity of hurricanes in the region and the magnitude of change in disturbed patches suggest that hurricanes are an important driver of forest dynamics and demonstrates the importance of sampling across gradients of disturbance severity.
Introduction
Disturbances play a central role in the dynamics of forested landscapes. Disturbance ecology requires an appreciation of the causes and consequences of the spatial heterogeneity inherent in disturbance impacts (CitationSousa, 1984; CitationWhite and Pickett, 1985), especially the relationships of disturbance patterns with geography, topography, environmental, and community gradients (CitationWhite and Pickett, 1985). The spatial patterns of disturbance—including the number, size, and shape of disturbed patches—can then affect the magnitude of change, the species composition, and the mode and rates of recovery within patches across forested landscapes (CitationRunkle, 1985).
Hurricanes are notably large and intense disturbances, capable of impacting vast areas of forested landscapes, yet their impacts are typically patchy, producing gradients of damage and mortality at landscape scales. Hurricane impacts are typically patchy due to the inherent variability of a storm's wind speed and wind direction (CitationBoose et al., 1994; CitationTurton, 2008), and because hurricane winds interact with the abiotic and biotic features of affected landscapes (CitationBoose et al., 1994; CitationEverham and Brokaw, 1996). Topography determines patterns of exposure to wind (CitationBellingham, 1991; CitationBoose et al., 1994), while soils and geomorphology affect windthrow susceptibility (CitationEverham and Brokaw, 1996) and landslide distribution (CitationScatena and Larsen, 1991). Biotic attributes of landscapes also contribute to the patterns of hurricane impacts (CitationEverham and Brokaw, 1996), especially tree species' characteristics, such as size (CitationWalker, 1991) and wood density (CitationZimmerman et al., 1994), and stand attributes, such as species composition (CitationZimmerman et al., 1994; CitationCanham et al., 2010), diversity (CitationTanner and Bellingham, 2006), and structure (CitationBrokaw and Grear, 1991).
Hurricanes occur frequently in the Caribbean, and a rich literature exists on hurricane-related research in the region, yet there is little work describing the spatial and temporal components of hurricane regimes at landscape scales (see CitationBoose et al., 1994, Citation2004). Specifically, we need more information on the area disturbed by individual hurricanes and return intervals for affected landscapes to more fully incorporate the extensive work describing hurricane impacts on forests (CitationBrokaw and Walker, 1991; CitationTanner et al., 1991) and their recovery (CitationZimmerman et al., 1996) into our understanding of landscape patterns and dynamics. Stand-level studies, particularly remeasurement of pre-event plots, provide important information on the mechanisms of forest recovery, but the size, number, and location of these plots may be inadequate for describing the distribution of disturbance on the landscape. In Puerto Rico following Hurricane Hugo, for example, tree mortality was only 7% in plots at El Verde, while mortality was as high as 50% in forests nearby (CitationWalker, 1991). Remote sensing analyses of recent hurricanes (e.g., CitationLee et al., 2008; CitationBianchette et al., 2009; CitationWang and Xu, 2010; CitationWang et al., 2010) have demonstrated the utility of remote sensing for describing hurricane impacts on forests at landscape-scales. Remote sensing can facilitate targeted field sampling across the range of hurricane severities.
In the Dominican Republic, the Cordillera Central mountain range is home to a large area of protected tropical montane forest (TMF) frequently affected by hurricanes, yet little is known about hurricane impacts in this region. At about 2100 m elevation, a discrete ecotone occurs consistently across the landscape between cloud forest and monodominant pine forest of the endemic Pinus occidentalis with pronounced differences in forest structure, diversity, and adaptations to disturbance between adjacent communities (CitationSherman et al., 2005; CitationMartin et al., 2007). Species-specific responses to wind in the Cordillera Central (CitationSherman et al., 2005) suggest that hurricanes influence the landscape's forest dynamics (CitationMartin et al., 2011). In particular, hurricanes may select against pines along the ecotone causing upward shifts in cloud forest distribution (CitationMartin et al., 2007). In 1998, Hurricane Georges hit the study site, causing substantial disturbance across the landscape (CitationSherman et al., 2005), presenting the opportunity to increase our knowledge of hurricane patterns and effects on the forests of the region.
Characteristics of cloud forest and pine forest should translate to different susceptibilities and responses to hurricanes, influencing disturbance distribution and forest dynamics. Hurricane-related research in high-elevation cloud forests is scarce, but in the cloud forests of the Luquillo Mountains stem densities were 21% lower after Hurricane Hugo compared to lower elevation forests (CitationBrokaw and Grear, 1991; CitationWeaver, 1999). At low elevations, the susceptibility of tropical pines and broadleaf forest to hurricanes also is known to be very different; following Hurricane Joan in lowland Nicaragua, Boucher et al. (Citation1990) found 58% mortality in stands of Pinus caribaea compared with only 13% for broadleaf forest. Such patterns have important implications for the extensive pine forests of Hispaniola, where recovery from hurricane disturbance may be slow as Pinus occidentalis cannot resprout, unlike most cloud forest tree species in the Caribbean (CitationBellingham et al., 1994; CitationZimmerman et al., 1994). Dominican Republic cloud forests are also compositionally and structurally far more diverse than pine forests (CitationSherman et al., 2005), providing heterogeneity in pre-hurricane damage susceptibility and post-hurricane recovery potential.
In this study, we report the landscape-level impacts of Hurricane Georges on the TMFs of the Cordillera Central, including remotely sensed measures of its disturbed area, its spatial patterns and relationship with landscape factors, and field surveys of its effects on vegetation. To place the Cordillera Central in a broader context, we also reconstructed fine-scale hurricane return intervals for the Greater Antilles using historical hurricane track and size data. We expected that the complex topography and contrasting vegetation types should together result in pronounced spatial patterning of the disturbance across the landscape. We expected that pine forest would be more susceptible and less resilient to wind disturbance because of its tall growth habit, low wood density, inability to resprout, and comparatively open stand structure, while cloud forest—with shorter stems and a dense, complex stand structure—would be less susceptible and show faster recovery to hurricane wind damage.
Methods
STUDY AREA
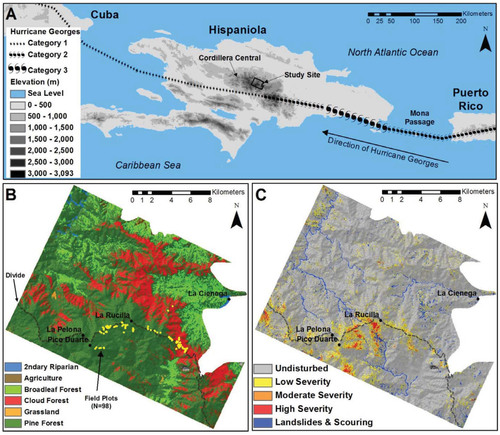
The Cordillera Central mountain range is located in the center of Hispaniola. The study area (, part A) encompassed ∼330 km2 within two national parks (Parques Bermúdez and Ramírez), ranging in elevation from 1100 to >3000 m, and spanning the windward (northeastern) and leeward (southwestern) slopes of the central massif. The topography is rugged, with steep and sharply dissected slopes. See Sherman et al. (Citation2005) for a detailed site description.
The last major storm to hit the Cordillera Central was Hurricane Georges, which made landfall on 22 September 1998 as a category (cat) 3 hurricane. As it moved across Hispaniola, it was forced up in elevation over the Cordillera Central, weakening to a cat 2 and then cat 1 storm as its eye passed just 15 km south of the study site (, part ). Satellite estimates suggest up to 991 mm of precipitation fell over parts of Hispaniola in 24 hrs (CitationGuiney, 1999), causing flash floods and landslides, and washing out roads and bridges downstream of the study area (CitationMartin et al., 2004).
LAND COVER CLASSIFICATION
A high-resolution vegetation-land cover map was created from pre-hurricane Landsat 5 TM imagery (dated 2 September 1998) and an ASTER Digital Elevation Model (DEM) (CitationERSDAC, 2009). The Landsat imagery was prepared for modeling by transforming the spectral bands (1–5, 7) into principal components (PCs) using ENVI 4.8 (ITT VIS, Inc.) to reduce correlation among predictor variables and to separate topographic shadowing (which fell into PC 1), and by deriving the Normalized Difference Vegetation Index (NDVI). Slope and aspect (eastness and northness) were calculated from the DEM using ArcGIS 9.3 (ESRI, Inc.). Modeled land cover classes included pine forest, secondary riparian forest, lower montane broadleaf forest, cloud forest, grassland, and agriculture, following the plant associations of Sherman et al. (Citation2005), except that here pine and pine-broadleaf associations were combined into a single pine class due to the similar spectral properties of these classes. Training (n = 350) and testing (n = 173) points came from previously established permanent plots (n = 140; CitationSherman et al., 2005), pine and cloud forest field plots placed as part of this study (n = 75), and photo-interpreted points (n = 308) from a color infrared orthomosaic (hereafter orthomosaic) made from post-hurricane 1:24,000 scale aerial photos (dated April 1999; GPS Aerial Services, Inc.).
Land cover was classified from predictor variables (PC2, PC3, NDVI, elevation, slope, eastness, and northness) using Random Forests, a statistical classifier algorithm that leverages the power of many decision trees to model complex relationships (CitationBreiman, 2001). Random Forests uses bagging and/or bootstrap aggregating to form an ensemble of classification and regression trees with minimal correlation between the classifiers; its use is well established in remote sensing with proven improvements in classification accuracy (e.g., CitationCutler et al., 2007).
QUANTIFYING HURRICANE GEORGES DISTURBANCE
Wind disturbance from Hurricane Georges was quantified using Landsat-based change detection via simple image differencing of post- minus pre-hurricane normalized difference infrared index (NDII). The same Landsat 5 TM scene used in the land cover classification (dated 2 September 1998) was selected as the pre-hurricane image due to its high quality, cloud-free coverage, and close temporal proximity to the hurricane. No single post-hurricane scene within a year after the storm had complete cloud-free coverage, but Landsat 5 TM scenes from 16 May, 1 June, and 19 July, 1999, contained high-quality, complementary cloud-free coverage and were used to create a single post-hurricane composite image. Landsat scenes were acquired with L1T correction (CitationUSGS, 2009) providing adequate spatial alignment. Radiometric correction via dark object subtraction was used to reduce atmospheric effects on a per-band basis for all four scenes (CitationSong et al., 2001). To further reduce spectral variation in the post-hurricane images, the 16 May and 1 June images were normalized to the 17 July image (as the most cloud-free) using a histogram matching procedure per Helmer and Ruefenacht (Citation2005).
Two recent studies (CitationWang and Xu, 2010; CitationWang et al., 2010) compared vegetation indices and change detection methods for detecting hurricane disturbance in forested landscapes and concluded that NDII was an accurate and sensitive measure of disturbance. Here, we classified the NDII change detection, defining disturbance as a decrease in NDII of greater than one standard deviation (0.065 NDII), further stratified into low (-0.065 to -0.130), moderate (-0.130 to -0.195), and high (-0.195 to min) severities.
The accuracy of the NDII change detection was assessed using the orthomosaic, as disturbed forest (defined as having at least 25% canopy loss) was readily visible from undisturbed forest in the orthomosaic. Random points were generated within disturbed (n = 75) and undisturbed (n = 75) cloud forest and pine forest (totaling 300 test points). Disturbance was interpreted from the orthomosaic within the extent of each Landsat pixel containing a test point. Detection accuracy was compared using overall accuracies, the errors of omission, and the errors of commission.
To highlight differences between wind and flooding disturbance, scouring and landslides were mapped separately. Random Forests was used to classify stream scouring and landslides from predictor variables including the spectral bands of the post-hurricane Landsat composite and derived indices (NDVI, NDII, tasseled cap brightness, greenness, and wetness, PCs 1–3), and change detection using NDVI and tasseled cap greenness. Training (n = 515) and testing (n = 258) data points came from the land cover classification training and testing points (described above) and from interpretation of the orthomosaic and post-hurricane Landsat composite for stream scouring and landslides.
FIELD SAMPLING
Field sampling conducted in March through July 2010 was used to quantify hurricane wind effects on forests >1800 m elevation, which contained 94.1% of the wind disturbed area. This sampling included: (1) cloud forest (1550–2200 m) distributed on the windward slopes, (2) pine forest (1460–3098 m) distributed at the highest elevations and on leeward slopes, and (3) transitional pine (a sub-association of pine forest, CitationSherman et al., 2005), which supports a pine overstory and a cloud forest subcanopy on the windward slopes above the cloud forest-pine ecotone on elevations spanning 2100–2500 m (CitationMartin et al., 2007).
The change detection map was used to locate plots in wind-disturbed and undisturbed (controls) areas with 29 cloud forest (16 disturbed, 13 undisturbed), 19 transitional pine (13 disturbed, 6 undisturbed), and 50 pine forest plots (21 high, 6 moderate, and 9 low severity disturbed, 14 undisturbed). Sampling targeted continuous patches of disturbance at least 8100 m2 to avoid sampling along the edge of a patch. In cloud forest and transitional pine, no areas of moderate or high severity disturbance were large enough to sample using this criterion, so their disturbance severity classes were combined into a single disturbed class for field sampling. Plots were rectangular and a variable plot size was used: 10 × 20 m for cloud forest, 15 × 30 m for pine forest, and 10 × 20 m or 15 × 30 m for transitional pine forest depending on the vegetation density.
All live and dead stems ≥4 cm diameter at breast height (DBH) were identified to species (or occasionally genus), tallied, and measured for DBH. Damage was classified for live and dead trees. Live trees were classified as follows: (1) undamaged, (2) crown damaged, or (3) tipped. Crown damage was classified by incomplete crowns with clear signs of physical trauma, such as broken branches. Stems tilting 40° or more from vertical were classified as tipped. Dead trees were classified as: (1) standing dead, (2) tipped, (3) downed dead, (4) uprooted, or (5) snapped. Downed dead were horizontal stems without clear evidence of how they died. Uprooted were windthrown stems with exposed roots, which ensures mortality, as many tipped-but-not-uprooted stems survive, especially in the cloud forest. As no storm has hit the area since 1998, differences in live, damaged, and dead basal were interpreted as the effects of Hurricane Georges. A fire burned through a portion of the site in 2005, most of which was a low-severity surface fire (CitationSherman et al., 2008)—hurricane plots were not placed in the few areas of high severity burn that occurred in our study area, as interpretation of overstory mortality would be difficult in these areas. Differences were analyzed by forest type (cloud forest, transitional pine, pine forest) and disturbance (disturbed versus undisturbed) with an interaction term using two-way ANOVA in R (CitationR Development Core Team, 2009). For pine forest, one-way ANOVA in R was used to test for differences across disturbance severities.
SPATIAL PATTERNS AND DISTURBANCE DRIVERS
Patterns of disturbance were analyzed using FRAGSTATS 3.3 (CitationMcGarigal et al., 2002), with patches defined as contiguous areas of the same disturbance type and/or severity level. Statistics were calculated for the entire landscape, the cloud forest individually, and the pine forest individually.
Multiple logistic regression was used to model the association between wind disturbance and the physical aspects of the hurricane, landforms, and land cover using the GLM function in R (CitationR Development Core Team, 2009). Three variables were included to describe physical aspects of the hurricane, including distance from the track of Hurricane Georges (Euclidean distance in km), side of the divide (south = 1, north = 0), and exposure to hurricane winds (calculated with EXPOS, which models topographic exposure to wind; CitationBoose et al., 1994), as patterns of wind disturbance in mountainous terrain can be largely driven by topography. Topographic exposure to hurricane winds was represented by a composite of the EXPOS rasters found to have high association with wind disturbance (Cole's Coefficients > 0.10). Terrain position index (CitationMajka et al., 2007) was used to categorize landforms as valley bottoms, gentle slopes, steep slopes, or ridgetops. Elevation, slope, and aspect were excluded from the model because of high correlation with other variables. No variables included in the final model had Spearman's rho > 0.6. The model was constructed with a random sample of half the forested pixels not disturbed by water (n = 173,637).
HURRICANE REGIME DESCRIPTION
There is little research on Caribbean-wide hurricane frequencies or return intervals, and what exists is presented at the scale of whole islands (CitationWeaver, 1986; CitationTanner et al., 1991; CitationWalker et al., 1991; CitationBoose et al., 1994) with few landscape-specific figures (CitationBellingham et al., 1992) or analysis of within-island variability (CitationBoose et al., 2004). These methods lack standardization, including the area of analysis and the areal estimate of hurricane impacts, complicating comparisons among sites. Furthermore, these “object-based” measures tend to strongly overstate frequency, counting hurricanes that intersect even a small portion of an island or area. Including the areal extent of each hurricane in a period of analysis is essential for more realistic calculations of return intervals and rotation periods.
We developed an alternative approach to analyze patterns of hurricane return intervals across the Greater Antilles. This approach uses hurricane tracks and category-specific radii from the extended best track data set (EBTD) of hurricanes to calculate fine-scale hurricane strikes for all raster cells (90 × 90 m) across the Greater Antilles, which facilitates analysis of within-site variability, accounts for the area affected by storms, and allows for consistent calculations across scales. Storm track data came from the HURDAT best track data set from 1851 to 2009, acquired as a polyline shapefile (CitationNOAA, 2009). Category-specific hurricane radii were calculated from EBTD data provided by the Cooperative Institute for Research in the Atmosphere (http://www.cira.colostate.edu/), which includes hurricane wind field data from the periods 1851–1987 (based on climatologies; see CitationKnaff et al., 2007) and 1988–2009 (based on observations; see CitationDemuth et al., 2006). The EBTD contains missing values, so the analysis was limited to storm points of hurricane intensity with at least one non-zero 119 kph wind speed radii, the wind speed threshold of a hurricane. The radius of the hurricane at a given point was considered the average of all non-zero 119 kph wind speed radii in the four quadrants. There were 14,062 observations meeting the criteria for inclusion. With these data, we buffered each 6 hr line segment by the appropriate category-specific mean radius, and then hurricane strikes by category were tallied for each 90 × 90 m cell for the Greater Antilles (approximately 17.5°–23.5°N and 64.5°–85.5°W).
Results
LAND COVER CLASSIFICATION
The majority of the study site (69.4%) was pine forest, followed by cloud forest (17.0%), lower montane broadleaf forest (12.1%), agriculture (0.8%), secondary riparian forest (0.6%), and grassland (0.2%) cover types (, part B). The overall classification accuracy was 89.6% and producer's and user's accuracies were >80% for pine forest and cloud forest.
FIGURE 1. (A) Track of Hurricane Georges across Hispaniola (CitationNOAA, 2009), (B) land cover of the site and locations of hurricane-recovery field plots collected in 2010, and (C) composite disturbance map of the site showing wind damage severity as well as landslides and stream scouring.
COMPOSITE CLASSIFIED DISTURBANCE MAP
The final disturbance map is a composite of wind disturbance, scouring, and landslides (, part C). Precedence in the composite was given to the scouring and landslide class, since most was also captured by the NDII change detection. In composite, 11.3% of the landscape was disturbed by wind—with 8.7%, 2.0%, and 0.6% respectively in low, moderate, and high severity classes—while 4.3% of the landscape was disturbed by water.
The NDII change detection had an overall classification accuracy of 81.7% and an overall kappa statistic of 0.633, which are similar to values reported by Wang and Xu (Citation2010). NDII change detection had similar classification accuracies for both cloud forest (79.3%) and pine forest (84.0%), with similar errors of commission (cloud forest = 21.3%, pine forest = 18.7%), and slightly higher errors of omission for cloud forest (20.0%) than for pine forest (13.3%). Overall accuracy of the scouring and landslide classification was 95.3%, and the modeled scouring closely matches the site's stream network.
EFFECTS ON FORESTS
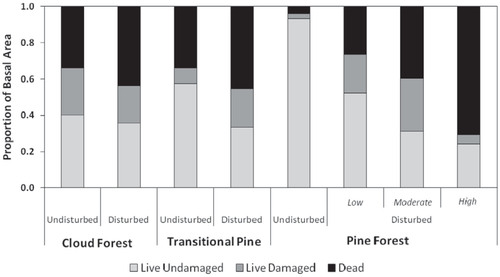
Patterns of wind disturbance were strongly associated with forest type. Due to pre-hurricane differences in stand structure, wind effects were analyzed using proportions of dead basal area (BA) (). The proportion of dead BA was significantly higher in hurricane-disturbed plots than undisturbed controls (two-way ANOVA, Prop_Dead_BA ∼ F_type * Disturbance, Disturbance df = 1, p-value < 0.0001), with a significant interaction term (F_type:Disturbance df = 2, p-value = 0.0006). Post hoc comparisons show the effect significant for pine forest (t-test, p-value < 0.0001), but not for cloud forest (p-value = 0.15) or transitional pine (p-value = 0.46). Effects on pine forest were the most severe, averaging 54.5% (±4.4% SE) dead BA in the disturbed vs. 4.0% (±1.6% SE) in control plots, compared to 45.3% (±8.1% SE) vs. 33.9% (±12.3% SE) for transitional pine, and 43.7% (±5.1% SE) vs. 34.0% (±4.2% SE) for cloud forest. For pine forest, significant differences in proportions of dead BA were also found between hurricane severities (one-way ANOVA, Prop_Dead_BA ∼ Severity, df = 3, p-value < 0.0001). Stand-level mortality rates were relatively high in this study, despite the low total disturbed area. The low mortality reported from field assessments for other hurricane-disturbed Caribbean forests (e.g. 3%–13%; CitationTanner et al., 1991) may be due in part to the reliance on plots placed before the hurricane, which do not encompass severely disturbed portions of the landscape.
FIGURE 2. Hurricane effects across forest type and disturbance severity. Overall, the proportion of dead basal area (BA) was significantly higher in hurricane disturbed plots than undisturbed controls (p-value < 0.0001), with post-hoc comparisons showing the effect significant only for pine forest (p-value < 0.0001), but not for cloud forest (p-value = 0.15) or transitional pine (p-value = 0.46). Within pine forest, significant differences were also found between all three hurricane severities (p-value < 0.0001).
The type of damage to stems also varied across forest types. Uprooting was the most common damage in pine forest: on average 33.0% of the BA in disturbed plots was uprooted vs. 1.0% in controls, compared to 10.8% vs. 2.7% in transitional pine, and only 1.0% vs. 0.0% in cloud forest. In pine forest, snapped stems also accounted for 19.8% of BA in disturbed vs. 2.9% in controls. In cloud forest, most disturbed BA came in the form of downed dead (14.2% disturbed; 6.3% control), and live and dead tipped stems (17.8% disturbed; 12.9% control). Recovery in the cloud forest over the years since Hurricane Georges probably obscured many minor injuries.
SPATIAL PATTERNS
The spatial patterns of hurricane disturbance varied by disturbance type, disturbance severity, and forest type. The total area, number of patches, and patch density all declined from low to high severity (). There were differences in the spatial patterns between the cloud and pine forests. A greater percentage of the landscape was disturbed by wind in pine forest (3045 ha; 13.3%) than cloud forest (439 ha; 7.8%), but the patch density for cloud forest was ∼50% higher than pine forest, indicating that wind-disturbed cloud forest is distributed in many small patches. The mean patch area of wind-disturbed pine forest (0.57 ha) was twice as large as cloud forest (0.22 ha). Pine forest also contained ∼70 times more total core area than cloud forest, and there was no core area for cloud forest in the moderate and high severity. There were a total of 30 patches of disturbed pine forest (0.4% of all patches) bigger than the largest patch of disturbed cloud forest, and these 30 patches accounted for 38.1% of total wind-disturbed area.
DISTURBANCE DRIVERS
Hurricane meteorology, landforms, and land cover were all significant predictors of the distribution of wind disturbance on the landscape (). Association between wind disturbance and predicted exposure (EXPOS) varied by wind direction with high associations with wind directions from 130° to 170° with a peak at 140°. The lowest association was for directions 30°–60°. Areas south of the divide (odds ratio = 1.68) and/or with predicted exposure to hurricane winds (odds ratio = 1.96) were far more likely to be disturbed. Additionally, odds decreased with distance from the hurricane. Wind disturbance was influenced by landforms (Wald Test, p-value < 0.0001) with canyon bottoms and flat-gentle slopes having higher odds of disturbance than steep slopes and ridgetops. Land cover also significantly influenced disturbance odds (Wald Test, p-value < 0.0001): broadleaf forest had the lowest odds of disturbance, while the two high elevation forest types—cloud forest (odds ratio = 1.51) and pine forest (odds ratio = 2.11)—were the most likely to be disturbed by wind. Pine forest odds of wind disturbance were significantly higher than cloud forest (Wald Test, p-value < 0.0001).
TABLE 1 Spatial patterns of wind and water disturbance. Areas are in hectares.
TABLE 2 Logistic regression of disturbance drivers.
HURRICANE DISTURBANCE REGIME
Mean hurricane radii correspond consistently to storm category: cat 1 = 74.8 km, cat 2 = 95.3 km, and cat 3–5 = 109.8 km (ANOVA, df = 2, P < 0.0001). There was considerable variability in the locations of hurricane strikes, and therefore return intervals, across the Greater Antilles and within individual islands (), especially for the larger islands of Cuba and Hispaniola. Overall, western Cuba was the most frequently impacted in the Greater Antilles. The lowest areas of hurricane activity were the northern half of Hispaniola and the northern part of eastern Cuba, which both fall on the leeward side of high mountain ranges relative to the typical Caribbean hurricane path (southeast to northwest).
From 1851 to 2009, the Greater Antilles were struck by 152 hurricanes (1-yr return interval), but the most that any one cell (0.81 ha) was struck was 34 times (4.6-yr return interval in the far west of Cuba). The average for the entire Greater Antilles yields a mean of 15.7 hurricane strikes per cell (), with a corresponding return interval of 10.0 yr. This lengthens to 11.3 yr for Hispaniola and to 14.4 yr for the Cordillera Central study site (c. 330 km2). Hispaniola, and the Cordillera Central in particular, were less frequently impacted than the Greater Antilles overall, and the study site's return interval was notably longer than the average return intervals for Puerto Rico (8.9 yr) and Jamaica (8.5 yr).
Discussion
Despite the volume of Caribbean hurricane research, few studies have reported on the spatial patterns and drivers of hurricane impacts on forests, especially at high elevations. Here, we found that disturbance from Hurricane Georges differed greatly in its distribution across the landscape, its spatial patterns, its association with landscape factors, and its effects on vegetation.
Hurricane Georges disturbed only 15.6% of the study site, 11.3% by wind and 4.3% by flooding. Compared to Hurricane Hugo in the Luquillo Mountains, Puerto Rico (48% of the landscape disturbed with >10% windthrow; CitationBoose et al., 1994) or Hurricane Gilbert's effects on the Blue Mountains, Jamaica (30% severe and 30% moderate damage; CitationBellingham et al., 1992), the area of wind disturbance in the Cordillera Central was low. Part of this difference may be due to both the conservative threshold used in the remote-sensing change detection and the 10-month interval between the hurricane and the post-event imagery, which may have allowed for some recovery in cloud forest. Still, Hurricanes Hugo and Gilbert were higher intensity, hitting the Luquillo Mountains (only 8 km from the coast) and the Blue Mountains (only 10 km from the coast) as cat 3 hurricanes, compared to Georges, which hit the inland area of the Cordillera Central mostly as a cat 1 hurricane. Hurricane David hit our study site as a cat 3 hurricane in 1979, possibly providing a more equal comparison to Hugo and Gilbert, but the impacts were poorly documented at the time and the legacies difficult to interpret in the present day. Also, the path of Georges was south of the main divide, which protected the north half of the study site where only 6.9% of area was wind disturbed, compared to 20.3% of the area south of the divide. Our return interval work (, ) shows that this pattern is typical for this and similar sites, as storms tend to remain south of the main divide and weaken as they move inland and upward into high mountain ranges in Hispaniola and Cuba.
The impacts of hurricane winds on Caribbean TMFs have been extensively studied, yet hurricane-derived floods receive scant attention (CitationLugo, 2008), especially at landscape scales (CitationGuariguata, 1990; CitationScatena and Lugo, 1995). Here, flooding disturbed 4.3% of the total landscape and accounted for roughly a quarter of the total disturbed area. In very different systems, remote sensing studies in the U.S. Gulf Coast (CitationWang and Xu, 2009) and northern Australia (CitationStaben and Evans, 2008) found that much of the hurricane/cyclone disturbance in their landscapes was associated with bottomland, riparian, and seasonally inundated forests, possibly driven by saltwater inundation instead of wind. The motivation for separating flooding disturbance in this study was to produce a more meaningful model of the landscape drivers of wind disturbance, given that flooding interacts with different properties of landscapes, creating unique spatial patterns and initiating qualitatively different forest dynamics (CitationWalker, 1994; CitationWalker et al., 1996).
FIGURE 3. Hurricane return intervals of the Greater Antilles based on a complete record of hurricane track and size data from 1851–2009 (CitationNOAA, 2009). Hurricane tracks were buffered by category-specific radii (derived from CIRA EBTD at http://www.cira.colostate.edu/) and then strikes were recorded for 90 × 90 m cells for a grid covering the Greater Antilles.
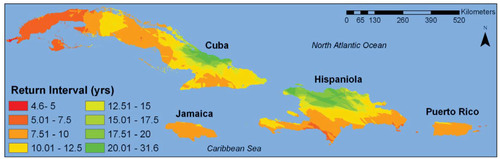
TABLE 3 Hurricane strikes and return intervals based on hurricanes from 1851 to 2009 comparing object-based and area-weighted calculations.
Variables related to hurricane meteorology, landform, and land cover were all important predictors of wind disturbance. In particular, disturbance was strongly associated with the area south of the divide and areas with predicted exposure to wind in EXPOS. Overall, the maximum association between predicted exposure in EXPOS and actual wind disturbance in this study was 0.12. Association values were stronger (max of 0.29) for high-severity wind disturbance, but these association values are generally lower than reported by Boose et al. (Citation1994) for the Luquillo Mountains, likely due to the weaker winds of Hurricane Georges, and the low wind disturbance in the northern half of the study area where the >3000 m divide influenced wind patterns beyond the shadowing modeled in EXPOS. After accounting for meteorology and landform, the analysis found that land cover was a significant predictor of disturbance patterns. In particular, pine forest had significantly higher odds of disturbance than cloud forest. Previous comparisons of pine vs. tropical broadleaf disturbance and recovery (CitationBoucher et al., 1990; CitationYih et al., 1991) were limited to observations from distant areas or to remotely sensed measures (CitationLee et al., 2008). In the Cordillera Central, these communities occur in adjacent areas (i.e., the pine-cloud forest ecotone; CitationMartin et al., 2007) and so experienced similar combinations of hurricane wind direction, intensity, and exposure. The result that canyon bottoms and flat-gentle slopes had higher odds of disturbance than steep slopes and ridgetops () was surprising, especially given that landslides and scouring were excluded from this analysis. Using terrain position index calculated from an ∼30 m DEM may not adequately classify landforms for such a highly dissected landscape, or it is possible that stand characteristics or soil saturation on these landforms (CitationEverham and Brokaw, 1996) may have contributed to higher than expected wind disturbance.
In pine forest, recovery from hurricane impacts has been slow due to the high degree of mortality from snapping and uprooting and the inability of Pinus occidentalis to resprout (basal and/or epicormic) or reflush canopy foliage. Uprooting was rare in cloud forest, similar to observations in Puerto Rico (CitationWeaver, 1986), which is not surprising given size-related trends in uprooting (CitationWalker, 1991) and the low overall height of cloud forest. If most of the impact on cloud forests from Hurricane Georges was minor, such as defoliation and broken branches, resprouting was probably the primary mechanism of recovery, as widely documented in tropical forests elsewhere (CitationWalker, 1991; CitationYih et al., 1991; CitationBellingham et al., 1994; CitationZimmerman et al., 1994). Due to our lack of early post-hurricane observations, we cannot assess how cloud forests recovered from minor injuries, yet this study confirms that they are highly resistant to hurricane-induced mortality and uprooting.
Different patterns of disturbance in pine and cloud forests will likely influence ecological processes in the post-hurricane landscape. Despite higher BA losses in pure pine forest, changes in its floristics will likely be minor, as there are no other tree species to compete with the pine, while hurricane damage in transitional pine forest and the mixed pine-broadleaf forest at lower elevations is likely to favor non-pine tree species. In pure pine forests, the large patches of wind-disturbed forest have strongly modified fuel bed conditions and fuel structures, altering future fire risk and patterns in the fire-prone portions of the site (CitationMartin and Fahey, 2006; CitationSherman et al., 2008). In contrast, the patchy, low-to-moderate impacts in the cloud forest suggest that hurricanes—notwithstanding their vast size and destructiveness on coastal and low elevation forests (e.g., CitationYih et al., 1991)—may be important in maintaining species of contrasting life histories in TMFs, serving as an “intermediate” disturbance at landscape scales (sensu CitationConnell, 1978; CitationTanner and Bellingham, 2006). Hurricane Georges left a mosaic of conditions in the cloud forest, creating many small canopy openings necessary for pioneer tree species to thrive (such as Garrya fadyenii, Brunellia comocladifolia, and Clusia clusiodes; CitationSherman et al., 2005), while leaving intact areas for tree species adapted to stable conditions and low light conditions. Frequent and uniformly large blowdowns would result in decreased abundance of late successional species across tropical montane landscapes (CitationGuzmán-Grajales and Walker, 1991).
Previously, the areal impacts of hurricanes have been estimated from observed damage (which is contingent on properties of storms and landscapes; CitationTanner et al., 1991), from meteorological models (which require calibration data; CitationBoose et al., 1994), and from other locally appropriate estimates (CitationBellingham et al., 1992). Instead, we used the consistency of category-specific mean storm radii to estimate the locations of strike paths for every hurricane in the 158-yr HURDAT database. This raster-based approach accounts for the proportion of site area affected by each hurricane and allows for consistent calculations across scales. Compared to object-based calculations, our method generally produces more conservative (longer) return intervals (), but our estimates for Jamaica (8.5 yr) and Puerto Rico (8.9 yr) are shorter than the 15 and 22 yr return intervals, respectively, calculated from direct strikes by Tanner et al. (Citation1991).
Hurricanes have marked spatial variability in frequency across the Caribbean and within islands. Overall, high mountains and the interiors of larger islands have been struck much less frequently then coastal areas, smaller islands, and lower elevations. When the longer return interval for the Cordillera Central (14.4 yr) is considered in light of the low area disturbed by wind in Hurricane Georges (11.3%), the rotation period for the site is quite long: ∼127 yr. Low areal disturbance leads to long rotation periods, consistent with patterns in Jamaica (CitationBellingham, 1991) and probably true for many hurricane-impacted TMFs (high frequency, low impact) given the generally diffuse nature of hurricane impacts in these forests. The shorter return intervals for Jamaica and Puerto Rico suggest that hurricanes may place higher selection pressures on these forests compared to interior mountain ranges of the larger islands.
Lugo (Citation2000) postulated that if hurricanes increase in intensity and frequency as temperatures increase, climate change would increase the dominance of early-successional species. However, research since then has indicated that climate change will increase the intensity but decrease the frequency of hurricanes (CitationKnutson et al., 2010). While increasing hurricane intensity should result in more severe impacts, longer periods between events will likely allow most species to recover and persist on the landscape. In the Cordillera Central, pine forests were far more severely affected by Hurricane Georges, and more intense future hurricanes will likely produce a similar result. In addition, where climatic conditions are suitable, cloud forest will replace wind-disturbed pine forest in areas along and below the ecotone (CitationMartin et al., 2007, Citation2011), but in pure pine forest at the highest elevations and in the rain shadow, more frequent hurricanes may shift pine forests toward a pine woodland or a landscape dominated by large patches of shrubs. Climate change that also brings droughts and increased fire frequency will likely increase fire-hurricane interactions, creating complex patterns on the landscape including scenarios where fires burn into the normally fire-resistant cloud forest. While fires in the elevation zone of the cloud forest are rare (CitationMartin and Fahey, 2006), evidence indicates that in conjunction with an unusually severe dry season, even relatively low-intensity surface fires can burn into the cloud forest in areas where prior hurricanes opened the cloud forest canopy (CitationSherman et al., 2008).
Acknowledgments
This work was supported by the National Science Foundation Grant No. 0921925.
Related Research Data
References Cited
- Bellingham, P. J. , 1991: Landforms influence patterns of hurricane damage: evidence from Jamaican Montane Forests. Biotropica , 23: 427–433.
- Bellingham, P. J. , Kapos, V. , Varty, N. , Healey, J. R. , Tanner, E. V. J. , Kelly, D. L. , Dalling, J. W. , Burns, L. S. , Lee, D. , and Sidrak, G. , 1992: Hurricanes need not cause high mortality: the effects of Hurricane Gilbert on forests in Jamaica. Journal of Tropical Ecology , 8: 217–223.
- Bellingham, P. J. , Tanner, E. V. J. , and Healey, J. R. , 1994: Sprouting of trees in Jamaican Montane Forests, after a hurricane. Journal of Ecology , 82: 747–758.
- Bianchette, T. A. , Liu, K.-B. , Lam, N. S.-N. , and Kiage, L. M. , 2009: Ecological impacts of Hurricane Ivan on the Gulf Coast of Alabama: a remote sensing study. Journal of Coastal Research , 56: 1622–1626.
- Boose, E. R. , Foster, D. R. , and Fluet, M. , 1994: Hurricane impacts to tropical and temperate forest landscapes. Ecological Monographs , 64: 370–400.
- Boose, E. R. , Serrano, M. I. , and Foster, D. R. , 2004: Landscape and regional impacts of hurricanes in Puerto Rico. Ecological Monographs , 74: 335–352.
- Boucher, D. H. , Vandermeer, J. H. , Yih, K. , and Zamora, N. , 1990: Contrasting hurricane damage in tropical rain forest and pine forest. Ecology , 71: 2022–2024.
- Breiman, L. , 2001: Random forests. Machine Learning , 45: 5–32.
- Brokaw, N. V. L. , and Grear, J. S. , 1991: Forest structure before and after Hurricane Hugo at three elevations in the Luquillo Mountains, Puerto Rico. Biotropica , 23: 386–392.
- Brokaw, N. V. L. , and Walker, L. R. , 1991: Summary of the effects of Caribbean hurricanes on vegetation. Biotropica , 23: 442–447.
- Canham, C. D. , Thompson, J. , Zimmerman, J. K. , and Uriarte, M. , 2010: Variation in susceptibility to hurricane damage as a function of storm intensity in Puerto Rican tree species. Biotropica , 42: 87–94.
- Connell, J. H. , 1978: Diversity in tropical rain forests and coral reefs. Science , 199: 1302–1310.
- Cutler, D. R. , Edwards, T. C., Jr. , Beard, K. H. , Cutler, A. , Hess, K. T. , Gibson, J. and Lawler, J. J. , 2007: Random forests for classification in ecology. Ecology , 88: 2783–2792.
- Demuth, J. , DeMaria, M. , and Knaff, J. A. , 2006: Improvement of advanced microwave sounder unit tropical cyclone intensity and size estimation algorithms. Journal of Applied Meteorology and Climatology , 45: 1573–1581.
- ERSDAC, 2009: ASTER Global Digital Elevation Model, http://www.gdem.aster.ersdac.or.jp/, accessed 15 October 2009.
- Everham, E. M., III , and Brokaw, N. V. L. , 1996: Forest damage and recovery from catastrophic wind. Botanical Review , 62: 113–185.
- Guariguata, M. R. , 1990: Landslide disturbance and forest regeneration in the Upper Luquillo Mountains of Puerto Rico. Journal of Ecology , 78: 814–832.
- Guiney, J. L. , 1999: Hurricane Georges Preliminary Report , National Hurricane Center, http://www.nhc.noaa.gov/1998georges.html, accessed 20 January 2010.
- Guzmán-Grajales, S. M. , and Walker, L. R. , 1991: Differential seedling responses to litter after Hurricane Hugo in the Luquillo Experimental Forest, Puerto Rico. Biotropica , 23: 407–413.
- Helmer, E. H. , and Ruefenacht, B. , 2005: Cloud-free satellite image mosaics with regression trees and histogram matching. Photogrammetric Engineering & Remote Sensing , 71: 1079–1089.
- Knaff, J. A. , Sampson, C. R. , DeMaria, M. , Marchok, T. P. , Gross, J. M. , and McAdie, C. J. , 2007: Statistical tropical cyclone wind radii prediction using climatology and persistence. Weather and Forecasting , 22: 781–791.
- Knutson, T. R. , McBride, J. L. , Chan, J. , Emanuel, K. , Holland, G. , Landsea, C. , Held, I. , Kossin, J. P. , Srivastava, A. K. , and Sugi, M. , 2010: Tropical cyclones and climate change. Nature Geoscience , 3: 157–163.
- Lee, M-F. , Lin, T-C. , Vadeboncoeur, M. A. , and Hwong, J-L. , 2008: Remote sensing assessment of forest damage in relation to the 1996 strong typhoon Herb at Lienhuachi Experimental Forest, Taiwan. Forest Ecology and Management , 255: 3297–3306.
- Lugo, A. E. , 2000: Effects and outcomes of Caribbean hurricanes in a climate change scenario. The Science of the Total Environment , 262: 243–251.
- Lugo, A. E. , 2008: Visible and invisible effects of hurricanes on forest ecosystems: an international review. Austral Ecology , 33: 368–398.
- Majka, D. , Jenness, J. , and Beier, P. , 2007: CorridorDesigner: ArcGIS tools for designing and evaluating corridors, http://corridordesign.org, accessed 20 January 2010.
- Martin, P. H. , and Fahey, T. J. , 2006: Fire history along environmental gradients in the subtropical pine forests of the Cordillera Central, Dominican Republic. Journal of Tropical Ecology , 22: 1–14.
- Martin, P. H. , Sherman, R. E. , and Fahey, T. J. , 2004: Forty years of tropical forest recovery from agriculture: structure and floristics of secondary and old-growth riparian forests in the Dominican Republic. Biotropica , 36: 297–317.
- Martin, P. H. , Sherman, R. E. , and Fahey, T. J. , 2007: Tropical montane forest ecotones: climate gradients, natural disturbance, and vegetation zonation in the Cordillera Central, Dominican Republic. Journal of Biogeography , 34: 1792–1806.
- Martin, P. H. , Fahey, T. J. , and Sherman, R. E. , 2011: Vegetation zonation in a Neotropical Montane Forest: Environment, disturbance, and ecotones. Biotropica , 43: 533–543.
- McGarigal, K. , Cushman, S. A. , Neel, M. C. , and Ene, E. , 2002: FRAGSTATS: Spatial Pattern Analysis Program for Categorical Maps. Amherst, Massachusetts: University of Massachusetts, http://www.umass.edu/landeco/research/fragstats/fragstats.html, accessed 15 November 2009.
- NOAA, 2009: IBTrACS Dataset, National Climatic Data Center, http://www.ncdc.noaa.gov/oa/ibtracs, accessed 15 October 2009.
- R Development Core Team , 2009: R: a Language and Environment for Statistical Computing. Vienna, Austria: R Foundation for Statistical Computing, http://www.R-project.org, accessed 15 November 2009.
- Runkle, J. R. , 1985: Disturbance regimes in temperate forests. In Pickett, S. T. A. , and White, P. S. (eds.), The Ecology of Natural Disturbance and Patch Dynamics. New York: Academic Press, 17–34.
- Scatena, F. N. , and Larsen, M. C. , 1991: Physical aspects of Hurricane Hugo in Puerto Rico. Biotropica , 23: 317–323.
- Scatena, F. N. , and Lugo, A. E. , 1995: Geomorphology, disturbance, and the soil and vegetation of two subtropical wet steepland watersheds of Puerto Rico. Geomorphology , 13: 199–213.
- Sherman, R. E. , Martin, P. H. , and Fahey, T. J. , 2005: Vegetation-environment relationships in forest ecosystems of the Cordillera Central, Dominican Republic. Journal of the Torrey Botanical Society , 132: 293–310.
- Sherman, R. E. , Martin, P. H. , Fahey, T. J. , and Degloria, S. D. , 2008: Fire and vegetation dynamics in high-elevation Neotropical montane forests of the Dominican Republic. Ambio , 37: 535–541.
- Song, C. , Woodcock, C. E. , Seto, K. C. , Lenney, M. P. , and Macomber, S. A. , 2001: Classification and change detection using Landsat TM data: when and how to correct atmospheric effects? Remote Sensing of Environment , 75: 230–244.
- Sousa, W. P. , 1984: The role of disturbance in natural communities. Annual Review of Ecology and Systematics , 15: 353–391.
- Staben, G. W. , and Evans, K. G. , 2008: Estimates of tree canopy loss as a result of Cyclone Monica, in the Magela Creek catchment northern Australia. Austral Ecology , 33: 562–569.
- Tanner, E. V. J. , and Bellingham, P. J. , 2006: Less diverse forest is more resistant to hurricane disturbance: evidence from montane rain forests in Jamaica. Journal of Ecology , 94: 1003–1010.
- Tanner, E. V. J. , Kapos, V. , and Healey, J. R. , 1991: Hurricane effects on forest ecosystems in the Caribbean. Biotropica , 23: 513–521.
- Turton, S. M. , 2008: Landscape-scale impacts of Cyclone Larry on the forests of northeast Australia, including comparisons with previous cyclones impacting the region between 1858 and 2006. Austral Ecology , 33: 409–416.
- USGS, 2009: Landsat Data, Earth Resources Observation and Science Center, http://www.glovis.usgs.gov, accessed 15 November 2009.
- Walker, L. R. , 1991: Tree damage and recovery from Hurricane Hugo in Luquillo Experimental Forest, Puerto Rico. Biotropica , 23: 379–385.
- Walker, L. R. , 1994: Effects of fern thickets on woodland development on landslides in Puerto Rico. Journal of Vegetation Science , 5: 525–532.
- Walker, L. R. , Lodge, D. J. , Brokaw, N. V. L. , and Waide, R. B. , 1991: An introduction to hurricanes in the Caribbean. Biotropica , 23: 313–316.
- Walker, L. R. , Zarin, D. J. , and Fetcher, N. , 1996: Ecosystem development and plant succession on landslides in the Caribbean. Biotropica , 28: 566–576.
- Wang, F. , and Xu, Y. J. , 2009: Hurricane Katrina-induced forest damage in relation to ecological factors at landscape scale. Environmental Monitoring and Assessment , 156: 491–507.
- Wang, F. , and Xu, Y. J. , 2010: Comparison of remote sensing change detection techniques for assessing hurricane damage to forests. Environmental Monitoring and Assessment , 162: 311–326.
- Wang, W. , Qu, J. J. , Hao, X. , Liu, Y. , and Stanturf, J. A. , 2010: Post-hurricane forest damage assessment using satellite remote sensing. Agricultural and Forest Meteorology , 150: 122–132.
- Weaver, P. L. , 1986: Hurricane damage and recovery in the montane forests of the Luquillo Mountains of Puerto Rico. Caribbean Journal of Science , 22: 53–70.
- Weaver, P. L. , 1999: Impacts of Hurricane Hugo in the dwarf cloud forest of Puerto Rico's Luquillo Mountains. Caribbean Journal of Science , 35: 101–111.
- White, P. S. , and Pickett, S. T. A. , 1985: Natural disturbance and patch dynamics: an introduction. In Pickett, S. T. A. , and White, P. S. (eds.), The Ecology of Natural Disturbance and Patch Dynamics. New York: Academic Press, 3–13.
- Yih, K. , Boucher, D. H. , Vandermeer, J. H. , and Zamora, N. , 1991: Recovery of the rain forest of southeastern Nicaragua after destruction by Hurricane Joan. Biotropica , 23: 106–113.
- Zimmerman, J. K. , Everham, E. M., III , Waide, R. B. , Lodge, D. J. , Taylor, C. M. , and Brokaw, N. V. L. , 1994: Responses of tree species to hurricane winds in subtropical wet forest in Puerto Rico: implications for tropical tree life histories. Journal of Ecology , 82: 911–922.
- Zimmerman, J. K. , Willig, M. R. , Walker, L. R. , and Silver, W. L. , 1996: Introduction: disturbance and Caribbean ecosystems. Biotropica , 28: 414–442.