
ABSTRACT
Patterns of soil bacterial richness using operational taxonomic units (OTUs) and abundance of bacterial groups (phylum or class) were studied in relation to plant richness and soil characteristics in the alpine at Niwot Ridge, Colorado, U.S.A. The study used a landscape gradient and snow fence in addition to plots amended with nitrogen (N). Bacterial richness was not correlated with total soil carbon (C) or total soil N, but showed strong positive correlations with pH and corresponding correlations with metallic cation concentrations. Bacterial richness showed a strong negative correlation (r = −0.86) with soil acidity and declined 30% over the pH gradient of 6.0–4.5. Plant richness correlated with acidity (r = −0.70) and declined 50% over this gradient. Bacterial OTU richness was sensitive to acidity but not to N amendments. However, abundance of five bacterial groups responded positively to N, four responded negatively, and three groups exhibited no changes. In plots with additional snow, snow additions reduced OTU richness. However, when snow was included in an ANCOVA model with N and soil acidity, OTUs were not affected, suggesting that snow effects were largely captured by soil acidity changes. Bacterial richness was correlated with forb richness and cover, but causal relationships remain unresolved.
Introduction
Understanding the complex interactions that influence patterns of plant and soil microbial richness and processes remains a challenge to ecosystem and community ecologists. Cause-effect relationships affecting both community structure and ecosystem processes are currently of substantial interest, perhaps more so because of global climate change, which may affect community structure and the regulatory feedbacks from these communities (CitationCreamer et al., 2016; CitationGraham et al., 2016; CitationYuan et al., 2016).
Plants play key roles in driving soil microbial community structure and function (CitationBardgett and Wardle, 2010). Many researchers have concentrated on the influences of plant community species richness and composition on belowground bacterial communities (CitationZak et al., 2003; CitationLamb et al., 2011), yet the relationships between plant and soil bacteria in richness are often inconsistent with distinct study methods or space and time lags. In general, positive effects of plant species richness on bacterial community richness could be attributed to the increasing soil nutrient pools and root exudate chemistry (CitationZak et al., 2003; CitationLoranger-Merciris et al., 2006). The use of plant and resource gradients over a variety of spatial scales also has begun to elucidate some of these relationships among plant and microbial patterns.
Increased nitrogen deposition in terrestrial ecosystems has affected both edaphic factors and biotic communities. These additions increase soil acidity (CitationClark et al., 2007; CitationPhoenix et al., 2012), decrease plant species richness and diversity (CitationSuding et al., 2015), and alter belowground bacterial community structure (CitationNemergut et al., 2008; CitationLauber et al., 2009; CitationYuan et al., 2016). The alpine ecosystem is a useful model system to explore above- and belowground relationships because of the very large local gradients seen in both abiotic and biotic variables (CitationSeastedt et al., 2004; CitationSuding et al., 2015). Schmidt et al. (Citation2015) summarized this knowledge base with an emphasis on soil microbes for a high-elevation site at Niwot Ridge, Colorado, U.S.A. They reported on the status of coupling between the plant-soil microbial communities. As noted in their summary, both plant and microbial richness decline with the addition of nitrogen (N), but the mechanisms explaining these patterns remained unclear. A fertilization experiment initiated in 1993 at Niwot Ridge provided further insights on how N and phosphorus (P) additions directly or indirectly affected patterns of richness in vegetation and soil bacteria when viewed over a natural moisture gradient (CitationGasarch and Seastedt, 2015a; CitationYuan et al., 2016). The research on vegetation responses included both a snowpack and nutrient manipulation (CitationGasarch and Seastedt, 2015b), whereas the reported research on soil bacteria summarized findings for only the nutrient manipulation as viewed over a moisture gradient. Plots contained within an area impacted by a snow fence, also treated with nutrients, were not included in the Yuan et al. (Citation2016) study.
Here, we expanded upon the bacteria findings to include results from snow-enhanced plots. Also, we re-analyzed the plant data set at a finer level of spatial resolution to evaluate potential relationships of forb and graminoid abundance and soil characteristics with the soil bacteria. A previous snow fence experiment had measured the responses of soil nutrients to the snow and noted how the snow amounts and duration were influenced by plot location within a snow drift of variable depth (CitationFreppaz et al., 2012). In the statistical analyses of Gasarch and Seastedt (Citation2015b), snow addition was treated as a single variable when the reality is that the duration and amount of this snow addition varied as a function of distance from the fence, and these amounts varied substantially within the short growing season found in the alpine. We therefore repeated some of their soil measurements in 2015 to see if the landscape and snow fence gradient measured within individual plots produced a clearer pattern of factors controlling plant and soil bacterial communities collected a few years earlier. Our goal was to use the natural gradient generated by the landscape, the snow fence experiment, and the plot nutrient amendments to assess if soil bacterial community diversity and composition could be better explained by plot-level combinations of plant and abiotic factors rather than lumping these into discrete moisture and nutrient treatments. We asked the following questions: (1) How do soil bacterial and plant communities vary across environmental gradient, and how do these changes in bacterial and plant communities relate to one another? (2) To what extent can the patterns of soil bacterial richness and phyla abundance be interpreted based upon relationships with plant and soil characteristics? (3) Finally and specifically, for bacterial richness and composition, can factors related to N addition be separated from the indirect effects that N has on soil acidity in the alpine?
Study Area and Methods
The Niwot Ridge alpine tundra site is found at 40°03′N, 105°35′W, in a specific area referred to as the Saddle, a gradient from wind-swept fellfield to deep snow bed communities at about 3600 m elevation, approximately 5 km east of the continental divide. The ecological research area at Niwot Ridge is one of the original sites in the U.S. National Science Foundation Long-Term Ecological Research (LTER) network established in 1980. The saddle has been repeatedly sampled during this interval, documenting both vegetation (CitationWalker et al., 1993, Citation1994; CitationSpasojevic et al., 2013), and soil moisture gradients (CitationTaylor and Seastedt, 1994; CitationLitaor et al., 2008). The study site has most recently been extensively described in a series of articles introduced by Williams et al. (Citation2015), an update of research reported by Bowman and Seastedt (Citation2001). A central portion of that gradient, the dry and moist meadow areas that are nested within the fellfield and snow bed areas impacted both by a snow fence and without the snow fence, were studied here. In addition, an adjacent wet meadow area that lacked the snow manipulation was also sampled. Four replicates of each nutrient treatment in each meadow were used, and these include four replicates of control, nitrogen (N), phosphorus (P), and both N and P (NP). These nutrients were initially treated annually, and then biennially since 1993. Additions attempted to remove possible nutrient limitation or co-limitation to plant growth, and the outcome of these additions in terms of soil characteristics was summarized by Freppaz et al. (Citation2012). A preliminary analysis of additions indicated few or no responses by soil bacteria to P amendments (CitationYuan et al., 2016), and therefore only soil bacteria responses to N additions are reported here. Thus, control and P-added plots consist of the reference plots, whereas N-added and NP added compose the N addition plots.
Plant richness, relative cover, and life form of the vascular species (forbs or graminoids) were assessed using point-intercept measurements on a single m2 of each of the 80 plots. The total number of plant species (richness) and cover by each species (relative percentage of vascular plant hits from 100 points per plot), and life form are reported here. Each plot was sampled for microbial community structure by collecting 5 soil cores at 10 cm depth and bulking into a single plot sample. Samples were sieved through a 2 mm mesh size and stored at -70 °C for molecular analysis and 4 °C for chemical analyses. From each sample, total genomic DNA was extracted using the PowerSoil DNA Isolation Kit (MO BIO Laboratories Inc., Carlsbad, California, U.S.A.) and PCR was amplified for the 16S rRNA gene using the 515F/806R primers and sequenced on an Illumina MiSeq sequencer according to Knelman et al. (Citation2015). Sequences were analyzed and assigned to an OTU as described in Yuan et al. (Citation2016). For use of bacterial sequences counts for analyses of phyla- or class-level bacterial abundance, all samples were rarefied to 9715 sequences. The plant and microbial measurements used here were also described in Gasarch and Seastedt (Citation2015a, Citation2015b) and Yuan et al. (Citation2016).
In the summer of 2015 soils were again sampled according to the described manner for bacterial communities' measurement, and soils were measured for total carbon (C) and N using a Thermo Finnigan EA 1112 Series Flash Elemental Analyzer (Thermo Fisher Scientific, Inc., Waltham, Massachusetts, U.S.A.) at the University of Colorado (CU) LTER laboratory. Major cations and a measurement of plant-available P (Melich III P) from the 2015 samples were measured by the Kansas State University Soils Testing Laboratory. Soils were measured for pH at the time of microbial sampling in 2013 by Yuan et al. (Citation2016). Soil pH was measured in a 1:1 soil weight — H2O volume using a glass electrode, and for this analysis pH values were converted to hydrogen ion concentrations. This procedure expanded the resolution and linearity between dependent variables and hydrogen ion concentrations at the ranges of pH observed here (4.5–6.0).
Statistical Analyses
We used Pearson correlation analysis to explore relationships among the abiotic and biotic variables. The vegetation and soil bacterial responses to nutrient amendments reported by Gasarch and Seastedt (Citation2015a, Citation2015b) and Yuan et al. (Citation2016) used a factorial ANOVA procedure and looked at nutrient and landscape position effects. Here, we combined the ANOVA test for N additions using a one-factor design (control or N added) to soil values from the plots using an ANCOVA procedure. We used the Statistical Analysis System software 9.3 (CitationSAS, 2011). The N effects on biotic variables were evaluated using a type-III sums of squares, which evaluated the significance of the N effect after accounting for effects of the regression variables (e.g., soil acidity, nutrients, etc.) on the dependent variable. Snow addition on the bacterial groups was assessed separately on the 64 plots used in that experiment as that analysis had not been previously conducted, and then snow was included in the ANCOVA with N and soil acidity to determine what, if any, snow effects had after the variance attributed to the other factors was removed.
Results
Soils
When measured in 2013, the average pH of all N addition plots was less than control plots (4.88 ± 0.04 std. error versus 5.14 ± 0.06 std. error, t-test P > 0.004, ). The range of pH in control plots was 4.65–5.98, whereas the range in treated plots was 4.48–5.58. When these pH values were matched up with exact plot locations, an obvious relationship with the dry-to-wet moisture gradient at this site was observed, with the wetter areas having reduced pH values (data not shown). Not surprisingly, the acidity gradient produced an inverse relationship with metallic cations such as Ca, Mg, and K (). However, plots treated repeatedly with N fertilizer during the 1993–2015 interval did not contain significantly higher total soil N concentrations than untreated plots (N added = 1.02 ± 0.03, versus 0.98 ± 0.03 N as % of mass for control plots, t-test P = 0.40, ). Similar to findings of Lieb et al. (Citation2011), N addition only affected the abundance of Mg++ whereas other cations and plant-available P were unaffected (). The acidity gradient also did not correlate with values observed for total soil N or plant-available P, at least not in the top 10 cm of soils used to sample the soil bacteria. Total soil N and plant-available P were also not correlated with any of the other soil measurements ().
Biotic Responses
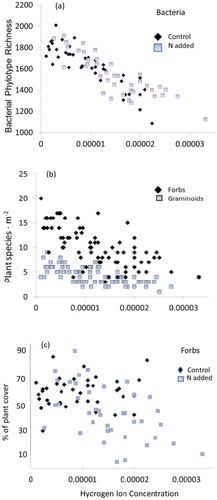
Plant and bacterial richness exhibited similar relationships to soil acidity, with both showing a decline (). Bacterial richness showed a relatively strong negative correlation (Pearson's Correlation, r = -0.86) with N additions not influencing this relationship except to produce the lowest soil acidity values found in wet plots (, part a). Total plant richness was less well defined (r = -0.70), with forb richness exhibiting a -.67 correlation and graminoids showing a -.61 correlation with acidity (, part b). The negative relationship between relative plant cover of forb species and soil acidity is shown in , part c. Relative graminoid cover was the inverse of this pattern (data not shown). The negative impact of N additions on relative forb cover is visually evident when examining values for all plots (, part c). The patterns visually evident in are confirmed with the ANCOVA analysis, which found N additions to negatively affect plant richness but not influence bacterial OTU richness once soil acidity effects were removed ().
TABLE 1 Pearson correlation matrix of plant, soil characteristics and soil bacterial OTUs1.
ANCOVA
Using the ANCOVA procedure, we tested whether the abundances of bacterial groups observed by Yuan et al. (Citation2016) were driven by N availability as opposed to soil acidity (). Of the 12 identified major bacterial phyla (class within the Proteobacteria) reported here, only one, Gammaproteobacteria, a class that comprised about 5.1% of bacterial communities, did not show a positive or negative correlation with the range of soil acidity found in our study ( and ). Bacterial groups that showed negative correlations with soil acidity comprised about 55% of communities (, and and ). Using results from the ANCOVA, only three groups, Acidobacteria, Chloroflexi, and Planctomycetes, which collectively made up about 31% of communities, showed positive responses to soil acidity (, and and ). Based on the ANCOVA, which adjusts for the responses to acidity, N additions significantly enhanced five groups (Alphaproteobacteria, Gammaproteobacteria, Actinobacteria, Bacteroidetes, and Gemmatimonadetes). N additions resulted in declines for the Acidobacteria, Chloroflexi, Planctomyctes, and Nitrospirae, whereas the Betaproteobacteria, Deltaproteobacteria, and Verrucomicrobia showed no responses to the N additions. No groups responded positively to both N additions and acidity, whereas only Nitrospirae showed negative declines to both variables. Acidobacteria, Chloroflexi, and Planctomycetes responded positively to acidity but negatively to N additions.
FIGURE 1. (a) Soil bacteria, (b) plant richness, and (c) forb cover in alpine plots in relation to soil hydrogen ion concentration. Nitrogen addition tends to increase plot acidity on average in , parts a and c, but does not appear to affect the richness-acidity relationships.
The responses of the 12 groups studied here to soil C, N, P, and cations showed remarkably few correlations. Surprisingly, N and plant-available P were not correlated with the abundance of any group. Carbon content of soil also failed to show any relationships, whereas cation abundance was strongly and inversely correlated with the responses observed for soil acidity (data not shown).
Because forb abundance and forb richness were negatively correlated to soil acidity (; CitationYuan et al., 2016), one might expect bacteria correlations with forb abundance to match their responses to soil acidity. Only one bacterial phylum, Acidobacteria, exhibited a positive correlation with forb cover while also responding positively to soil acidity. All other groups that showed positive responses to acidity showed either no relationships or negative correlations with forb cover ().
The increase in snow depth using the snow fence manipulation had a modest negative effect on total OTU richness. Among the bacteria, three groups showed negative responses to snow, and one (the Chloroflexi) showed a positive response (). When included in an ANCOVA with N and soil acidity, only the Deltaproteobacteria indicated that snow, rather than either N or soil acidity, was important in affecting the abundance of this group.
Discussion
Understanding how soil biotic diversity relates to aboveground diversity and ecosystem functioning remains an elusive goal of ecology, but one in which advances are occurring rapidly (CitationBardgett and van der Putten, 2014). Here, our findings that the patterns of plant plot richness show positive correlations with soil bacterial OTU richness certainly do not negate the contention that “richness enhances richness,” but at the same time use these results to support mechanistic relationships, which remain tenuous at best. These patterns could result from the fact that soil constraints associated with pH independently drive both plant and bacterial patterns. Our work evaluated how N additions could be used as a mechanism to disentangle similarities on the relationship with soil acidity by the plants and soil bacteria. In our previous study we saw only limited associations between plant and bacteria richness, and differences in bacterial responses to N and pH were seen to be influenced by meadow type. Using the larger sample size and the plot-level analysis approach described here, more definitive relationships among abiotic and biotic variables have been identified.
TABLE 2 Plant and soil relationships with soil bacterial groups.
The range in pH seen at our site was almost half of the range in acidity seen in the 700 km alpine transect conducted by Yashiro et al. (Citation2016). As found here, pH was the strongest environmental correlate in their study. While those researchers had a much larger soil gradient to evaluate relationships, like our study there were very few soil variables that showed strong or consistent relationships, and the study did not report correlates with other biotic variables.
The fact that soil acidity at our site exhibits a large range in values across only a few hundred meters of alpine tundra corresponds with strong gradients in both soil bacterial and plant richness. This gradient exists regardless of whether sites are heavily supplemented with N, but N fertilization, by its propensity to acidify soils, contributed to this overall pattern. Soil bacterial community structure has also proved to be strongly driven by soil pH induced by the effects of N addition (CitationYuan et al., 2016). With increasing hydrogen ion concentrations, the stoichiometry of essential nutrient availability in soils is undoubtedly altered, and this outcome might have uniformly negative impacts to both bacteria and plants. For plants, N additions also alter competitive relationships for other limited resources such as light and water (e.g., CitationSuding et al., 2015). In our study, the strong positive plant-microbial interactions are mainly because of the changes in forbs in our study, which suggest that future changes in soil hydrogen ion concentration (including that induced by N deposition) across the alpine landscape will likely lead to changes in specific forb groups and their associated microbial communities, influencing soil available resources and nutrient cycling in the alpine ecosystem.
Leff et al. (Citation2015) reported that some bacterial groups were “consistent increasers” to nutrient additions in their multi-site analysis of grasslands, and the three they identified in their study were among the five groups that responded here. Similarly, those authors reported consistent declines in three groups, two of which also declined in our study, but also including the Deltaproteobacteria, which did not show significant decreases to N in the alpine (). Instead, we found this group sensitive to snow, but not to N or soil acidity. In arctic tundra, Koyama et al. (Citation2014) reported responses similar to our study for increases in Alphaproteobacteria and Gammaproteobacteria to N additions, but unlike their study, we did not find increases for the Betaproteobacteria (). The negative response of the Betaproteobacteria to soil acidity may have negated its otherwise positive response to N additions. We therefore conclude that the alpine plant communities, although similar to grasslands, exhibit some unique responses to N that do not match the grassland counterparts. In similar fashion the alpine tundra does not show consistent results with respect to the global dryland analysis of microbial communities by Maestre et al. (Citation2015). That study found strong correlations of diversity with soil C and no relationship with pH. The alpine soils' extremely high C content and pH values lower than those used in the global analysis again argues that the alpine is under different controls than dryland grasslands. Responses of the various bacterial groups to soil pH reported by Maestre et al. (Citation2015) also often did not agree with the responses reported here, suggesting that these groups generally exhibit a curvilinear response to soil pH when viewed over all habitats measured here and in other studies.
FIGURE 2. Abundance of Acidobacteria, Gammaproteobacteria, and Planctomycetes in relation to soil hydrogen ion concentration. The Gammaproteobacteria respond positively to N whereas the other two exhibit negative responses (). Note that y-axis values are not constant in these and subsequent figures. The number of sequences shown on the y-axis is out of 9715 sequences per sample.
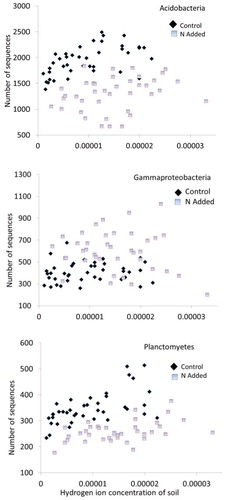
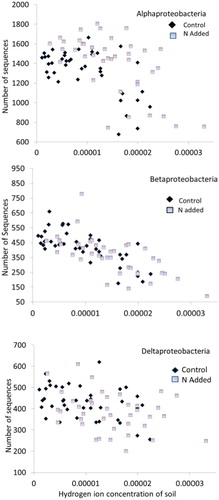
FIGURE 3. Three of the four classes of the Phylum Proteobacteria show a negative response to soil acidity while showing no clear response to N additions (). The number of sequences shown on the y-axis is out of 9715 sequences per sample.
Similar to the work of Nemergut et al. (Citation2008) in the alpine, our study found that N addition increased the relative abundance of Bacteroidetes and Gemmatimonadetes, but in contrast, our study failed to show a decline because of N additions in the Verrucomicrobia. Our analysis instead indicated that the decline was related to soil acidity. The very strong positive Chloroflexi response to the moisture and acidity gradient of the alpine, as reported here and by Costello and Schmidt (Citation2006), is very different from responses to pH and aridity presented in Maestre et al. (Citation2015). In the alpine, this group is most abundant in acidic and moist environments, whereas across dry grasslands it shows no response to moisture and a significant positive response to increasing pH. Chloroflexi was a nonconformer in the alpine, which, along with Planctomycetes, responded positively to acidity but negatively to N additions. Attempting to reconcile these findings to other results, we speculate that these responses may be competition- rather than resource-driven, or the groups are responding to soil characteristics not linearly related to soil acidity. Additionally, the coarse taxonomic groupings used in our study and others plus the lack of functional information for these groupings may also contribute to inconsistencies in results between studies. Forb richness and cover showed the same negative correlation to soil acidity as did many of the bacterial groups and therefore we cannot separate out soil chemistry as opposed to plant chemistry as the driver of bacteria-plant correlations. The sole exception appeared to be for Acidobacteria, which was positively correlated with forbs and soil acidity, but not correlated with soil N or graminoid species. The strong correlation between Acidobacteria abundance and soil acidity in our study is as robust as Jones et al. (Citation2009) demonstrated. Variation of Acidobacteria abundance along soil pH and plant is consistent with their acidophilic and oligotrophic characteristics (CitationFierer et al., 2012). The positive forb and positive acidity association appears almost as a paradox given results shown in , but it could argue for the strength of the forb association, while concurrently expressing the acidophilic characteristic of Acidobacteria (CitationEichorst et al., 2007). This group contains common root-associated bacteria for the most abundant forb at this alpine site, Geum rossii, but was not nearly as abundant on the dominant grass, Deschampsia caespitosa (CitationDean et al., 2015). Hence, the suggestion that this Geum root associate might be associated with forb abundance in general seems reasonable. While other patterns of specific plant and bacterial groups are postulated, the sampling design, which did not attempt to co-locate soil samples with plant species or groups, limited our ability to detect anything other than very strong associations.
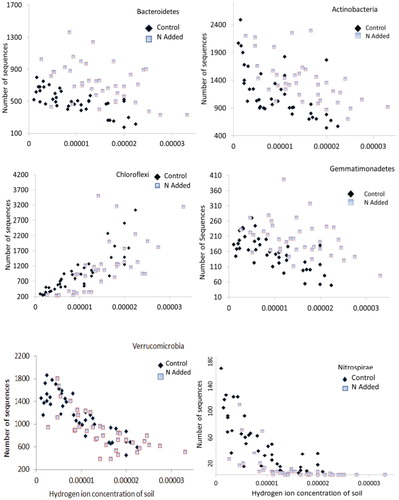
FIGURE 4. Actinobacteria, Bacteroidetes, and Gemmatimonadetes exhibit negative responses to soil acidity but show a positive response to N additions. Chloroflexi show a positive response to acidity but no obvious N responses, whereas Verrucomicrobia show negative responses to acidity that appear unaffected by N additions. The Nitrosporae exhibit negative responses to both variables (). The number of sequences shown on the y-axis is out of 9715 sequences per sample.
The fact that 5 of the major 12 bacterial groups identified in our study positively responded to N additions while showing no relationships with total soil N is intriguing. The N addition effect on bacterial abundance is apparently not influenced by the abundance of the organic N compounds that dominate the sources of total soil N. Rather, likely they are responding to increased labile organic sources provided by the plant species that positively respond to N fertilization.
Our sampling procedure imposed limitations on our ability to compare controls and plant and soil bacterial richness in the alpine. Plant and bacterial richness exhibit similar responses to landscape patterns in soil acidity in alpine tundra, but the mechanisms driving these patterns appear to be different, at least when measured at the scales used here. Both bacteria and plants appear to contain species and groups that are sensitive to N additions, whereas N additions reduce plant richness but not bacterial richness. The N additions are assumed to increase the importance of other factors such as light and water limitation, which contribute to competitive exclusion of plants in small plots. Further, the increased soil acidity of wetter plots coincides with a reduced growing season for plants. These factors collectively contribute to the decline in richness in plants, which is quite severe in terms of small plot richness. In contrast, the soil bacterial richness response to our gradient appears to be under a tighter set of rules that are generated by or correlated with patterns of soil acidity, and these controls result in a somewhat more benign decline in richness than observed in plants. This could be partly explained by the important indirect N effects on tundra bacterial community through changes in plant community structure identified in our prior study (CitationYuan et al., 2016). These results suggest that the plant-microbial associations and function might well be changed by the soil acidity influenced by N deposition. In addition, just as the sensitivity of specific bacterial groups to N addition and soil hydrogen ion concentration in our study, we could get the importance of examining changes in particular bacterial taxa, because they may likely display unique responses to variation in both biotic and abiotic factors under future environmental change.
Acknowledgments
We acknowledge both the inspiration and energy provided by Dr. Diana Nemergut, who passed away in December 2015. We thank Drs. Emily Farrar and Steven Schmidt for suggesting improvements to an earlier draft of this manuscript. Seth Flaaten helped with much of the Illumina sequencing. Xia Yuan was supported by the China Scholarship Council during much of this study. Research was funded in part by the National Science Foundation (NSF) through a grant (DEB-1258160) to Diana Nemergut, and an NSF graduate research fellowship to Joseph Knelman (DGE 1144083). The Niwot Ridge Long-Term Ecological Research program (DEB 1027341) supported the work of Eve Gasarch and Timothy R. Seastedt, whereas April Goebl was funded by NSF IGERT grant number 1144807 to the Quantitative Biology (IQ Biology) program at the BioFrontiers Institute, University of Colorado, Boulder. The data reported here are archived in the NWT LTER database (http://culter.colorado.edu/NWT/).
References Cited
- Bardgett, R. D. , and van der Putten, W. H. , 2014: Belowground biodiversity and ecosystem functioning. Nature , 515(7528): 505–511.
- Bardgett, R. D. , and Wardle, D. A. , 2010: Aboveground—Belowground Linkages: Biotic Interactions, Ecosystem Processes, and Global Change. New York: Oxford University Press, 64 pp.
- Bowman, W. D. , and Seastedt, T. R. , 2001: Structure and Function of an Alpine Ecosystem: Niwot Ridge, Colorado. New York: Oxford University Press, 337 pp.
- Clark, C. M. , Cleland, E. E. , Collins, S. L. , Fargione, J. E. , Gough, L. , Gross, K. L. , Pennings, S. C. , Suding, K. N. , and Grace, J. B. , 2007: Environmental and plant community determinants of species loss following nitrogen enrichment. Ecology Letters , 10(7): 596–607.
- Costello, E. K. , and Schmidt, S. K. , 2006: Microbial diversity in alpine tundra wet meadow soil: novel Chloroflexi from a cold, water-saturated environment. Environmental Microbiology , 8(8): 1471–1486.
- Creamer, R. E. , Hannula, S. E. , Van Leeuwen, J. P. , Stone, D. , Rutgers, M. , Schmelz, R. M. , de Ruiter, P. C. , Bohse Hendriksen, N. , Bolger, T. , Bouffaud, M. L. , Buee, M. , Carvalho, F. , Costa, D. , Dirilgen, T. , Francisco, R. , Griffiths, B. S. , Griffiths, R. , Martin, F. , Martins da Silva, P. , Mendes, S. , Morais, P. V. , Pereira, C. , Philippot, L. , Plassart, P. , Redecker, D. , Römbke, J. , Sousa, J. P. , Wouterse, M. , and Lemanceau, P. , 2016: Ecological network analysis reveals the inter-connection between soil biodiversity and ecosystem function as affected by land use across Europe. Applied Soil Ecology , 97: 112–124.
- Dean, S. L. , Farrer, E. C. , Porras-Alfaro, A. , Suding, K. N. , and Sinsabaugh, R. L. , 2015: Assembly of root-associated bacteria communities: interactions between abiotic and biotic factors. Environmental Microbiology Reports , 7(1): 102–110.
- Eichorst, S. A. , Breznak, J. A. , and Schmidt, T. M. , 2007: Isolation and characterization of soil bacteria that define Terriglobus gen. nov., in the phylum Acidobacteria. Applied and Environmental Microbiology , 73(8): 2708–2717.
- Fierer, N. , Lauber, C. L. , Ramirez, K. S. , Zaneveld, J. , Bradford, M. A. , and Knight, R. , 2012: Comparative metagenomic, phylogenetic and physiological analyses of soil microbial communities across nitrogen gradients. The ISME Journal , 6: 1007–1017.
- Freppaz, M. , Williams, M. W. , Seastedt, T. R. , and Filippa, G. , 2012: Response of soil organic and inorganic nutrients in alpine soils to a 16-year factorial snow and N-fertilization experiment, Colorado Front Range, USA. Applied Soil Ecology , 62: 131–141.
- Gasarch, E. I. , and Seastedt, T. R. , 2015a: Plant community resilience to nitrogen and phosphorus enrichment varies across an alpine tundra moisture gradient. Plant Ecology and Diversity , 8: 739–749.
- Gasarch, E. I. , and Seastedt, T. R. , 2015b: The consequences of multiple resource shifts on the community composition and productivity of alpine tundra: inferences from a long-term snow and nutrient experiment. Plant Ecology and Diversity , 8: 751–761.
- Graham, E. B. , Knelman, J. E. , Schindlbacher, A. , Siciliano, S. , Breulmann, M. , Yannarell, A. , Beman, J. M. , Abell, G. , Philippot, L. , Prosser, J. , Foulquier, A. , Yuste, J. C. , Glanville, H. C. , Jones, D. L. , Angel, R. , Salminen, J. , Newton, R. J. , Bürgmann, H. , Ingram, L. J. , Hamer, U. , Siljanen, H. M. P. , Peltoniemi, K. , Potthast, K. , Bañeras, L. , Hartmann, M. , Banerjee, S. , Yu, R. , Nogaro, G. , Richter, A. , Koranda, M. , Castle, S. C. , Goberna, M. , Song, B. , Chatterjee, A. , Nunes, O. C. , Lopes, A. R. , Cao, Y. , Kaisermann, A. , Hallin, S. , Strickland, M. S. , Garcia-Pausas, J. , Barba, J. , Kang, H. , Isobe, K. , Papaspyrou, S. , Pastorelli, R. , Lagomarsino, A. , Lindström, E. S. , Basiliko, N. , and Nemergut, D. R. , 2016: Microbes as engines of ecosystem function: When does community structure enhance predictions of ecosystem processes? Frontiers in Microbiology , 7: 214.
- Jones, R. T. , Robeson, M. S. , Lauber, C. L. , Hamady, M. , Knight, R. , and Fierer, N. , 2009: A comprehensive survey of soil acidobacterial diversity using pyrosequencing and clone library analyses. The ISME Journal , 3: 442–453.
- Knelman, J. E. , Graham, E. B. , Trahan, N. A. , Schmidt, S. K. , and Nemergut, D. R. , 2015: Fire severity shapes plant colonization effects on bacterial community structure, microbial biomass, and soil enzyme activity in secondary succession of a burned forest. Soil Biology and Biochemistry , 90: 161–168.
- Koyama, A. , Wallenstein, M. D. , Simpson, R. T. , and Moore, J. C. , 2014: Soil bacterial community composition altered by increased nutrient availability in Arctic tundra soils. Frontiers in Microbiology , 5: 516.
- Lamb, E. G. , Kennedy, N. , and Siciliano, S. D. , 2011: Effects of plant species richness and evenness on soil microbial community diversity and function. Plant Soil , 338(1): 483–495.
- Lauber, C. L. , Hamady, M. , Knight, R. , Fierer, N. , 2009: Pyrosequencing-based assessment of soil pH as a predictor of soil bacterial community structure at the continental scale. Applied Environmental Microbiology , 75(15): 5111–5120.
- Leff, J. W. , Jones, S. E. , Prober, S. M. , Barberán, A. , Borer, E. T. , Firn, J. L. , Harpole, W. S. , Hobbie, S. E. , Hofmockel, K. S. , Knops, J. M. H. , McCulley, R. L. , Pierre, K. L. , Risch, A. C. , Seabloom, E. W. , Schütz, M. , Steenbock, C. , Stevens, C. J. , and Fierer, N. , 2015: Consistent responses of soil microbial communities to elevated nutrient inputs in grasslands across the globe. Proceedings of the National Academy of Sciences , 112(35): 10967–10972.
- Lieb, A. M. , Darrouzet-Nardi, A. , and Bowman, W. D. , 2011: Nitrogen deposition decreases acid buffering capacity of alpine soils in the southern Rocky Mountains. Geoderma , 164: 220–224.
- Litaor, M. I. , Williams, M. , and Seastedt, T. R. , 2008: Topographic controls on snow distribution, soil moisture, and species diversity of herbaceous alpine vegetation, Niwot Ridge, Colorado. Journal of Geophysical Research , 113(G2): 2007JG000419.
- Loranger-Merciris, G. , Barthes, L. , Gastine, A. , Leadley, P. , 2006: Rapid effects of plant species diversity and identity on soil microbial communities in experimental grassland ecosystems. Soil Biology and Biochemistry , 38(8): 2336–2343.
- Maestre, F. T. , Delgado-Baquerizo, M. , Jeffries, T. C. , Eldridge, D. J. , Ochoa, V. , Gozalo, B. , Quero, J. L. , García-Gómez, M. , Gallardo, A. , Ulrich, W. , Bowker, M. A. , Arredondo, T. , Barraza-Zepeda, C. , Bran, D. , Florentino, A. , Gaitán, J. , Gutiérrez, J. R. , Huber-Sannwald, E. , Jankju, M. , Mau, R. L. , Miriti, M. , Naseri, K. , Ospina, A. , Stavi, I. , Wang, D. , Woods, N. N. , Yuan, X. , Zaady, E. , and Singh, B. K. , 2015: Increasing aridity reduces soil microbial diversity and abundance in global drylands. Proceedings of the National Academy of Sciences , 112(51): 15684–15689.
- Nemergut, D. R. , Townsend, A. R. , Sattin, S. R. , Freeman, K. R. , Fierer, N. , Neff, J. C. , Bowman, W. D. , Schadt, C. W. , Weintraub, M. N. , and Schmidt, S. K. , 2008: The effects of chronic nitrogen fertilization on alpine tundra soil microbial communities: implications for carbon and nitrogen cycling. Environmental Microbiology , 10: 3093–3105.
- Phoenix, G. K. , Emmett, B. A. , Britton, A. J. , Caporn, S. J. M. , Dise, N. B. , Helliwell, R. , Jones, L. , Leake, J. R. , Leith, I. D. , Sheppard, L. J. , Sowerby, A. , Pilkington, M. G. , Rowe, E. C. , Ashmore, M. R. , and Power, S. A. , 2012: Impacts of atmospheric nitrogen deposition: responses of multiple plant and soil parameters across contrasting ecosystems in long-term field experiments. Global Change Biology , 18(4): 1197–1215.
- SAS [Statistical Analysis System] , 2011: SAS 9.3 User Guide. The GLM procedure, Analysis of covariance. https://support.sas.com/documentation/cdl/en/statug/63962/HTML/default/viewer.htm#statug_glm_sect050.htm. (accessed 29 July 2016).
- Schmidt, S. K. , King, A. J. , Meier, C. L. , Bowman, W. D. , Farrer, E. C. , Suding, K. N. , and Nemergut, D. R. , 2015: Plant-microbe interactions at multiple scales across a high-elevation landscape. Plant Ecology and Diversity , 8: 703–712.
- Seastedt, T. R. , Bowman, W. D. , Caine, N. , McKnight, D. , Townsend, A. , and Williams, M. W. , 2004: The landscape continuum: a conceptual model for high elevation ecosystems. BioScience , 54(2): 111–121.
- Spasojevic, M. J. , Bowman, W. D. , Humphries, H. , Seastedt, T. R. , and Suding, K. N. , 2013: Changes in alpine vegetation over 21 years: Are fine-scale patterns across a heterogeneous landscape consistent with predictions of change? Ecosphere , 4(9): 117.
- Stevens, C. J. , Dise, N. B. , Mountford, J. O. , and Gowing, D. J. , 2004: Impact of nitrogen deposition on the species richness of grasslands. Science , 303(5665): 1876–1879.
- Suding, K. N. , Farrer, E. C. , King, A. J. , Kueppers, L. , and Spasojevic, M. J. , 2015: Vegetation change at high elevation: scale dependence and interactive effects on Niwot Ridge. Plant Ecology and Diversity , 8: 713–725.
- Taylor, R. V. , and Seastedt, T. R. , 1994: Short- and long-term patterns of soil moisture in alpine tundra. Arctic and Alpine Research , 26: 14–20.
- Walker, D. A. , Halfpenny, J. C. , Walker, M. D. , and Wessman, C. A. , 1993: Long-term studies of snow-vegetation interactions. BioScience , 43(5): 287–301.
- Walker, M. D. , Webber, P. J. , Arnold, E. H. , and Ebert-May, D. , 1994: Effects of interannual climate variation on aboveground phytomass in alpine vegetation. Ecology , 75(2): 393–408.
- Williams, M. W. , Seastedt, T. R. , Bowman, W. D. , McKnight, D. , and Suding, K. N. , 2015: An overview of research from a high elevation landscape: the Niwot Ridge, Colorado Long Term Ecological Research programme. Plant Ecology and Diversity , 8: 597–605.
- Yashiro, E. , Pinto-Figueroa, E. , Buri, A. , Spangenberg, J. E. , Adatte, T. , Niculita-Hirzel, H. , Guisan, A. , and van der Meer, J. R. , 2016: Local environmental factors drive divergent grassland soil bacterial communities in the western Swiss Alps. Applied and Environmental Microbiology , 82(21): 6303–6316.
- Yuan, X. , Knelman, J. E. , Gasarch, E. , Wang, D. , Nemergut, D. R. , and Seastedt, T. R. , 2016: Plant community and soil chemistry responses to long-term nitrogen inputs drive changes in alpine tundra soil bacterial communities. Ecology , 97(6): 1543–1554.
- Zak, D. R. , Holmes, W. E. , White, D. C. , Peacock, A. D. , and Tilman, D. , 2003: Plant diversity, soil microbial communities, and ecosystem function: Are there any links? Ecology , 84(8): 2042–2050.
Appendix
TABLE A1 Characteristics of alpine soils studied here. All values measured from samples obtained in 2015 except for pH, which was measured at the time of sampling for soil bacteria in 2013.
TABLE A2 Results of an analysis of covariance (ANCOVA) on all plots (n = 80) using N addition treatment as fixed variable and soil acidity (hydrogen ion concentration) as covariate1. Significant responses are in bold type.
TABLE A3 Results of an analysis of covariance (ANCOVA) on dry and moist plots (n = 64) using N and snow addition treatment as fixed variables and soil acidity (hydrogen ion concentration) as covariate1. Also shown are the P-values for the group responses to snow addition if analyzed with a one-way ANOVA without the other variables, with the direction of the response indicated as (+) or (-). Significant responses are in bold type.