
Timing is Everything
Surface-enhanced laser desorption/ionization time-of-flight mass spectrometry (SELDI-TOF MS) is a robust platform for protein profiling and differential gene expression analysis. The approach relies on the capture of analyte—proteins and peptides—by chemically defined arrays following deposition of crude sample and matrix—small UV-absorbing molecules that transfer energy from a laser source to bound analyte for desorption and ionization. In an investigation of parameters that influence spectral quality and reproducibility, Jock et al. (p.30) investigated the effect of the length of the time interval between sample application and matrix deposition on the array. They identified significant differences in spectral properties related to timing that were specific to conditions of array type, buffer, and matrix composition. This study is a useful examination of quality control parameters and will contribute to the continuing refinement of SELDI-TOF MS as a tool for proteomics analysis.
Surface-enhanced laser desorption/ionization time-of-flight mass spectrometry (SELDI-TOF-MS) allows for the rapid generation of peptide/protein (analyte) profiles from complex biofluids and tissues through the use of chemically modified ProteinChip® arrays (Ciphergen Biosystems, Fremont, CA, USA). These arrays are designed to capture and retain subsets of proteins based on specific protein characteristics such as affinity, charge, hydrophobicity, and metal-binding capabilities. Spectral profiles obtained through the detection of enriched analyte can be compared to uncover patterns of differential abundance (Citation1,Citation2). The use of SELDI-TOF-MS to screen for patterns of differential protein expression has furthered biomarker discovery and aided in the identification of diagnostic patterns of disease and toxicity (Citation3–6).
Although SELDI-TOF-MS is a robust platform for protein profiling, optimization of experimental procedures is required to ensure consistent data output. Confidence that differences in profile patterns specifically reflect changes in protein concentration is dependent in part on spectral reproducibility and quality, and these parameters are affected by multiple variables.
SELDI-TOF-MS, which incorporates matrix-assisted laser desorption/ionization (MALDI), relies on the use of small ultraviolet (UV)-absorbing organic molecules (matrix) to transfer energy from a laser source to an associated analyte for desorption and ionization (Citation7). Therefore, consistency of matrix application and co-crystallization with surface-bound analytes could be critical to the output of consistent spectral data over time. We have been investigating the influence of matrix application timing on the resulting matrix-driven ionization and desorption of peptides/proteins from the array surface. Based on previous observations and data published using the H4 ProteinChip array and sinapinic acid (SPA) (Citation8), we suspected that variation in the matrix/analyte association through array-surface drying time contributes to variability in spectral output. To optimize procedures, a study was devised to determine the impact of drying time prior to matrix application on SELDI-TOF-MS reproducibility and quality across multiple ProteinChip array conditions.
With informed consent, whole blood was collected from healthy human volunteers and processed for serum. Serum was diluted 1/100 in the specified binding buffer for the each ProteinChip array used () and incubated on the array surface for 30 min in a humid chamber. Individual spots were washed with the same binding buffer followed by high-performance liquid chromatography (HPLC)-grade water. Freshly prepared saturated SPA (Ciphergen Biosystems) or 20% α-cyano-4-hydroxy cinnamic acid (CHCA; Ciphergen Biosystems) in 50% acetonitrile (ACN), 0.5% trifluoroacetic acid (TFA) was applied to the ProteinChip arrays after 0, 1, 2, 3, 5, 8, and 10 min of drying time past the final HPLC-grade water wash. This range of drying times was selected based on previous observations and preliminary data. Matrix-applied arrays were allowed to dry completely and stored in a dark, dessicated environment prior to mass spectrum collection. Duplicate spectra were generated using the ProteinChip Reader (Series PBSII; Ciphergen Biosystems) in three replicates. Low (between 0 and 20 kDa) and high (between 0 and 200 kDa) mass data were collected using automated data collection protocols in which laser intensity and detector sensitivity were set so that resulting peak heights fell below a relative intensity of 80 prior to baseline subtraction. Per spot, 130 spectral transient determinations were averaged, and the baseline was subtracted to obtain the final spectral output. Peak count, along with signal-to-noise ratios, were obtained using ProteinChip Software version 3.0 (Ciphergen Biosystems). Matrix peaks (0–1.5 kDa for CHCA and 0–8 kDa for SPA) were excluded, and data were normalized to the peak area. Significant (P < 0.01) differences in mean peak areas from the control (0 h) and in mean signal-to-noise ratios were determined by nonparametric one-way analysis of variance (ANOVA) followed by a Tukey multiple comparison test. Spectral reproducibility was defined as an overall pattern consistency in relation to peak area, whereas spectral quality refers to the measurement of peak count and the overall resolution of peaks compared to baseline (signal-to-noise ratio).
Table 1. Summary of Peak Area Comparisons
Drying time-dependent differences were specific to the condition tested per combination of matrix, ProteinChip array, and buffer. Significant (P < 0.01) drying time-dependent changes in mean peak area were observed when CHCA, but not SPA, was applied to H4, WCX2, and LSAX30 ProteinChip arrays (). Drying times greater than 3 min resulted in an overall loss of peak area when CHCA was applied to the sample-bound arrays, H4 and LSAX30. In contrast, an overall gain in peak area was observed when CHCA was applied for up to 10 min to the sample-bound WCX2 array. However, drying time prior to matrix application did not appear to affect peak area under the remainder of the conditions in which CHCA was applied ().
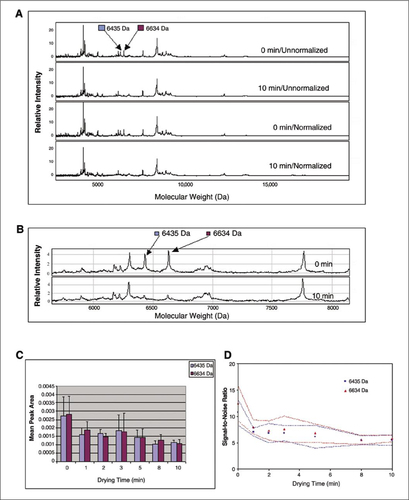
The LSAX30 ProteinChip array data illustrate a significant (P < 0.01) change in peak area (, A–C) and resolution (). Peak area decreased significantly by 8 min of drying time when compared to the control (). The resolution for the two peaks depicted was decreased due to the lowering of the signal-to-noise ratios ().
(A) Representative unnormalized and normalized spectra at time point 0 min and time point 10 min. (B) Expanded view of normalized spectra showing peaks of interest at time point 0 min and time point 10 min. (C) Mean peak area (± sd) representation for two peaks of interest at each drying time. (D) Mean signal-to-noise ratio (± sd) representation for two peaks of interest at each drying time.
The H4 ProteinChip array had six peaks areas that changed significantly (P < 0.01) with extended drying times. Out of the six areas of significance, two peaks showed an increase in peak area and resolution, whereas the remaining four peaks decreased in both parameters (data not shown). Although spectral peak count did not change over time, significant (P < 0.01) changes in peak resolution were detected, showing trends similar to those seen with the LSAX30 array (data not shown).
In contrast to the LSAX30 and H4 data, an overall gain in peak area and resolution was observed when CHCA was applied to the WCX2 ProteinChip array. In this case, eight peaks of interest were found to significantly (P < 0.01) increase in peak area and resolution, while two peaks decreased in the same parameters (data not shown).
Drying time did not impact peak area and resolution under any condition in which SPA was applied to the array surface. This finding is interesting in that results published after this study was completed indicated that SPA applications to the H4 array following 60 min of drying time significantly (P < 0.01) increased reproducibility (Citation8). It is possible that a drying time of longer than 10 min may be required to observe significant differences with the protocol used in this study. It is also important to note that different binding conditions were used to retain analyte on the H4 array surface, which may confound this comparison.
Data reported in this study suggest that both spectrum reproducibility and quality for specific ProteinChip array conditions are impacted by extended drying times prior to matrix application. No clear evidence exists to explain why some conditions and not others are significantly (P < 0.01) affected with respect to peak area and resolution. It is possible that the analyte subsets retained under those conditions in which changes were seen are more susceptible to the matrix/analyte interaction than other subset populations. Those same protein species could also be interacting with the array surface differently over time, resulting in changes in folding during the drying process. Overall, it is imperative that consistency in matrix application timing be maintained to ensure that reproducible, quality spectral data are obtained routinely. With respect to these data, we recommend applying matrix to the ProteinChip arrays within 3 min after the final wash.
References
- Merchant, M. and S.R.Weinberger. 2000. Recent advancements in surface-enhanced laser desorption/ionization-time of flight-mass spectrometry. Electrophoresis21:34–42.
- Fung, E.T., G.L.Wright, and E.A.Dalmasso. 2000. Proteomic strategies for biomarker identification: progress and challenges. Curr. Opin. Mol. Ther.2:643–650.
- Issaq, H.J., T.P.Conrads, D.A.Prieto, R.Tirumalai, and T.D.Veenstra. 2003. SELDI-TOF MS for diagnostic proteomics. Anal. Chem.75:149A–155A.
- Mannes, A.J., B.M.Martin, H.Y.Yang, J.M.Keller, S.Lewin, R.R.Gaiser, and M.J.Iadarola. 2003. Cystatin C as a cerebrospinal fluid biomarker for pain in humans. Pain102:251–256.
- Dare, T.O., H.A.Davies, J.A.Turton, L.Lomas, T.C.Williams, and M.J.York. 2002. Application of surface-enhanced laser desorption/ionization technology to the detection and identification of urinary parvalbumin-α: a biomarker of compound-induced skeletal muscle toxicity in the rat. Electrophoresis23:3241–3251.
- Petricoin, E.F., A.M.Ardekani, B.A.Hitt, P.J.Levine, V.A.Fusaro, S.M.Steinberg, G.B.Mills, C.Simone, et al.. 2002. Use of proteomic patterns in serum to identify ovarian cancer. Lancet359:572–577.
- Beavis, R.C. and B.T.Chait. 1996. Matrix-assisted laser desorption ionization mass-spectrometry of proteins. Methods Enzymol270:519–551.
- Cordingley, H.C., S.L.L.Roberts, P.Tooke, J.R.Armitage, P.W.Lane, W.Wu, and S.E.Wildsmith. 2003. Multifactorial screening design and analysis of SELDI-TOF ProteinChip® array optimization experiments. BioTechniques34:364–373.

