 ?Mathematical formulae have been encoded as MathML and are displayed in this HTML version using MathJax in order to improve their display. Uncheck the box to turn MathJax off. This feature requires Javascript. Click on a formula to zoom.
Abstract
Purpose
Here we describe LifePrint, a sequence alignment-independent k-tuple distance method to estimate relatedness between complete genomes.
Methods
We designed a representative sample of all possible DNA tuples of length 9 (9-tuples). The final sample comprises 1878 tuples (called the LifePrint set of 9-tuples; LPS9) that are distinct from each other by at least two internal and noncontiguous nucleotide differences. For validation of our k-tuple distance method, we analyzed several real and simulated viroid genomes. Using different distance metrics, we scrutinized diverse viroid genomes to estimate the k-tuple distances between these genomic sequences. Then we used the estimated genomic k-tuple distances to construct phylogenetic trees using the neighbor-joining algorithm. A comparison of the accuracy of LPS9 and the previously reported 5-tuple method was made using symmetric differences between the trees estimated from each method and a simulated “true” phylogenetic tree.
Results
The identified optimal search scheme for LPS9 allows only up to two nucleotide differences between each 9-tuple and the scrutinized genome. Similarity search results of simulated viroid genomes indicate that, in most cases, LPS9 is able to detect single-base substitutions between genomes efficiently. Analysis of simulated genomic variants with a high proportion of base substitutions indicates that LPS9 is able to discern relationships between genomic variants with up to 40% of nucleotide substitution.
Conclusion
Our LPS9 method generates more accurate phylogenetic reconstructions than the previously proposed 5-tuples strategy. LPS9-reconstructed trees show higher bootstrap proportion values than distance trees derived from the 5-tuple method.
Introduction
The most used and widespread representations of the evolutionary history of biologic entities are phylogenetic trees. Typically, molecular phylogenetic tree construction starts from a set of sequences (DNA or proteins), computation of a multiple sequence alignment, and then, based on the multiple sequence alignment, construction of a tree using one or several optimization criteria, such as distance, maximum parsimony, minimum evolution, maximum likelihood, and Bayesian inference. Among these criteria, a distance-based method using neighbor-joining (NJ)Citation1 is frequently used because it is considerably faster than character-based methods such as maximum parsimony, maximum likelihood, and Bayesian inference. However, the requirement of using multiple sequence alignment carries some disadvantages for typical tree construction methods. One of the major limitations of multiple alignments arises from the heuristic methods used to calculate the multiple sequence alignment. These heuristic methods can present difficulties in handling long sequences, given that the underlying algorithms have a computational complexity of quadratic order (ie, discrete increases in length of the sequences involve major increases in the time needed to process multiple sequence alignment), which turns out to be impractical in some cases, eg, when analyzing relatedness between complete genomes. Additionally, because multiple sequence alignment often contains a number of homology ambiguities, phylogenetic inferences based on multiple sequence alignment analysis may produce equivocal trees.Citation2,Citation3 Certain types of evolutionary events, like translocations and inversions, are hardly considered and included by multiple sequence alignment analysis. Another drawback of distance-based methods is that they consider only differences between sequences without considering their position. Some common computational programs for multiple sequence alignment construction are MUSCLE,Citation4 DIALIGN 2,Citation5 T-Coffee,Citation6 CLUSTAL W,Citation7 and Kalign.Citation8
Classic phylogenetic surveys at the genomic level are computationally extremely demanding approaches and in some cases may be impractical. To overcome some of these practical limitations, alternative phylogenetic methods have been proposed that are independent of multiple sequence alignment. For example, gene content methods define an evolutionary distance between two genomes based on the percentage of shared homologous genes.Citation9–Citation11 Recently, the use of signature genes corresponding to various taxonomic levels has been successfully tested.Citation12 The compression methods search for exact, approximate, direct, or inverted repeats and measure the similarity of whole genomes based on their relative “compression rate”.Citation13–Citation15 The composition vector method uses informative strings (ie, short nucleotide sequences) to construct phylogenies. An improved selection method extracts the strings with the best absolute relative entropy in a group of carefully sequence-curated strains, and then uses those strings to estimate evolutionary distances. This procedure was successfully applied to human immunodeficiency-1 subtyping using strings of 5–9 nucleotides in length.Citation16 This selection method has been improved statisticallyCitation17 and used to analyze large double-stranded DNA viruses.Citation18
Another multiple sequence alignment-independent method for phylogenetic inference involves the estimation of k-tuple distance (also known as k-mer distance) between sequences. The k-tuple distance between two sequences refers to the sum of the differences in frequency, over all possible tuples of length k, between the sequences. Frequencies of 2-tuples in genomes enabled the creation of a biologically plausible phylogenetic tree for mitochondrial genomes.Citation19 This strategy has also been applied using amino acid strings.Citation20,Citation21 Due to the amount of information to be processed, relatively large memory and central processing unit usage are required for this approach. Consequently, in practice, the k values used have been set to relatively small lengths, such as 5 and 6. Several multiple sequence alignment programs (eg, MUSCLE, CLUSTAL W, and Kalign) compute the k-tuple distance matrix for the sequences to be aligned, then these programs use algorithms such as NJ to construct a “guide tree” quickly that determines the order in which sequences are aligned. However, guide trees are rarely used as final phylogenetic trees, and other packages, such as PHYLIPCitation22 and PAUP,Citation23 are regularly used for this purpose. Recently, it has been shown that a 5-tuple distance method outperformed other distance estimators most of the time and could be at least twice as accurate as other distance estimators.Citation2
Here we characterize and propose LifePrint, a k-tuple distance method that is independent of multiple sequence alignment and only uses a representative sample of all possible tuples of a given length k.
Methods
LifePrint set of 9-tuples
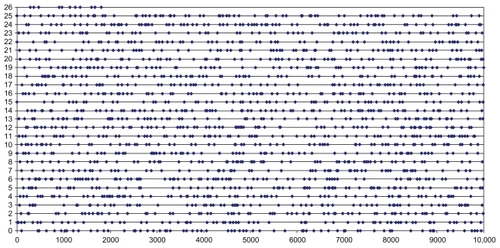
On the basis of previous analyses (Casique-Almazán et al, unpublished data) we observed that tuples of size 9 show optimal performance in the study of viroid genomes. To calculate the k-tuple distance between genomic sequences, we scrutinized real and simulated viroid genomes by similarity searches using a set of 1878 9-tuples. Each 9-tuple sequence of the set was distinct from the others by at least two internal and noncontiguous differences. The group of 1878 9-tuples, called LPS9, is a representative sample of all possible tuples of length 9, ie, 4Citation9 (262,144). illustrates the LPS9 distribution along the complete set of 262,144 9-tuples. LPS9 is available at the Universal Fingerprinting Chip Applications Server (UFCVH site).Citation24 We designed the LPS9 with the Universal program included in the Universal Fingerprinting Chip designer (UFC designer, unpublished manuscript) software. We used the following UFC designer criteria to define LPS9:
Figure 1 Distribution of the LifePrint set of 9-tuples (LPS9) inside the complete set of 9-tuples.a
The substitution criterion: this grouping criterion retrieved 9-tuples that had at least two nucleotide differences between them
The block criterion: this criterion excluded 9-tuples with differences located in the ends; thus, the resulting group comprised sequences showing only internal differences
Refining criterion: tuples sharing contiguous differences were excluded; after applying this criterion, the final set contained sequences showing only noncontiguous differences.
Before applying each of three criteria, the Universal program “randomized” the query 9-tuple sets to diminish potential sampling bias during the grouping process. The sequences and number of the selected tuples depend on the randomization process and, as a consequence, the identified LPS9 set is not unique. However, any other LPS9 selected using this strategy will produce similar results.
Genomic sequences
We used real and simulated viroid genomes as models. The small size of the viroid genomes (approximately 300 nucleotides) facilitated the present analysis. See for the NCBI access numbers of 36 real viroid genomes.
Appendix 1 National Center for Biotechnology Information access numbers of 36 real viroid genomes.
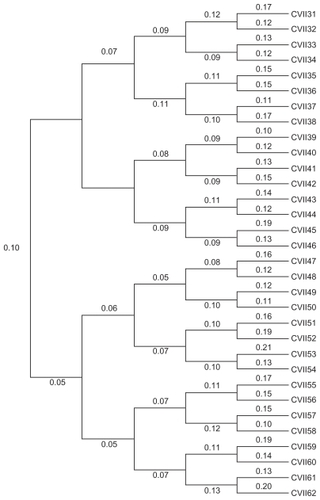
For accuracy of evaluation of differences between LifePrint and other tree construction methods, we used the EvolSeq program (available at the UFCVH site) to simulate the evolution of 32 viroid genomes (named from CVII31 to CVII62) derived from a common ancestor (Citrus viroid II). We used a five-generation evolutionary scheme considering a substitution model with a transition/transversion ratio of 2, as defined in the Kimura 2-parameter model. The 32 simulated viroid genomes were used to reconstruct phylogenetic trees with different methods. The simulated “true” phylogenetic tree (true tree) showing the real phylogenetic relationships between the 32 simulated viroid genomes is shown in . The true tree was used as a reference to evaluate the accuracy of our phylogenetic reconstructions.
Figure 2 True tree.a
Similarity search
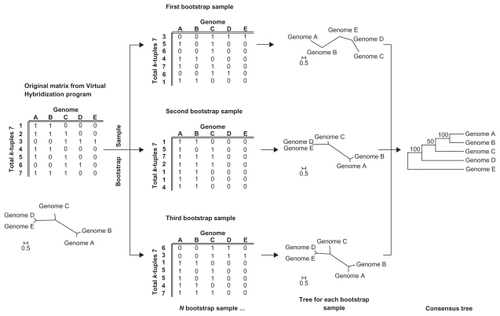
We used the Virtual Hybridization program to scrutinize the real and simulated viroid genomes with the 1878 9-tuples (LPS9). We compared four conditions allowing a distinct number of sequence differences between LPS9 and the 36 genomes, ie, no differences, no differences and allowing one difference, no differences and allowing up to two differences, and no differences and allowing up to three differences. The Virtual Hybridization program produces two different outputs. One is a detailed list of the positions at which each k-tuple is localized in the genomic sequence and a global table with the frequency of occurrences of each tuple in the genomic sequences (global frequency table). Alternatively, the global table can show just the presence (1) or absence (0) of the tuple in the sequences (global binary table). We used both frequency and binary tables to calculate three different kinds of k-tuple distances independently using the Characters program. The Virtual Hybridization and Characters programs are available at the UFCVH site.
Genomic coverage
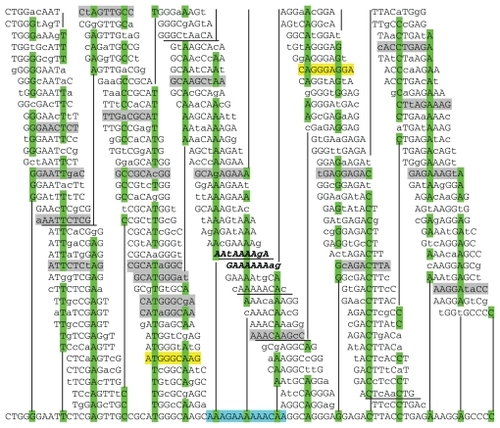
Using LPS9 as the query, we carried out similarity searches to evaluate the capacity of LPS9 to cover viroid genomic sequences entirely. The LPS9 genomic coverage depicted in shows the consensus sequence produced by tiling 9-tuples according to their matching position along the first 80 nucleotides located in the 5′ end of the Hop stunt viroid genome (302 nucleotides in length). Sequence identities and differences are shown in capital and lower case letters, respectively. For this representative analysis, we arbitrarily selected the Hop stunt viroid genome, but similar results were obtained with other genomes analyzed.
Figure 3 Genomic coverage.a
Detection of single base repeats
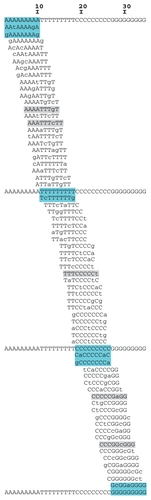
For assessment of the ability of LifePrint to detect single base repeats (homopolymers), we used the sequence AAAAAAAAATTTTTTTTTCCCCCCCCCGGGGGGGGG. shows tiling of 9-tuples according to their matching position along this model.
Figure 4 LifePrint detection of single base repeats.a
Calculating and bootstrapping k-tuple distances
We assumed that different distance metrics have different inherent accuracies for phylogenetic estimation. Here we used three different metrics to calculate k-tuple distances between viroid genomic sequences. First, we used the logarithmic k-tuple distance based on the Jaccard index (dLog), whereby distances based on the Jaccard index only consider tuples shared between genomic sequences, and distances are independent of the tuple frequency in the genome. Second, we used the k-tuple distance based on the Pearson’s correlation coefficient (dPear), which takes into account the frequency of the signals. Third, we used the typical k-tuple distance (dk), which is based on the frequency of occurrence of the tuples in the genomic sequences and considers the length of these.Citation2
The dLog, given two genomes, A and B, was calculated in two steps. First, the Jaccard index (also known as the Jaccard similarity coefficient) was calculated using the formula: J = M11/M01 + M10 + M11, where J is the Jaccard index; M11 is the total number of tuples that occur in both A and B genomes; M01 is the total number of distinctive tuples for B; and M10 is the total number of distinctive tuples for A. Second, the distance value was computed based on the formula: S(A, B) = −1n J/k, where S is k-tuple distance; J is the Jaccard index; and k is the tuple length.
The dPear given two genomes, A and B, was calculated using the formula:
, where r is the Pearson’s correlation coefficient; Ai and Bi correspond to the tuple i’s frequencies in sequences A and B, respectively; and A and B correspond to the average frequencies in sequences A and B, respectively.
The dk for any two sequences, A and B, is calculated using the formula: where Ai and Bi correspond to the tuple i’s frequencies (= counts/n − k + 1) in sequences A and B, respectively; n is the sequence length of either sequence A or B; and k is the tuple length.
To estimate the accuracy of different tree construction methods we also used the Characters program to generate bootstrap replicates by random sampling of the tuple sets. The Characters program produces a matrix with the original k-tuple distances (original file) and a second output comprising the bootstrap replicates calculated from the original matrix (bootstrap file). We selected 1000 replicates in all cases. The general bootstrapping and tree construction strategies are illustrated in .
Figure 5 General bootstrapping scheme for k-tuple distance and tree construction in LifePrint.a
Dynamic range
We evaluated the dynamic range of LPS9, which represents the capability of this particular set to estimate dLog values within a group of sequences with a wide interval of similarity, in such a way that we could distinguish between these sequences. For this survey, we used the Citrus viroid II genome as a reference. Additionally, we simulated sets of 100 genomic variants each. To evaluate the capability for distinguishing between highly related variants, we used two different approaches, called independent and successive, to introduce single base substitutions randomly in a reference genome. Substitutions were simulated using Perl scripts (Active Perl 5.8). Under the independent approach, single random substitutions were introduced in the reference genome, and the k-tuple distance between the reference genome and each variant was measured. In the second approach, successive and accumulative single random substitutions were introduced, and the k-tuple distance between each pair of new and previous variants was measured. For both approaches, we registered the minimum, maximum, and average k-tuple distances.
To better understand LifePrint cases in which single substitutions are located at the 5′ or 3′ ends, we calculated k-tuple distance for two different simulated sets of variants. The first set contained variants with single substitutions at each of the nine positions from 5′ or 3′ ends. The second set comprised variants with accumulative deletions at the 3′ end.
Dynamic range also refers to limit values of similarity between two sequences that can be interpreted to distinguish each other. To evaluate this property, we simulated 15 groups of 100 Citrus viroid II genomic variants with increasing proportion of substitutions. Each variant in a given group was made with the cumulative effect of successive and random single substitutions. The 15 groups were simulated by introduction of 1 (0.5%), 3 (1%), 6 (2%), 9 (3%), 12 (4%), 24 (8%), 36 (12%), 48 (16%), 60 (20%), 72 (24%), 84 (28%), 96 (32%), 120 (40%), 150 (50%), and 200 (66%) successive single base substitutions, respectively. Numbers in parentheses are percentages of substitutions in relation to lengths of the genomic variants (300 nucleotides). The real number of accumulated substitutions in each variant also was determined using another Perl script able to call the water and needle programs from the EMBOSS software.Citation25 Later, the average number of accumulated substitutions was calculated for each group. Perl scripts are available at the UFCVH site.
Accuracy of different tree construction methods
As described in the Genomic sequences section, we simulated the evolution of 32 viroid genomes from the common ancestor Citrus viroid II sequence. We then used the results derived from this simulation to prepare a Newick representation of the true tree manually for further analyses (see below). We visualized and edited the tree () with MEGA 4.0.Citation26 Later, we used the 32 simulated viroid genomes to reconstruct their phylogeny with our LPS9 method and all possible tuples of size 5. All phylogenetic trees in our study are considered unrooted.
As described in the Similarity search section, we used the Virtual Hybridization program to scrutinize the viroid sequences with our k-tuple sets as the query, allowing a defined number of sequence differences. The Virtual Hybridization program locates thermodynamically stable sites for the hybridization of k-tuples within genomic sequences.Citation27 Given that thermodynamic information is not relevant for this study, a free energy cutoff value of 0 was used to identify the matching positions for our k-tuples. For the LPS9 search we allowed up to two sequence mismatches, whereas for 5-tuples only identical matches were allowed. For both the LPS9 and 5-tuple searches, we used the Characters program to calculate the three different kinds of k-tuple distances (see Calculating and bootstrapping k-tuple distances section) from the global tables (binary- and frequency-based). Phylogenetic trees were estimated for each distance table using the NJ method implemented in the Neighbor program of the PHYLIP 3.69 package. Topologies of the resulting 12 NJ trees were contrasted with the true tree to evaluate the accuracy (see Evaluation of accuracy section) of the k-tuple methods.
We used global frequency tables from 36 real viroid genomes and generated bootstrap files for LPS9 and 5-tuples using dPear. We constructed NJ trees using the Neighbor program included in PHYLIP 3.69 package. We then estimated consensus trees ( and ) and subsequently performed visualization and editing with MEGA 4.0.
Figure 6 LifePrint set of 9-tuples (LPS9) bootstrap consensus tree from 36 real viroid genomes (k-tuple distance based on Pearson’s correlation coefficient, 1000 replicates).a
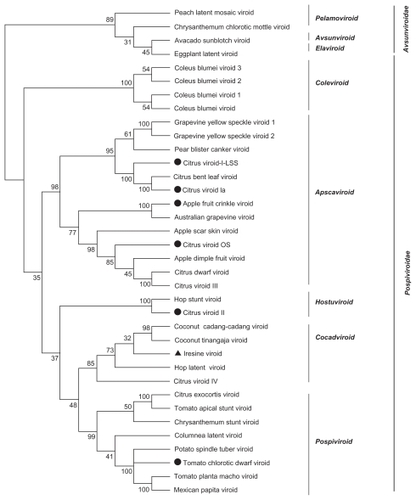
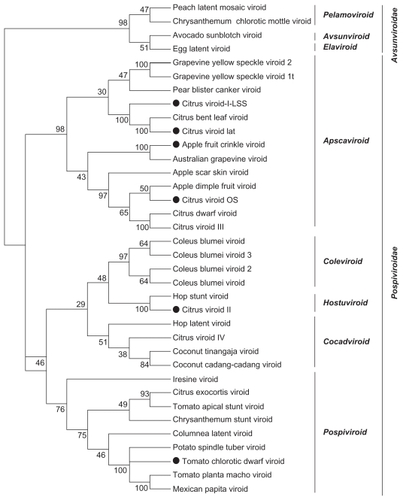
Figure 7 The 5-tuple method bootstrap consensus tree from 36 real viroid genomes (k-tuple distance based on Pearson’s correlation coefficient, 1000 replicates).a
Evaluation of accuracy
We used the symmetric difference between trees to evaluate the accuracy of the different tree construction methods analyzed here. The symmetric difference or topologic distance is a widely used metric to evaluate differences between phylogenetic trees. It has to be mentioned that symmetric difference estimation is independent of the tree branch lengths. For two unrooted bifurcating trees, the symmetric difference is twice the number of interior branches at which the sequence partitions is different between the compared trees.Citation28 Another equivalent definition of symmetric difference is the distance between a pair of trees based on the number of branches that differ between the trees. Thus, symmetric difference is simply a count of how many partitions there are between the two trees compared.Citation29 Briefly, we conducted a paired comparison of each NJ tree against the true tree. We estimated the symmetric difference between the phylogenetic trees using the Treedist program included in the PHYLIP 3.69 package.
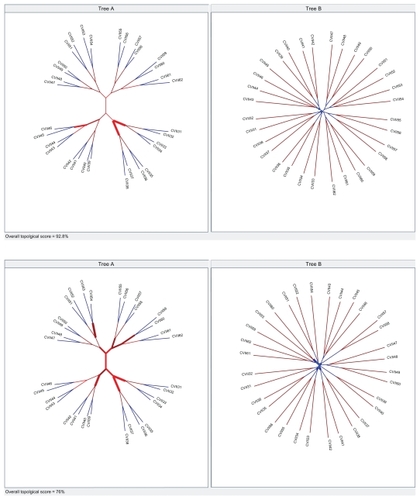
Using the Phylocomparison program,Citation30 we compared the topologies for LPS9 and 5-tuples NJ trees constructed with dPear (from the original Characters file) and the true tree. See for graphic representations of these comparisons.
Appendix II For LPS9 and 5-tuple neighbor-joining trees constructed with dPear (Characters original file) and true tree we compared the topologies using the Phylocomparison program. The first figure compared the topologies of the true tree (Tree A) and the LPS9 N J-dPear tree (Tree B). The second figure compared topologies of true tree (Tree A) and 5-tuple neighbor-joining dPear tree (Tree B). In both figures, thicker lines show a poor match. Topologic score is proportional to line thickness, ie, for major thickness the difference in this clade is bigger. Also, they appear in the low part of the image as overall topologic scores. Observing the figures and overall topologic scores, it can be established that topologic differences are evidently minor between the true tree and the LPS9 NJ-dPear tree.
Finally, we compared bootstrap support values between the consensus NJ trees obtained for the 36 real viroid genomes and the viroid phylogeny proposed in the International Committee on Taxonomy of Viruses.Citation31
Results
LPS9
Our grouping criteria (see Methods) generated the following subsets. After the substitution criterion, the number of 9-tuples diminished from 262,144 to 29,868 tuples (a circa eight-fold reduction). The following block criterion produced 4206 tuples and finally the refining criterion identified the final set of 1878 9-tuples defining LPS9. In , each line represents 10,000 9-tuples. The number of tuples of the LPS9 in every line changes from 64 to 84. On average, a tuple of the LPS9 is selected by every 144 of the complete set of 262,144 9-tuples. The homogeneous distribution of the LPS9 inside the complete set of 9-tuples allowed us to consider it to be a representative sample.
Similarity search
compiles the average number of tuples sharing identity and/or similarity under four different conditions (see Methods). The optimal scheme is reached at condition C (allowing up to two differences). We consider condition C to be our optimal scheme given that the proportion of 9-tuples with identity and/or similarity with the genomes is between 20% and 80% of the LPS9. Under this scheme, we avoid both underutilization and saturation of LPS9. All subsequent similarity searches (with the exception of the Accuracy of different tree construction methods section) were carried out under condition C. In conditions A and B the LPS9 is underutilized, whereas in condition D it reaches saturation.
Table 1 Number of LifePrint sets of identical and/or similar 9-tuples (LPS9) under four different similarity search schemesTable Footnotea
The results of the similarity search included the sequences of the tuples that were sharing identity (no differences) or similarity (one or two differences) with subsequences in the genomes.
Each one of 1878 tuples of the LPS9 scrutinized 352 different sequences (one identical one, 27 allowing one difference, and 324 allowing two differences), which means that 661,056 (1878 × 352) sequences of 9-mer are searched. Given that all possible 9-mer sequences are 262,144, it is expected that every sequence would be searched, on average, 2.5 times. In fact, a genome 300 nucleotides in length, ie, containing 292 subsequences 9-mer, is covered by 605 tuples of the LPS9, which corresponds to an average of 2.05 tuples per sequence.
Genomic coverage
LifePrint has an advantage in comparison with the original k-tuple distance methods, given that, under the optimal similarity search scheme, the tuple length of nine nucleotides provides complete coverage of the analyzed sequences.
shows that in the first 80 nucleotides of the Hop stunt viroid, six 9-mer subsequences were not detected directly by LPS9. The region with minor coverage (from nucleotide numbers 34–46, marked in blue) has a high adenine (A) composition. In addition, this region has three of six subsequences that were not detected directly by LPS9 (beginning at nucleotide numbers 32, 39, and 42). Only two 9-tuples (AATAAAAGA and GAAAAAAAG) shared similarity with this region. Even though LPS9 did not detect all possible 9-mer subsequences directly, our 9-tuple set was capable of fully covering the genomic sequences in this study. Every position within the genomes was recognized by several tuples, which increases the sensibility to detect simple changes. This property is particularly relevant in the case of single nucleotide substitutions.
Detection of single base repeats
Given that the design of LifePrint implies the selection of sequences with a minimum of entropy, LPS9 is not able to identify regions of low complexity (ie, sequence repeats) directly. The results obtained with repeat model sequencing (see Methods) show that two 9-tuples comprising seven with A, one with seven T, two with seven C, and one with seven G (, all in bold type) were capable of detecting subsequences of nine consecutive and identical nucleotides.
How important are low complexity regions to an accurate phylogeny reconstruction? What happen if these regions are not included in the analysis? To answer these questions, it is important to distinguish whether or not the region of interest encodes protein products. Coding or noncoding regions tend to evolve by different mechanisms. When genomic regions encode proteins, even those comprising repeated regions, changes are, in principle, constrained to synonymous substitutions or mutations producing conserved amino acids. In these cases, it is important to consider such regions in the estimation of evolutionary distances, although their impact is also related to the proportion that they represent in the genome, and if they are present in the other genome sequences. However, noncoding regions are not exposed to the same evolutionary pressures as are coding regions. Most mutations are neutral in the noncoding zones, but some substitutions may follow complex evolutionary mechanisms (eg, covariation), such as the case of noncoding sequencing important for other functions (eg, regulation of gene expression).
Dynamic range
Here we selected dLog to identify shared tuples between genomes independently of the frequency that tuples are present in the viroid genomes, and the length of the particular genome. shows the results obtained from independent and successive approaches (see Methods section). Under the independent approach we obtained a value of 0 in a variant with a substitution in the end 3′.
Table 2 k-tuple distance values on single substitutions variantsTable Footnotea
Analysis of variants with substitutions or eliminations located in the 5′ or 3′ ends revealed that only in a few cases were sequence ends presenting punctual changes not detected directly by the LPS9. This result indicates that the ability to discern between variants was not affected. shows k-tuple distance values between variants mentioned above and the Citrus II viroid genome.
Table 3 k-tuple distance values for variants with single substitutions or eliminations located in the ends of sequencesTable Footnotea
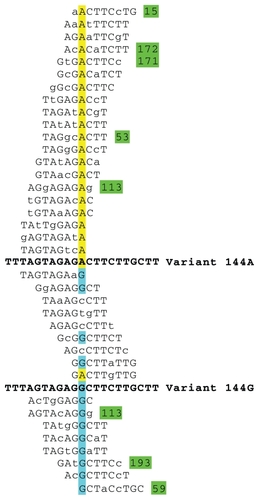
In , the k-tuple average distance for a single substitution presents values from 0.00378 to 0.00390. We examined the list of tuples involved in detecting a simple substitution that implies a k-tuple distance within the mentioned interval. We selected the simulated variant 144 A→G, which presents a k-tuple distance of 0.00390 in relation to the Citrus II viroid genome. In , we list the tuples that detected the substitution A for G in the position 144. It has to be noted that 20 tuples are distinctive in this position, 15 for A and five for G. explains graphically how LPS9 detects efficiently simple substitutions.
Figure 8 Differential detection of variants with a single substitution that implies an average k-tuple distance.a
In order to estimate the limits on the degree of relatedness between two sequences, which putatively will allow us to distinguish between two closely related sequences, the results depicted in indicate that LifePrint reaches saturation at approximately 40% of substitutions. It is expected that when a critical number of variants is included in the phylogenetic study, a given variant considerably distant to another sequence will be closer (eg, more similar) to some other variant. Therefore, the k-distance saturation should not be a limitation for the construction of trees when many strains are included in the analysis.
Table 4 Ability of LifePrint to distinguish between sequences with different degree of relatednessTable Footnotea
Evaluation of accuracy
In , we summarize the results of symmetric difference comparisons between 12 different NJ trees and the true tree (see Construction of trees in Methods section). These results indicate that both methods based on 9-tuples and 5-tuples, respectively, fail to recover the true tree. These findings illustrate that the metric used for the k-tuple distances results in different accuracies of tree reconstruction. See for a graphic representation of topologic comparisons between the true tree and the LPS9 and 5-tuple NJ trees constructed with dPear.
Table 5 Symmetric difference values between true tree and neighbor-joining trees constructed from k-tuple distance based on three different distances metricsTable Footnotea
Visual inspection of the NJ trees from the 36 real viroid genomes indicates that the bootstrap support values are higher for trees reconstructed with the LPS9 method than for trees derived from the 5-tuple method. For both 5-tuple trees and LPS9-based trees, low bootstrap proportion values (less than 30%) were observed in those clades inconsistent with the true tree. Therefore, it seems that the bootstrap test can be used confidently as a proxy to evaluate the accuracy of the reconstruction.
and indicate that although both reconstructions are consistent with each other, bootstrap proportion values are higher for the tree based on 9-tuples. The major viroid families were identified by our 9-tuple methods, although some clusters are organized differently, such as the case of the Avsunviroidae members. However, such conflicts are associated with relatively low bootstrap confidence values.
In our view, branch length comparisons between trees are critical when topologies have been estimated using the same optimization criteria. However, in this particular case, we are evaluating only different k-tuple (LifePrint versus 5-tuple) distance methods including trees from character-based methods, such as maximum likelihood or maximum parsimony, which in our assessment would produce uncertain comparisons, given that each optimization criterion reflects different change measurements in the branch lengths. For the purposes of this work, we consider it adequate to constrain the topologic comparison only between trees obtained with k-tuple distance methods.
Conclusion
Previous studies suggest that phylogenetic reconstructions based on 5-tuples work better than those based on 9-tuples. However, the LifePrint approach is different from the previously described k-tuple method, given that the present method allows a defined number of sequence differences, whereas dk methods search for perfect coincidences. Therefore, the performance is, in principle, different.
Our analyses indicate that distances based on LPS9 enable more accurate reconstructions than distances estimated by the 5-tuples method. Bootstrap support values were also higher for trees reconstructed from LPS9 than for those trees derived from 5-tuples. Moreover, dLog and dPear work better for binary and frequency tables, respectively.
Our results are consistent with previous findings that suggest that k-tuple distance methods are more accurate than phylogenetic methods based on multiple sequence alignment.Citation2 It should be noted that LifePrint uses a representative sample of all possible 9-tuples to estimate distance between genomic sequences. This characteristic will allow us to implement approaches that would save a considerable amount of time for phylogenetic reconstructions using the entire sequence information available in genome-scale data.
However, our results do not provide definitive evidence to distinguish the more accurate k-tuple method tested in this study. As mentioned, the fact that LifePrint allows a certain number of sequence differences, in contrast with the identity of the 5-tuples, may explain discrepancies between these methods. Our results indicate that the accuracy of particular k-tuple reconstruction methods depends on both the length of the target sequences and the similarity between the sequences. In further studies, it will be important to evaluate the relationship between these two factors comprehensively to determine the length and sequence characteristics of the “ideal” k-tuple method, and in parallel to explore its intrinsic accuracy.
Other areas to be explored using our 9-tuple method include the incorporation of position-sensible strategies to identify regions of sequence identity or similarity, and the use of parsimony optimization criteria to estimate trees from our similarity search scheme. Additionally, the use of k-tuple methods using amino acid-based data would be important to analyze protein encoding regions and/or highly divergent related genomes.
Acknowledgment
Support from the National Polytechnic Institute and CONACYT-Mexico for this research is gratefully acknowledged.
Disclosure
The authors report no conflicts of interest in this work.
References
- SaitouNNeiMThe neighbor-joining method: A new method for reconstructing phylogenetic treesMol Biol Evol1987444064253447015
- YangKZhangLPerformance comparison between k-tuple distance and four model-based distances in phylogenetic tree reconstructionNucleic Acids Res2008365e3318296485
- WhelanSInferring treesKeithJMBioinformatics, Volume 1: Data, Sequence Analysis and EvolutionTotowa, NJHumana Press2008
- EdgarRCMUSCLE: Multiple sequence alignment with high accuracy and high throughputNucleic Acids Res20043251792179715034147
- MorgensternBDIALIGN 2: Improvement of the segment-to-segment approach to multiple sequence alignmentBioinformatics199915321121810222408
- NotredameCHigginsDGHeringaJT-Coffee: A novel method for fast and accurate multiple sequence alignmentJ Mol Biol2000302120521710964570
- ThompsonJDHigginsDGGibsonTJCLUSTAL W: Improving the sensitivity of progressive multiple sequence alignment through sequence weighting, position-specific gap penalties and weight matrix choiceNucleic Acids Res19942222467346807984417
- LassmannTSonnhammerELKalign – an accurate and fast multiple sequence alignment algorithmBMC Bioinformatics2005629816343337
- SnelBBorkPHuynenMGenome evolution. Gene fusion versus gene fissionTrends Genet200016191110637623
- HerniouEALuqueTChenXUse of whole genome sequence data to infer baculovirus phylogenyJ Virol200175178117812611483757
- HouseCHFitz-GibbonSTUsing homolog groups to create a whole-genomic tree of free-living organisms: An updateJ Mol Evol200254453954711956692
- DutilhBESnelBEttemaTJHuynenMASignature genes as a phylogenomic toolMol Biol Evol20082581659166718492663
- MilosavljevićADiscovering sequence similarity by the algorithmic significance methodProc Int Conf Intell Syst Mol Biol199312842917584347
- ChenXKwongSLiMA compression algorithm for DNA sequences and its applications in genome comparisonGenome Inform Ser Workshop Genome Inform1999105161
- ChenXLiMMaBTrompJDNA Compress: Fast and effective DNA sequence compressionBioinformatics200218121696169812490460
- WuXCaiZWanXFHoangTGoebelRLinGNucleotide composition string selection in HIV-1 subtyping using whole genomesBioinformatics200723141744175217495995
- LuGZhangSFangXAn improved string composition method for sequence comparisonBMC Bioinformatics20089Suppl 6S1518541050
- GaoLQiJWhole genome molecular phylogeny of large dsDNA viruses using composition vector methodBMC Evol Biol200774117359548
- KarlinSBurgeCDinucleotide relative abundance extremes: A genomic signatureTrends Genet19951172832907482779
- StuartGWMoffettKBakerSIntegrated gene and species phylogenies from unaligned whole genome protein sequencesBioinformatics200218110010811836217
- QiJWangBHaoBIWhole proteome prokaryote phylogeny without sequence alignment: A K-string composition approachJ Mol Evol200458111114743310
- FelsensteinJPHYLIP – Phylogeny Inference Package (Version 3.2)Cladistics19895164166
- SwoffordDLPAUP*.Phylogenetic Analysis Using Parsimony (*and Other Methods).Version 4Sunderland, MASinauer Associates2003
- The Universal Fingerprinting Chip Applications Server Available at: http://biomedbiotec.encb.ipn.mx/UFCVH/Accessed Dec 22, 2010
- RicePLongdenIBleasbyAEMBOSS: The European Molecular Biology Open Software SuiteTrends Genet200016627627710827456
- TamuraKDudleyJNeiMKumarSMEGA4: Molecular Evolutionary Genetics Analysis (MEGA) Software Version 4.0Mol Biol Evol20072481596159917488738
- Reyes-LopezMAMéndez-TenorioAMaldonado-RodríguezRDoktyczMJFlemingJTBeattieKLFingerprinting of prokaryotic 16S rRNA genes using oligodeoxyribonucleotide microarrays and virtual hybridizationNucleic Acids Res200331277978912527788
- NeiMKumarSMolecular Evolution and PhylogeneticsNew York, NYOxford University Press2000
- FelsensteinJInferring PhylogeniesSunderland, MASinauer Associates2003
- NyeTMLiòPGilksWRA novel algorithm and web-based tool for comparing two alternative phylogenetic treesBioinformatics200622111711916234319
- FloresRRandlesJWOwensRABar-JosephMDienerTOSubviral agents: ViroidsFauquetCMMayoMAManiloffJDesselbergerUBallLAVirus Taxonomy. VIIIth Report of the International Committee on Taxonomy of VirusesNew York, NYElsevierAcademic Press2005