
Abstract
Background:
Triple-negative breast cancer (TNBC) is a breast cancer that tests negative for estrogen receptor (ER), progesterone receptors, and human epidermal growth factor receptors 2 (HER2). It is aggressive and invasive in nature and lacks targeted therapy.
Purpose:
The EGFR is frequently overexpressed in TNBC, and the EGFR-overexpressing TNBC presumably escapes EGFR inhibitor therapy by upregulating autophagy and inhibiting apoptosis.
Methods:
To parse the autophagy–apoptosis crosstalk pathway as a potential targeted therapy in TNBC, the activity of an EGFR inhibitor, osimertinib, alone and in combination with an autophagy inhibitor, chloroquine, was examined in EGFR-overexpressing TNBC cell line, MDA-MB-231. The nature of interaction between both drugs at various concentrations was determined by calculating combination indexes (CI) using CompuSyn software. Temporal changes in the expression of the autophagy marker, LC3B-II, and several apoptosis signaling molecules were measured using Western blot and luminex assay with MAGPIX® after exposure to drugs. A synergistic interaction (CI <1) was identified with combinations of 4–6.5 μM osimertinib with 30–75 μM chloroquine.
Results:
A combination of osimertinib (6 μM) with chloroquine (30 μM) resulted in a 6-fold increase of LC3B-II relative to control compared to 2.5-fold increase for either drug alone. The caspase-3 expression increased 2-fold compared to a 0.5-fold decrease with chloroquine and 1.5-fold increase with osimertinib.
Conclusion:
Our results indicate that inhibition of the autophagic flux via chloroquine improves the effectiveness of osimertinib in TNBC cancer cells, warranting further investigations of this combination in vivo.
Introduction
Triple-negative breast cancer (TNBC) is a breast cancer (BC) subtype that is distinct by the absence of three hallmark receptors on the surface of BC cells: estrogen receptor (ER), progesterone receptor, and human epidermal growth factor receptor 2 [HER2]) receptors.Citation1 The therapeutic armamentarium for treating TNBC is limited due to the absence of these three pharmacological targets, and as a result, is managed with conventional chemotherapy. The latter tends to be aggressiveCitation2,Citation3 and leads to therapy resistance, relapse, and ultimately metastases with drug-induced life-threatening toxicities.Citation4 Hence, treatment failure in TNBC is a significant clinical problem, motivating the search for biomarkers as targets for new novel therapeutics.Citation5 Among the potential candidates are therapies that target the EGFR, since EGFR overexpression occurs in the majority of TNBC cases and has been recognized as a factor of poor prognosis for this disease.Citation6–Citation9 In these TNBC patients, EGFR overexpression equates to an increased risk in treatment failure with traditional chemotherapeuticsCitation10 and a decrease in overall survival rate.Citation11 Because a small portion of TNBC responds to anti-EGFR therapy,Citation9 EGFR-targeting tyrosine kinase inhibitors (TKIs) may be considered a rational therapeutic strategy for this population.
Despite evidence for their use in BC, EGFR inhibitors have not demonstrated an adequate benefit-to-risk ratio, presumably due to development of resistance.Citation12 EGFR inhibitors have shown to induce the evolutionary conserved survival mechanism of macroautophagy (autophagy) in a variety of cancer cell lines.Citation13–Citation16 During autophagic flux, the cellular membrane expands (phagophore) to sequester cellular organelles in an autophagosome. The latter fuses with the lysosome to form the autophagolysosome, whose role is to degrade and/or recycle unwanted cytoplasmic material that can be substrates for energy production in cancer cells.Citation17,Citation18 A commonly used marker for assessing the status of autophagic flux is LC3B-II,Citation19 the expression levels of which increase during the processes of formation of the autophagosome (ie, initiation of autophagy) and inhibition of the autophagolysosome. Therefore, to confirm the pharmacological induction of autophagic flux, LC3B-II expression levels must be greater after a dual autophagy initiation/inhibition than by either process acting alone. The LC3B-II expression levels were greater in preclinical models of TNBC overexpressing EGFR after simultaneous exposure to EGFR inhibitors such as gefitinib with autophagy inhibitors such as 3-methyladenineor or bafilomycin A1.Citation14,Citation20 While this finding suggests that inhibition of the EGFR pathway is effective at initiating autophagy, stimulation of autophagy may also contribute to the tumor promotion of TNBC by countering the initiation of apoptosis.Citation14,Citation21,Citation22 To date, mechanisms controlling the crosstalk between autophagy and apoptosis are not fully elucidated. Regulation circuitries involving prosurvival proteins within the PI3K/AKT, pJNK, and p53 signaling pathways are suggested; however, the mechanisms implicated are cell specific.Citation21–Citation26 Therefore, exploring how the molecular players are regulated within the autophagy–apoptosis crosstalk pathway may shed light on the fundamental mechanisms contributing to anti-EGFR treatment failure or success and provide insights into selecting combination agents that enhance the antitumor activity of EGFR inhibitors in TNBC overexpressing EGFR.
The aim of this study was to determine if the autophagy–apoptosis crosstalk pathway is likely a therapeutic target in the treatment of TNBC overexpressing EGFR. The highly aggressive EGFR-overexpressing TNBC cell line, MDA-MB-231, was used as a model cell line.Citation27 The EGFR-targeting TKI, osimertinib, and chloroquine served as pharmacological probes to parse apoptosis/autophagy crosstalk pathway. Changes in cellular and molecular responses after exposure to single and combination agents were monitored. Our study is first to report a synergistic interaction of these two agents in TNBC. The results of this study suggest that inhibiting autophagy is a rational choice for improving the effectiveness of EGFR-inhibiting TKIs in EGFR-overexpressing TNBC.
Materials and methods
Cell culture and reagents
MDA-MB-231 cell line was purchased from the American Type Culture Collection (Manassas, VA, USA) and maintained in DMEM containing 10% sterile filtered FBS (Sigma-Aldrich, Saint Louis, MO, USA) and 1% penicillin/streptomycin. The cells were cultured at 37°C in a 5% CO2 incubator. Osimertinib and chloroquine were purchased from Selleck Chemicals (Houston, TX, USA). Stock solutions of 30 mM (osimertinib) and 100 mM (chloroquine) were prepared in 100% dimethyl sulfoxide (DMSO) and Millipore water, respectively, and stored as 30 μL aliquots at −80 °C.
In vitro cellular viability assay
Cells were seeded in 96-well plates at a density of 2×10³ cells/well in three replicates. Cells were allowed to adhere overnight and then treated with drug. Cells were exposed for 48 hrs to a range of concentrations of either osimertinib (1–12 μM) with a final DMSO concentration of 0.1% DMSO (v/v) or chloroquine (1–100 μM). Relative cell density was measured using cell counting kit-8 assay (CCK-8; Sigma-Aldrich) where, after the desired length of drug exposure, cells were incubated with CCK-8 (10% dilution in 10% FBS DMEM) for 1 hr at 37°C, and absorbance was measured at 450 nm using the Epoch microplate reader (BioTek, Winooski, VT, USA). Percent cell viability was calculated by dividing the absorbance of each treatment by the absorbance of cells grown in drug-free media. The observed data are presented as mean ± SEM using GraphPad Prism Version 5.
Analysis of concentration–effect relationships for single agents
A sigmoidal hill function such as was used to capture the trend of the measured percent cell viability versus drug concentration. R represents the percentage of viable cells in the drug-treated samples relative to cells grown in media, R0 is the baseline level of cell viability at time equal to 0 of percent cell viability, Imax is the maximum drug inhibitory effect fixed to 1 since at large concentrations both agents led to ~100% killing of cancer cells, IC50 is drug concentration that produces half the Imax, γ is the Hill coefficient, and C is the drug concentration. Mathematical modeling was performed using the software Monolix2018R1. The IC50 and γ were estimated as means ± percent of relative standard error (%RSE). The model code is provided as supplementary material (Code S1).
Analysis of concentration-effect relationships for combination therapy
Cells were seeded in quadruplicate using 96-well plates at a density of 5×10³ cells/well. Concentrations used in drugs’ combination studies fell within the model fittings of concentration–response relationships for each agent () that maintained cell viability count when given alone. Cells were allowed to adhere overnight, and then were exposed for 48 hrs to various treatment arms: i) media devoid of drug (control), ii) osimertinib (2.5, 4, and 6.5 µM), iii) chloroquine (10, 30, and 75 µM), and iv) nine different combinations of various concentrations from each drug. The percent cell viability was determined using CCK-8 assay as previously mentioned in “In vitro cellular viability assay” section. In order to determine the overall nature of drug–drug interaction (synergy, additivity, or antagonism) for all nine various combinations, CompuSyn software was used to calculate combination indexes (CIs). Fractional inhibition (Fa = (1 - cell viability)) for concentrations alone and in combination served as inputs for Compusyn as mentioned elsewhere.Citation28,Citation29
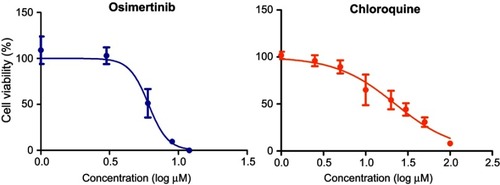
Figure 1 Model fittings of the concentration–effect relationships for single agents. Symbols represent the means of triplicates of observed data and bars represent the SEMs. Lines are model predictions.
Sample collection and intracellular protein extraction
Cells were seeded in triplicate using 6-well plates grown at a density of 3×10⁵ cells/well. Cells were exposed to either osimertinib (6 µM), chloroquine (30 µM), both drugs for 24–48 h,rs or cell culture medium devoid of drug serving as control. Cells were washed with ice-cold PBS, and adhered cells were trypsinized, pooled, centrifuged at 900 rpm for 4 mins, and then washed with PBS. Cells were resuspended in 75 μL ice-cold Milliplex® MAP lysis buffer supplemented with protease/phosphatase inhibitor, shaken in 4°C for 10 mins, incubated on ice for 10 mins, and centrifuged at 10,000 g for 1 min to form a pellet. The supernatant was collected, aliquoted, and stored at −80°C. Total cellular protein content was measured using BCA Protein Assay Kit (Thermo Fisher Scientific Inc., Rockford, IL, USA). Experiments were conducted in triplicate.
Measurement of signaling proteins in the autophagy–apoptosis crosstalk pathway
The change in the expression of the autophagic flux marker LC3B-II was measured using a Western blot technique. Briefly, the primary antibodies used were anti-rabbit LC3B (2775S) and GAPDH (2118S). The secondary antibody used was the anti-rabbit HRP-linked IgG (7074S; Cell Signaling, Danvers, MA, USA). Both primary and secondary antibodies were diluted 1000-fold in PBS with tween (PBST). Approximately 20 µg of total proteins was loaded per lane of 12% MP TGX Stain-Free Gel and transferred onto trans-blot Turbo Mini polyvinylidene difluoride (PVDF) membrane (Bio-Rad, Hercules, CA, USA). The PVDF membrane was blocked using 5% nonfat dry milk in 1⨰ PBST (9809S; Cell Signaling) for 60 mins at room temperature, incubated with primary antibodies overnight with gentle agitation at 4°C, washed with PBST, and incubated with secondary antibody for 1 hr at room temperature. Blots were imaged using chemiluminescence (ECL; Bio-Rad), and densitometric analysis was carried out with ImageLab to quantitate the levels of LC3B-II normalized with GAPDH. LC3B-II/GAPDH of treated cells was further normalized to LC3B-II/GAPDH of control.
The changes in the expression of intracellular proteins in the intrinsic and extrinsic apoptotic signaling pathways were quantified per the manufacturer’s protocols, using the MAGPIX® (Luminex, Austin, TX) multiplexing instrument. GAPDH was measured as a housekeeping protein. The 7-Plex Early Apoptosis Magnetic Bead Kit (EMD Millipore, Chicago, IL, USA) was used. It measures pAkt (pS473), pBad (Ser112), pBcl2 (Ser70), p53 (Ser46), pJNK (Thr183/Tyr185), active caspase-8 (Asp384), active caspase-9 (Asp315) complexed with total GAPDH Magnetic Bead MAPmate, and active caspase-3 Magnetic Bead MAPmate.
Statistical analysis
The GraphPad Prism Version 5 software was used to assess the statistical difference between mean values of various treatment arms controls. The one-way analysis of variance test was used, followed by the Tukey test. The difference between groups was considered statistically significant when p-values were <0.05.
Results
Concentration–effect relationships for single agents and combination
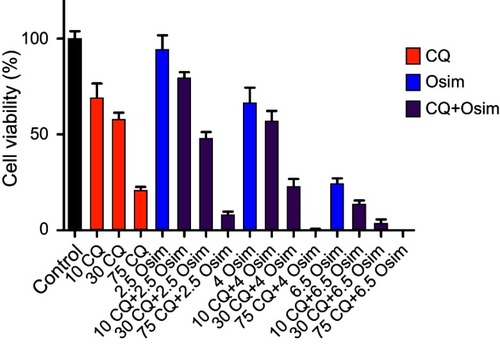
The model fittings of the cell viability response versus osimertinib or chloroquine concentrations are represented in . The model fitted parameters for osimertinib and chloroquine concentration–effect relationships are summarized in . Our findings indicate that osimertinib is a more potent inhibitor of MDA-MB-231 cell viability than chloroquine, as indicated by its lower IC50 value (6.3 vs 26.3 µM). The cell viability responses measured 48 hrs post simultaneous combination of various concentrations of osimertinib and chloroquine are depicted in . Our results reveal a more pronounced decrease in cell viability at higher drugs concentrations, indicating a concentration-dependent cell killing for both agents.
Table 1 Model-estimated parameters for the concentration–effect relationships of single agents. Parameters are reported as mean values and precisions are reported as the percentage of relative standard error (%RSE)
Figure 2 Cell viability response of MDA-MB-231 cells normalized to control after 48 hrs exposure to chloroquine (CQ) and osimertinib (Osim) combinations, and to cell culture medium devoid of drug (control). Each bar represents the mean of four replicates of observed data ± SEM.
Fa was calculated for Osim (2.5, 4, and 6.5 µM) and CQ (10, 30, and 75 µM) alone and in combination. For each drug combination, Compusyn calculates dose-reduction index (DRI) where DRI=1, >1, and <1 indicated no dose reduction, a favorable dose reduction, and no favorable dose reduction, respectively (). The numerical values of the CIs calculated using CompuSyn software are summarized in . The nature of drug–drug interaction between osimertinib and chloroquine is interpreted as synergistic (CI<1), additive (CI=1), or antagonistic (CI>1). Our analysis indicates
Table 2 Combination indexes (CIs) calculated for the various concentrations of osimertinib/chloroquine association therapy
s that a synergistic interaction between osimertinib and chloroquine is reached at either a fixed concentration of chloroquine at 75 µM with varying concentrations of osimertinib or a fixed concentration of osimertinib at 6.5 µM with varying concentrations of chloroquine. Additionally, the lowest value for the CI is obtained at the tested concentrations of 4 µM for osimertinib with 75 µM for chloroquine. These findings support the conclusion that synergism between both drugs is achieved in a concentration-dependent manner and that the optimized concentrations for synergism between osimertinib and chloroquine are 4 and 75 µM.
Effects of single agents and combination on autophagy
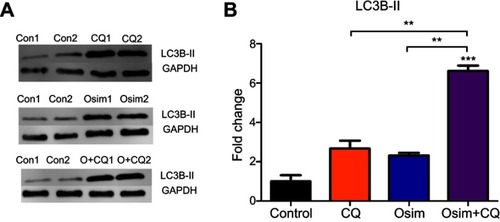
Compusyn analysis revealed that when chloroquine concentration was fixed to 30 µM, osimertinib yields synergism at concentrations >4 µM. To ensure an adequate concentration of analyte for analysis on Western blot and Magpix, 6 uM osimertinib was used alone and in combination with 30 µM chloroquine. Autophagy response was determined by examining the changes in LC3B-II/GAPDH upon exposure of MDA-MB-231 cells to an autophagy stimulator, osimertinib, in the presence and absence of an autophagy inhibitor, chloroquine.Citation30 When the autophagic flux is occurring, LC3B-II expression levels are larger after co-administration of both agents – an autophagy stimulator and autophagy inhibitor – when compared to either agent alone.Citation19 The relative expression of LC3B-II to control is approximately 2-fold greater post osimertinib treatment than chloroquine and 6-fold higher in the combination than either agent alone or control as shown in . The increased levels of LC3B-II after exposure to combination suggest that both drugs act oppositely on autophagy. While osimertinib induces the formation of the autophagosome, chloroquine inhibits its elimination. These mechanisms are yet to be fully elucidated.
Figure 3 Fold change from control (no treatment) of LC3B-II in MDA-MB-231 after exposure to chloroquine (CQ), osimertinib (Osim), and combination (O+CQ). MDA-MB-231 cells exposed to control (Con) as drug-free cell culture medium, CQ (30 μM), Osim (6 μM), or the combination over 24 hrs. LC3B-II and GAPDH were measured using Western blot. Each bar represents a mean from duplicate observed data ± SEM. **p<0.01, ***p<0.001.
Effects of single agents and combination on the autophagy–apoptosis crosstalk pathway
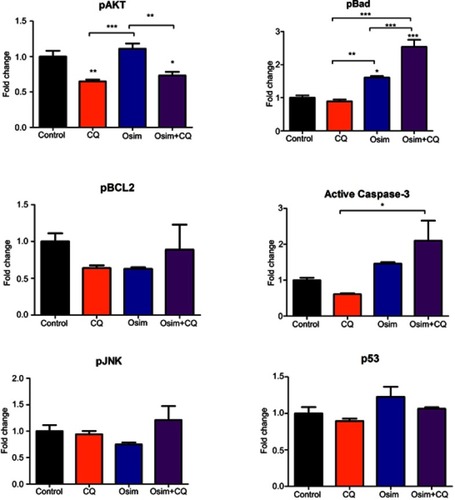
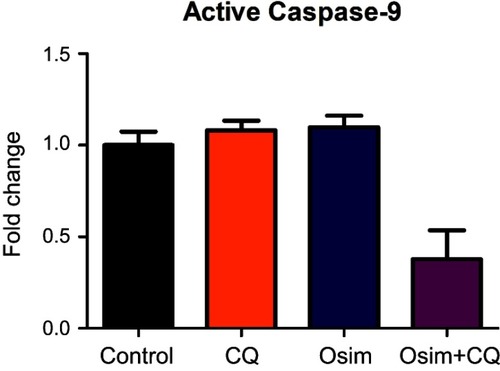
To assess the effects of single agents osimertinib and chloroquine, and their combinations on apoptosis in MDA-MB-231 cells, we measured the levels of active caspase-3, the predominant apoptotic signaling biomarker. The measured fold changes from control in the expression of intracellular proteins within the apoptosis/autophagy crosstalk signaling pathway, including pAKT, pBCL2, pJNK, pBad, caspase-3, and p53, are depicted in . The protein pAKT decreased by approximately 0.25-fold relative to control after treatment with chloroquine alone or in combination with osimertinib, but no statistically significant change was observed after exposure to osimertinib alone. No changes from control were observed in the expression of the protein pBad following exposure to chloroquine; however, it increased by approximately 1.75- and 2.5-fold after exposure to osimertinib and combination. The protein pBCL2 decreased by approximately 0.25-fold relative to control after exposure to chloroquine or osimertinib alone; however, no changes in pBCL2 protein were observed after exposure to the combination. Changes in expression of active caspase-3 compared to control were approximately 1.5-fold higher after exposure to osimertinib, and approximately 0.5-fold lower after exposure to chloroquine. Active caspase-3 was approximately 2-fold higher than control after exposure to the combination, with a statistically significant difference observed between chloroquine and combination groups. There were no statistically significant changes in pJNK and p53 after exposure to chloroquine, osimertinib, or combination. Changes were observed in the levels of neither active caspase-9, a marker of the extrinsic apoptosis pathway,Citation31 () nor active caspase-8 protein, a marker of the intrinsic apoptosis pathway.
Figure 4 Fold change from control in the expression of signaling proteins in the autophagy–apoptosis crosstalk pathway of MDA-MB-231 cells. Cells were exposed for 48 hrs to chloroquine (CQ, 30 μM), osimertinib (Osim, 6 μM), combination, or control. Each bar represents the mean of four replicates of observed data ± SEM *p<0.05, **p<0.01, ***p<0.001.
Discussion
TKIs represent a rapidly expanding group of oncology drugs due to their targeted anticancer mechanism of action and favorable safety profile compared to conventional chemotherapeutics.Citation32 Osimertinib was awarded a breakthrough therapy designation by the US Food and Drug Administration in 2017 for its use as a first-line treatment in metastatic NSCLC with EGFR+ mutations.Citation33,Citation34 Like NSCLC, EGFR+ mutations have also been observed in a small subgroup of TNBC.Citation7,Citation8,Citation35 Additionally, osimertinib demonstrates binding to wild-type EGFR.Citation36 For aggressive TNBC overexpressing EGFR,Citation6–Citation8,Citation10,Citation11 EGFR inhibitors such as osimertinib represent a promising therapeutic option, but acquired resistance mechanisms to anti-EGFR therapy must first be overcome before their application in TNBC can be considered clinically.Citation37
A recent study published by Liu et alCitation14 examining gefitinib anticancer activity in combination with autophagy inhibitors was conducted on two EGFR-expressing TNBC cell lines, MDA-MB-231 and MDA-MB-468. The addition of the autophagy inhibitors to gefitinib significantly improved gefitinib killing in both cancer cells lines. These cell lines report having different sensitivities to cancer therapy, with MDA-MB-231 being much less sensitive to traditional chemotherapy than MDA-MB-468.Citation38 Considering the inherent risk of TNBC becoming resistant to traditional chemotherapyCitation10 and the highly aggressive and invasive features of MDA-MB-231 cells,Citation27 the latter cell line represents a unique preclinical model of metastatic TNBC.
Compusyn was used to calculate CI because it utilizes well-established algorithms to provide automated quantitative indices of interaction. Innumerable studies have utilized this approach for drug combination studies.Citation28,Citation29 Our study in MDA-MB-231 cells showed that the combination of osimertinib with chloroquine is synergistic and that the intensity of synergism increases with increasing drug concentrations in the TNBC cell line, MDA-MB-231. Because reductions in the viability of cancer cells were observed at all concentrations tested for osimertinib (), the synergy observed from the addition of chloroquine may emanate from chloroquine increasing the sensitivity of MDA-MB-231 cells to osimertinib. One explanation for the sensitizing effect of chloroquine on cancer cells is through its inhibitory action on autophagy. EGFR inhibitors are reported to increase autophagic flux in a variety of cells,Citation14,Citation15,Citation20,Citation39 leading to energy conservation and autophagy induction.Citation13–Citation17 Inhibiting autophagy has shown to overcome resistance to TKI in cancer such as NSCLC,Citation20 non-TNBC breast cancer,Citation39 and cervical cancer.Citation15 Considering that inhibition of autophagy is proven to improve the effectiveness of TKIs in TNBC,Citation14 we proposed this mechanism for chloroquine at enhancing the efficaciousness of osimertinib.
To demonstrate that autophagic flux is induced by osimertinib, we examined the changes in the expression of an autophagy marker, LC3B-II, after exposure of MDA-MB-231 cells to osomertinib (autophagy stimulator) with and without chloroquine (autophagy inhibitor). During autophagic flux, changes in the expression of LC3B-II are expected to be greater compared to the use of either an autophagy stimulator or an inhibitor. Chloroquine alkalizes the autophagolysosome, thereby inhibiting the terminal phase of autophagic flux and decreasing the degradation of LC3B-II.Citation30 MDA-MB-231 has a high level of tumor-derived LC3B-II which provides a strong baseline signal.Citation40 The increase from control in the expression of LC3B-II observed in our combinatorial study of osimertinib with chloroquine is consistent with previous autophagy studies.Citation14,Citation20 Liu et alCitation14 reported this increase in MDA-MB-231 cells following the combination of the first generation of EGFR inhibitors, gefitinib, with the autophagy inhibitor Baf.A. Comparable to our results, LC3B-II expression levels were higher in the combination than either agent. Similarly, Tang et alCitation20 exposed NSCLC cells to osimertinib and chloroquine. Their results showed a greater accumulation of LC3B-II after exposure to the combination as compared to single agents. Taken together, osimertinib and chloroquine act oppositely on autophagy in MDA-MB-231 cells.
The combination of autophagy inhibitors with TKIs is proven efficacious at killing cancer cells.Citation14,Citation41 One explanation is that autophagy and apoptosis are two parallel and antagonistic processes occurring in a cell where autophagy inhibition leads to a rise in apoptosis and vice versa.Citation14,Citation21,Citation22 We observed an increase in active caspase-3 after treatment with single-agent osimertinib as shown in , suggesting an increase in apoptosis. This result is expected, given that EGFR inhibition will ultimately result in cell death. Conversely, we noticed a slight decrease in active caspase-3 after treatment with single-agent chloroquine; however, this is not statistically significant compared to control (P>0.05). The greatest increase from control in the expression of active caspase-3 occurred after combination of osimertinib with chloroquine, confirming our conclusion that increased apoptosis occurs when autophagy is inhibited.
The role of autophagy in oncogenic survival or killing may be context dependent.Citation24 To further elaborate on the mechanism by which synergy between osimertinib and chloroquine may occur, we evaluated intracellular proteins within our proposed autophagy–apoptosis crosstalk signaling pathway.Citation21,Citation22 Magpix® utilizes fluorescent-coded magnetic beads coated with specific capture antibodies allowing for multiplexing of analyte-specific capture antibodies. Utilizing Magpix® allowed for faster and simultaneous quantification for multiple targets as compared to Western blot. Of the proposed players within the crosstalk pathway, pAKT protein falls downstream of EGFRCitation42 and plays a role in the cell-cycle progression.Citation43 Inducible pAKT activity promotes TNBC resistance to chemotherapy,Citation44 and pharmacological inactivation of pAKT promotes synergistic cancer cell killing with TKIs.Citation45,Citation46 Because changes from control of pAKT increased after exposure to osimertinib, and that they decreased after exposure to chloroquine or to combination therapy, the inhibition of pAKT by chloroquine may sensitize TNBC to EGFR therapy. Downstream of pAKT, pBad functions as an antiapoptotic protein.Citation47 pBad increased after exposure to osimertinib alone and with combination, suggesting the increase of a prosurvival pathway. Inhibition of the pAkt pathway and stimulation of pBad appear to be two complementary mechanisms regulated upstream in the apoptosis pathway.
Downstream of pBad, the BCL2 functions as an antiapoptotic protein.Citation48 Phosphorylation of BCL2 is required for the antiapoptotic activity of BCL2.Citation49 A decrease in pBCL2, although not significant, occurred after exposure to chloroquine and may be related to chloroquine inhibitory action on autophagy. Wei et alCitation22 demonstrated that breast cancer cells undergoing autophagy expressed elevated levels of pBCL2; therefore, inhibition of autophagy may also explain the decline in pBCL2 after chloroquine exposure. pBCL2 also decreased after exposure to osimertinib, which may be explained by a negative feedback initiated via an increase in active caspase-3.Citation49 However, further examination into the role of pBCL2 in the apoptosis/autophagy crosstalk is warranted.
Co-formulating EGFR inhibitors with autophagy inhibitors appears to be a promising method for improving anticancer response to treatment.Citation14,Citation50,Citation51 Chloroquine has a well-established pharmacokinetic and safety profiles. Its potential as a repurposed oncology therapeutic is feasible.Citation52 Our study suggests that chloroquine sensitizes MDA-MB-231 to osimertinib exposure. This combination induced synergy in a concentration-dependent manner. Because osimertinib stimulates autophagy and chloroquine inhibits autophagy, we conclude that the enhanced antitumor effect of their combination is due to chloroquine sensitizing MDA-MB-231 cells to osimertinib by inhibiting the autophagic survival mechanisms induced by osimertinib. Finally, of all the examined intracellular proteins in the autophagy–apoptosis crosstalk pathway, pAKT and pBad signaling appears to play a major role. Inhibition of pAKT may help explain the synergism resulting from the combination of osimertinib with chloroquine.
The current study was performed in a static manner with MDA-MB231 cell treated with single and combination drugs for 48 hrs. Further time-kinetic studies examining various molecular players over a time course are warranted. The latter may provide a better insight into the temporal dynamics of autophagy–apoptosis crosstalk signaling pathway. Furthermore, considering the heterogeneity of TNBC with many subtypes classified following various molecular aberrations ,Citation38 additional studies on other TNBC cell lines are desired to evaluate and potentially confirm the observed results across TNBC subtypes.
Conclusion
In this work, we report that the combination osimertinib with chloroquine is synergistic and involves a crosstalk between autophagy and apoptosis, in MDA-MB-231. Our findings support the rationale for combining EGFR inhibitors with autophagy inhibitors in TNBC.
Abbreviations list
TNBC, triple-negative breast cancer; ER, estrogen receptor; PR, progesterone receptor; HER2, human epidermal growth factor receptor 2; EGFR, epidermal growth factor receptor; TKI, tyrosine kinase inhibitor; EGFRm+, mutation-positive EGFR; NSCLC, non-small cell lung cancer; CQ, chloroquine; Osim, osimertinib; IC50, half the maximal response from the drug; Imax, maximum amount of inhibition from the drug concentration; γ, hill coefficient of the drug; R0, cell viability with no drug present; CCK-8, cell counting kit-8 assay; PBST, PBS with tween; ECL, chemiluminescence; Fa, fractional inhibition; DRI , dose-reduction index.
Author contributions
All authors contributed to data analysis, drafting or revising the article, gave final approval of the version to be published, and agree to be accountable for all aspects of the work.
Disclosure
The authors report no potential conflicts of interests in this work.
Supplementary materials
Figure S1 Values used by Compusyn to calculate synergy between Osim and CQ. Fa was calculated for Osim (2.5, 4, and 6.5 µM) and CQ (10, 30, and 75 µM) alone and combination. For each drug combination DRI was calculated where DRI=1, >1, and <1 indicated no dose reduction, a favorable dose reduction, and no favorable dose reduction, respectively. Mean ± SEM was plotted using GraphPad Prism Version 5. Bars represent the mean on quadruplets observed data with SEM.
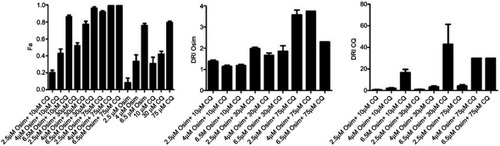
Figure S2 Effects of CQ, Osim, and combination on apoptosis players in MDA-MB-231. MDA-MB-231 cells were exposed to media devoid of drug (control), 30 μM CQ, 6 μM Osim, or combination over 48 hrs. Active caspase-9/GAPDH measured using Western blot, and signal was taken with respect to control. Mean ± SEM was plotted using GraphPad Prism Version 5. Bars represent the mean on quadruplets observed data with SEM.
Code S1. Concentration effect of chloroquine or osimertinib coded in Monolix2018R as sigmoidal Hill function. Drug concentration (C) and percent cell viability (E) served as drug-specific input. The maximum amount of inhibition from the drug concentration (Imax) and percent cell viability with no drug present (R0) were fixed at 100 and 1, respectively. Drug concentration that produces half the maximal response from the drug (IC50) and Hill coefficient of the drug (gamma).
[LONGITUDINAL]
input = {Imax, IC50, S0, gamma}
EQUATION:
E = R0-(Imax*C^gamma/((C^gamma)+(IC50^gamma)))
OUTPUT:
output = E
References
- PodoF, BuydensLMC, DeganiH, et al. Triple-negative breast cancer: present challenges and new perspectives. Mol Oncol. 2010;4(3):209–229. doi:10.1016/j.molonc.2010.04.00620537966
- SiegelR, MaJ, ZouZ, JemalA. Cancer statistics, 2014. CA Cancer J Clin. 2014;64(1):9–29. doi:10.3322/caac.2120824399786
- BenderRJ, Mac GabhannF. Expression of VEGF and semaphorin genes define subgroups of triple negative breast cancer. PLoS One. 2013;8(5):e61788. doi:10.1371/journal.pone.006178823667446
- PerouCM. Molecular stratification of triple-negative breast cancers. Oncologist. 2011;16(Suppl 1):61–70. doi:10.1634/theoncologist.2011-S1-61
- FleisherB, ClarkeC, Ait-OudhiaS. Current advances in biomarkers for targeted therapy in triple-negative breast cancer. Breast Cancer (Dove Med Press). 2016;8:183–197. doi:10.2147/BCTT.S11465927785100
- MonteroJC, Esparís-OgandoA, Re-LouhauMF, et al. Active kinase profiling, genetic and pharmacological data define mTOR as an important common target in triple-negative breast cancer. Oncogene. 2014;33(2):148–156. doi:10.1038/onc.2012.57223246963
- ParkHS, JangMH, KimEJ, et al. High EGFR gene copy number predicts poor outcome in triple-negative breast cancer. Mod Pathol. 2014;27(9):1212–1222. doi:10.1038/modpathol.2013.25124406864
- TanDS, MarchióC, JonesRL, et al. Triple negative breast cancer: molecular profiling and prognostic impact in adjuvant anthracycline-treated patients. Breast Cancer Res Treat. 2008;111(1):27–44. doi:10.1007/s10549-007-9756-817922188
- NielsenTO, StegnerAL, Wagner-MannC, Du BoisGC, AlexanderS, SauterER. Immunohistochemical and clinical characterization of the basal-like subtype of invasive breast carcinoma. Clin Cancer Res. 2004;10. doi:10.1158/1078-0432.CCR-04-1002
- Nogi H, Kobayashi T, Suzuki M, et al.EGFR as paradoxical predictor of chemosensitivity and outcome among triple-negative breast cancer. Oncology Reports. 2009;21(2):413-417.
- CheangMC, VoducD, BajdikC, et al. Basal-like breast cancer defined by five biomarkers has superior prognostic value than triple-negative phenotype. Clin Cancer Res. 2008;14(5):1368–1376. doi:10.1158/1078-0432.CCR-07-165818316557
- NakaiK, HungMC, YamaguchiH. A perspective on anti-EGFR therapies targeting triple-negative breast cancer. Am J Cancer Res. 2016;6(8):1609–1623.27648353
- TanX, ThapaN, SunY, AndersonRA. A kinase-independent role for EGF receptor in autophagy initiation. Cell. 2015;160(1–2):145–160. doi:10.1016/j.cell.2014.12.00625594178
- LiuZ, HeK, MaQ, et al. Autophagy inhibitor facilitates gefitinib sensitivity in vitro and in vivo by activating mitochondrial apoptosis in triple negative breast cancer. PLoS One. 2017;12(5):e0177694. doi:10.1371/journal.pone.017769428531218
- FungC, ChenX, GrandisJR, DuvvuriU. EGFR tyrosine kinase inhibition induces autophagy in cancer cells. Cancer Biol Ther. 2012;13(14):1417–1424. doi:10.4161/cbt.2200222954701
- JuttenB, RouschopKM. EGFR signaling and autophagy dependence for growth, survival, and therapy resistance. Cell Cycle. 2014;13(1):42–51. doi:10.4161/cc.2751824335351
- MaiuriMC, ZalckvarE, KimchiA, KroemerG. Self-eating and self-killing: crosstalk between autophagy and apoptosis. Nat Rev Mol Cell Biol. 2007;8(9):741–752. doi:10.1038/nrm223917717517
- KimuraT, TakabatakeY, TakahashiA, IsakaY. Chloroquine in cancer therapy: a double-edged sword of autophagy. Cancer Res. 2013;73(1):3–7. doi:10.1158/0008-5472.CAN-12-246423288916
- KlionskyD.J., AbdelmohsenK AbeA. et al. Guidelines for the use and interpretation of assays for monitoring autophagy (3rd edition). Autophagy. 2016;12(1):1–222.26799652
- TangZ-H, CaoW-X, SuM-X, ChenX, Lu-J-J. Osimertinib induces autophagy and apoptosis via reactive oxygen species generation in non-small cell lung cancer cells. Toxicol Appl Pharmacol. 2017;321:18–26. doi:10.1016/j.taap.2017.02.01728237877
- WirawanE, Vande WalleL, KersseK, et al. Caspase-mediated cleavage of Beclin-1 inactivates Beclin-1-induced autophagy and enhances apoptosis by promoting the release of proapoptotic factors from mitochondria. Cell Death Dis. 2010;1(1):e18. doi:10.1038/cddis.2009.1621364619
- WeiY, PattingreS, SinhaS, BassikM, LevineB. JNK1-mediated phosphorylation of Bcl-2 regulates starvation-induced autophagy. Mol Cell. 2008;30(6):678–688. doi:10.1016/j.molcel.2008.06.00118570871
- SuZ, SkahS, UglandH, et al. Apoptosis, autophagy, necroptosis, and cancer metastasis. Mol Cancer. 2015;14:48. doi:10.1186/s12943-014-0278-925743109
- NikoletopoulouV, MarkakiM, PalikarasK, TavernarakisN. Crosstalk between apoptosis, necrosis and autophagy. Biochim Biophys Acta. 2013;1833(12):3448–3459. doi:10.1016/j.bbamcr.2013.06.00123770045
- WangX, ChaoL, LiX, et al. Elevated expression of phosphorylated c-Jun NH2-terminal kinase in basal-like and “triple-negative” breast cancers. Hum Pathol. 2010;41(3):401–406. doi:10.1016/j.humpath.2009.08.01819913278
- HainesE, SchliengerS, ClaingA. The small GTPase ADP-ribosylation factor 1 mediates the sensitivity of triple negative breast cancer cells to EGFR tyrosine kinase inhibitors. Cancer Biol Ther. 2015;16(10):1535–1547. doi:10.1080/15384047.2015.107173726176330
- Espinoza-SanchezNA, VadilloE, BalandránJC, Monroy-GarcíaA, PelayoR, Fuentes-PananáEM. Evidence of lateral transmission of aggressive features between different types of breast cancer cells. Int J Oncol. 2017;51(5):1482–1496. doi:10.3892/ijo.2017.412829048610
- ZhangN, FuJ-N, ChouT-C. Synergistic combination of microtubule targeting anticancer fludelone with cytoprotective panaxytriol derived from panax ginseng against MX-1 cells in vitro: experimental design and data analysis using the combination index method. Am J Cancer Res. 2016;6(1):97–104.27073727
- ChouTC. Drug combination studies and their synergy quantification using the Chou-Talalay method. Cancer Res. 2010;70(2):440–446. doi:10.1158/0008-5472.CAN-09-194720068163
- YangYP, HuL-F, ZhengH-F, et al. Application and interpretation of current autophagy inhibitors and activators. Acta Pharmacol Sin. 2013;34(5):625–635. doi:10.1038/aps.2013.523524572
- TaitSW, GreenDR. Mitochondria and cell death: outer membrane permeabilization and beyond. Nat Rev Mol Cell Biol. 2010;11(9):621–632. doi:10.1038/nrm295220683470
- FleisherB, UnumJ, ShaoJ, AnG. Ingredients in fruit juices interact with dasatinib through inhibition of BCRP: a new mechanism of beverage-drug interaction. J Pharm Sci. 2015;104(1):266–275. doi:10.1002/jps.2428925418056
- Tagrisso Granted Breakthrough Therapy Designation by US FDA for the 1st-Line Treatment of Patients with EGFR Mutation-Positive Non-Small Cell Lung Cancer. 2017; Available from: https://www.astrazeneca.com/content/astraz/media-centre/press-releases/2017/tagrisso-granted-breakthrough-therapy-designation-by-us-fda-for-the-1st-line-treatment-of-patients-with-egfr-mutation-positive-non-small-cell-lung-cancer-09102017.html. Accessed November 11, 2018.
- SoriaJC, OheY, VansteenkisteJ, et al. Osimertinib in untreated EGFR-mutated advanced non-small-cell lung cancer. N Engl J Med. 2018;378(2):113–125. doi:10.1056/NEJMoa171313729151359
- VoraHH, PatelNA, ThakorePM, ShuklaSN. Immunohistochemical localization of wild-type EGFR, E746-A750 frame deletion in exon 19, and L858R point mutation in exon 21 in triple-negative breast cancer. Appl Immunohistochem Mol Morphol. 2015;23(9):653–660. doi:10.1097/PAI.000000000000012725789532
- CrossDA, AshtonSE, GhiorghiuS, et al. AZD9291, an irreversible EGFR TKI, overcomes T790M-mediated resistance to EGFR inhibitors in lung cancer. Cancer Discov. 2014;4(9):1046–1061. doi:10.1158/2159-8290.CD-14-033724893891
- WendtMK, WilliamsWK, PascuzziPE, et al. The antitumorigenic function of EGFR in metastatic breast cancer is regulated by expression of Mig6. Neoplasia. 2015;17(1):124–133. doi:10.1016/j.neo.2014.11.00925622905
- LehmannBD, BauerJA, ChenX, et al. Identification of human triple-negative breast cancer subtypes and preclinical models for selection of targeted therapies. J Clin Invest. 2011;121(7):2750–2767. doi:10.1172/JCI4501421633166
- DragowskaWH, WepplerSA, WangJC, et al. Induction of autophagy is an early response to gefitinib and a potential therapeutic target in breast cancer. PLoS One. 2013;8(10):e76503. doi:10.1371/journal.pone.007650324146879
- TanidaI, Minematsu-IkeguchiN, UenoT, KominamiE. Lysosomal turnover, but not a cellular level, of endogenous LC3 is a marker for autophagy. Autophagy. 2005;1(2):84–91. doi:10.4161/auto.1.2.169716874052
- ThomasS, SharmaN, GoldenEB, et al. Preferential killing of triple-negative breast cancer cells in vitro and in vivo when pharmacological aggravators of endoplasmic reticulum stress are combined with autophagy inhibitors. Cancer Lett. 2012;325(1):63–71. doi:10.1016/j.canlet.2012.05.03022664238
- CostaRLB, HanHS, GradisharWJ. Targeting the PI3K/AKT/mTOR pathway in triple-negative breast cancer: a review. Breast Cancer Res Treat. 2018. doi:10.1007/s10549-018-4697-y
- Blanco-AparicioC, RennerO, LealJFM, CarneroA. PTEN, more than the AKT pathway. Carcinogenesis. 2007;28(7):1379–1386. doi:10.1093/carcin/bgm05217341655
- ClarkAS, RobersonMS, LamkinTJ, VarvayanisS, YenA. Constitutive and inducible Akt activity promotes resistance to chemotherapy, trastuzumab, or tamoxifen in breast cancer cells. Mol Cancer Ther. 2002;1(9):707.12479367
- YiYW, HongW, KangHJ, et al. Inhibition of the PI3K/AKT pathway potentiates cytotoxicity of EGFR kinase inhibitors in triple-negative breast cancer cells. J Cell Mol Med. 2013;17(5):648–656. doi:10.1111/jcmm.1204623601074
- YouKS, YiYW, KwakS-J, SeongY-S. Inhibition of RPTOR overcomes resistance to EGFR inhibition in triple-negative breast cancer cells. Int J Oncol. 2018;52(3):828–840. doi:10.3892/ijo.2018.424429344641
- BuiNL, PandeyV, ZhuT, MaL, LobiePE. Bad phosphorylation as a target of inhibition in oncology. Cancer Lett. 2018;415:177–186. doi:10.1016/j.canlet.2017.11.01729175460
- Djavaheri-MergnyM, MaiuriMC, KroemerG. Cross talk between apoptosis and autophagy by caspase-mediated cleavage of Beclin 1. Oncogene. 2010;29(12):1717–1719. doi:10.1038/onc.2009.51920101204
- RuvoloPP, DengX, MayWS. Phosphorylation of Bcl2 and regulation of apoptosis. Leukemia. 2001;15(4):515–522.11368354
- HuangP, XuX, WangL, ZhuB, WangX, XiaJ. The role of EGF-EGFR signalling pathway in hepatocellular carcinoma inflammatory microenvironment. J Cell Mol Med. 2014;18(2):218–230. doi:10.1111/jcmm.1215324268047
- ZhaoL, YangG, ShiY, SuC, ChangJ. Co-delivery of Gefitinib and chloroquine by chitosan nanoparticles for overcoming the drug acquired resistance. J Nanobiotechnology. 2015;13(1):57. doi:10.1186/s12951-015-0121-526395758
- EspinaV, WysolmerskiJ, EdmistonK, LiottaLA. Attacking breast cancer at the preinvasion stage by targeting autophagy. Womens Health (Lond). 2013;9(2):157–170. doi:10.2217/whe.13.523477322