
Abstract
Background
Distant metastasis remains the leading cause of death among patients with breast cancer (BRCA). The process of cancer metastasis involves multiple mechanisms, including compromised immune system. However, not all genes involved in immune function have been comprehensively identified.
Methods
Firstly 1623 BRCA samples, including transcriptome sequencing and clinical information, were acquired from Gene Expression Omnibus (GSE102818, GSE45255, GSE86166) and The Cancer Genome Atlas-BRCA (TCGA-BRCA) dataset. Subsequently, weighted gene co-expression network analysis (WGCNA) was performed using the GSE102818 dataset to identify the most relevant module to the metastasis of BRCA. Besides, ConsensusClusterPlus was applied to divide TCGA-BRCA patients into two subgroups (G1 and G2). In the meantime, the least absolute shrinkage and selection operator (LASSO) regression analysis was used to construct a metastasis-related immune genes (MRIGs)_score to predict the metastasis and progression of cancer. Importantly, the expression of vital genes was validated through reverse transcription quantitative polymerase chain reaction (RT-qPCR) and immunohistochemistry (IHC).
Results
The expression pattern of 76 MRIGs screened by WGCNA divided TCGA-BRCA patients into two subgroups (G1 and G2), and the prognosis of G1 group was worse. Also, G1 exhibited a higher mRNA expression level based on stemness index score and Tumor Immune Dysfunction and Exclusion score. In addition, higher MRIGs_score represented the higher probability of progression in BRCA patients. It was worth mentioning that the patients in the G1 group had a high MRIGs_score than those in the G2 group. Importantly, the results of RT-qPCR and IHC demonstrated that fasciculation and elongation protein zeta 1 (FEZ1) and insulin-like growth factor 2 receptor (IGF2R) were risk factors, while interleukin (IL)-1 receptor antagonist (IL1RN) was a protective factor.
Conclusion
Our study revealed a prognostic model composed of eight immune related genes that could predict the metastasis and progression of BRCA. Higher score represented higher metastasis probability. Besides, the consistency of key genes in BRCA tissue and bioinformatics analysis results from mRNA and protein levels was verified.
Introduction
Breast cancer (BRCA) is a common malignancy in women. In 2020, BRCA surpassed lung cancer as the leading cause of global female cancer incidence, with an estimated number of 2.3 million new cases.Citation1 The number of BRCA deaths rose from 70,000 in 2015 to 117,000 in 2020 in China, accounting for approximately 18% of global BRCA deaths.Citation2 According to Cancer statistics, 2023, there would be about 43,700 estimated deaths of BRCA.Citation3 Particularly, distant metastases contributed to the death of BRCA patients.Citation4 Tumor metastasis is a multi-step process that mainly includes three stages: invasion stage, circulation stage, and colonization stage.Citation5 A large number of mechanisms, including epithelial mesenchymal transition, the role of stromal cells, the role of extracellular proteases, and tumor immune microenvironment (TIME), are involved in the process of cancer metastasis. Therefore, it is essential to discover metastasis-related new targets serving as diagnostic markers or molecular targets for BRCA.
There are accumulating evidences that TIME participates in the processes of BRCA metastasis.Citation6 TIME refers to the combination of immune cells, immune factors, and other immune-related components around a tumor. TIME significantly influences the growth, invasion, and metastasis of BRCA cells.Citation7 Also, it provides favorable conditions for tumor cell growth and invasion during tumor metastasis. For example, BRCA cells can evade immune system by activating immunosuppressive pathways, such as the PD-L1/PD-1 pathway, thereby promoting the metastasis process.Citation8 In addition, tumor cells can also secrete immunosuppressive factors such as transforming growth factor beta and interleukin (IL)-10 to inhibit the activity of immune cells, thereby weakening the killing effect of immune system on tumor cells. However, particularly disrupting TIME that promotes tumor development is a challenging task, as TIME has different abilities to induce favorable and unfavorable consequences for tumor development. Hence, we still need to work hard to screen TIME biomarker related to tumor metastasis.
Microarray analysis and sequencing technology have advanced significantly in recent years, providing powerful tools for detecting differentially expressed genes and discovering prognostic and therapeutic biomarkers. Weighted gene co-expression network analysis (WGCNA) can be used to find highly relevant gene modules and has been successfully used to study metastasis-associated targeting modules and signature genes.Citation9 Moreover, polygenic combinations have been reported to exhibit better predictive efficacy on cancer prognosis than single genes.Citation10 However, present studies lack the immune gene signature to predict the metastasis in BRCA patients. In this study, comprehensive application of biological algorithms, including the WGCNA and the least absolute shrinkage and selection operator (LASSO) regression analysis, was performed to construct the prognostic models of immune gene signature to predict cancer metastasis.
In this study, the most relevant gene modules associated with metastasis were acquired through WGCNA analysis based on the GSE102818 dataset. According to the expression level of all genes in this module, the breast invasive carcinoma population of The Cancer Genome Atlas (TCGA) was divided into two groups (G1 vs G2) and differences between the two groups were compared. Subsequently, an eight-gene expression signature associated with cancer progression was established by exhaustively using the expression of all genes related to BRCA patients from TCGA. Finally, differentially expressed potential biomarkers were confirmed in clinical tissue samples at the mRNA and protein levels.
Methods
Data Sources
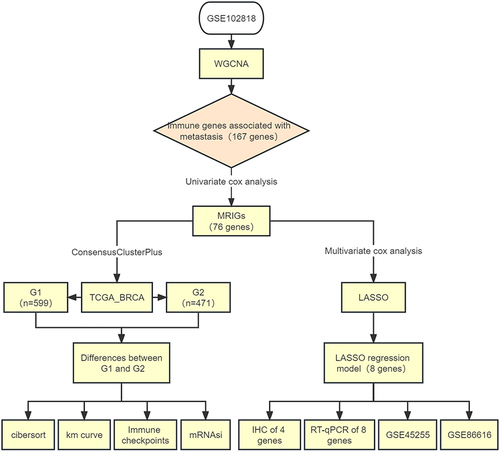
The workflow of the data preparation, processing, analysis, and validation was presented in . To obtain metastasis-related immune genes (MRIGs) in BRCA, the datasets in Gene Expression Omnibus (GEO, https://www.ncbi.nlm.nih.gov/geo/) were screened to perform WGCNA. The GEO dataset was selected based on the following criteria: (1) containing clinical and prognostic data for patients; (2) the sample size of the dataset larger than 40; (3) containing gene expression profile data. GSE102818 was identified for the subsequent analysis, which included primary and metastasis BRCA tissues and detected only for immune genes. Samples and clinicopathological data of GSE102818 were presented in Table S1. Then, for constructing the predictive models, the dataset of BRCA patients (n = 1070) was obtained from TCGA (https://portal.gdc.cancer.gov/). The gene expression level was measured as fragments per kilobase per million (FPKM) reads. The FPKM values of TCGA-BRCA (TCGA-BRCA) were transformed into transcripts per million (TPM). Details of these 1070 BRCA patients who were treated as the training set were shown in Table S2. GSE86166 listed in Table S3 was used as the validation set. The GSE45255, as the test set, was shown in Table S4.
Figure 1 Flow diagram of this study.
Patients and Samples
Twenty-four tissue samples, including twelve primary and twelve metastatic BRCA tissues, were collected at the Fourth Hospital of Hebei Medical University. Once the tissue samples were taken out, they were divided into two parts. One part was immediately frozen and stored at −80 ° C until further mRNA extraction was achieved. The other part was washed clean and placed in formalin for immunohistochemistry (IHC). The study was approved by Ethics Committee of the Fourth Hospital of Hebei Medical University with approval number 2019MEC067 and all procedures were carried out in accordance with relevant guidelines and regulations. This study strictly follows the Helsinki Declaration. In addition, all patients participating in this study provided written information.
Construction of Weighted Gene Co-Expression Networks
To identify critical modules related to immune genes that promoted tumor progression, weighted correlation networks were constructed using the mRNA expression profile of GSE102818 using the R package “WGCNA”.Citation9 In this network, the pairwise Pearson coefficient was utilized to assess the weighted co-expression relationship between all genes in the adjacency matrix. Soft thresholds were used to ensure that the network was scale-free. The modules were identified by hierarchical clustering of the weighted coefficient adjacency matrix, and the topological overlap matrix (TOM) was calculated. The absolute value of the correlation threshold was 0.85. The samples were first clustered using a hierarchical clustering method, the gene module parameter values (maxBlocksize = 730, minModuleSize = 30, mergeCutHeight = 0.25) were determined, and the dynamic pruning method was adopted. Once these data were available, the Pearson correlation coefficient of the gene module with the phenotype (primary or metastasis) was calculated. This made it possible to select gene modules closely related to tumor metastasis. The most relevant gene populations were shown in Table S5.
Functional and Pathway Enrichment Analysis
Gene ontology (GO) annotation is a commonly used method for annotating genes and gene products and identifying the characteristic biological properties of high-throughput transcriptome and genomic patterns.Citation11 The Kyoto Encyclopedia of Genes and Genomes (KEGG) is commonly used for systematic analysis of gene function and to correlate genomic data with higher-order functional data.Citation12 The 167 MRIGs obtained by WGCNA were analyzed by GO and KEGG using R packages, clusterprofiler,Citation13,Citation14 and P<0.05 indicated a statistical significance.
Protein Protein Interaction Analysis
The online database STRING (Search Tool for the Retrieval of Interacting Genes, http://string-db.org/, as of 12 December 2022) was utilized to search for protein interactions. To investigate the interactions between MRIGs, the MRIGs were uploaded to STRING, using a confidence score of 0.7.Citation15 From the MRIGs, protein protein interaction (PPI) hub genes were identified by applying the degree algorithm of cytoHubba and MCODE. Besides, the degree of a gene was determined by the number of its connected neighbors.Citation16,Citation17
Unsupervised Consensus Clustering for MRIG-Related Patterns
To divide TCGA-BRCA patients into different molecular subtypes, the R package “ConsensusClusterPlus” was employed for unsupervised consensus clustering analysis.Citation18 A total of 167 genes were screened by univariate Cox regression analysis (P<0.01), and 76 MRIGs were included. Based on the 76 prognostic genes, the clustering analysis was performed and repeated 1000 times to ensure the stability of classification. The clustering of data was carried out based on the following criteria: i) an increase in the within-group correlation and a decrease in the between-group correlation after clustering; ii) none of the groups with a small sample size. Next, the TCGA-BRCA patients were divided into G1 (with favorable prognoses) and G2 (with poor prognoses) groups. Our main research object was tumor metastasis, but this clinical indicator was not included in some datasets. Therefore, we chose the commonly used efficacy endpoint PFS (progression-free survival) in tumor clinical trials as a substitute.
Analysis for the mRNA Expression-Based Stemness Index
The mRNA expression-based stemness index (mRNAsi) is a measure of stem cell properties calculated from mRNA matrix data that correlates positively with stem cell properties of tumors. Firstly, the OCLR algorithm was applied to calculate mRNAsi constructed by Malta et al.Citation19 Then, the correlations between gene expression levels and mRNAsi were assessed using Spearman correlation coefficients. The minimum value was subtracted, and the result was divided by the maximum maps the dryness index to the range.
Immune Checkpoint Analysis
Immune checkpoints, as inhibitory regulatory molecules in the immune system, are essential for maintaining self-tolerance, preventing autoimmune responses, and minimizing tissue damage by controlling the timing and intensity of immune responses.Citation20 We downloaded expression profile data from TCGA and selected 8 genes associated with immune checkpoints (SIGLEC15, TIGIT, CD274, HAVCR2, PDCD1, CTLA4, LAG3 and PDCD1LG2) to compare the difference of immune checkpoint-related genes expression between G1 and G2 groups. Then, the potential immune checkpoint blockade (ICB) response was predicted with Tumor Immune Dysfunction and Exclusion (TIDE) algorithm.Citation21
Immune Cell Infiltration Analysis
To assess the immune cell infiltration in TCGA-BRCA patients, R package “immunedeconv” was adopted according to previous methods,Citation22 which integrated six latest algorithms, including TIMER, XCELL, MCPCOUNTER, CIBERSORT, EPIC and QUANTISEQ. These algorithms had been bench marked, and each had a unique advantage.Citation23–29
Tumor Microenvironment Analysis
The immunological and interstitial content of each TCGA-BRCA sample was assessed by the “ESTIMATE” R package.Citation30 Specifically, the ESTIMATE score was the sum of the immune and matrix scores, representing the abundance of immune components and matrix components, respectively.Citation30 Higher ESTIMATEs corresponded to lower tumor purity.
Generation of the Prognostic MRIGs_score
The MRIGs_score formula was established to evaluate the PFS risk of TCGA-BRCA patients. First, univariate and multivariate Cox regression analysis was performed on immune genes to identify genes associated with BRCA progression (Tables S6 and S7). Then, by LASSO Cox regression algorithm, a model was established with 10-fold cross-validation based on the selected genes.Citation31 Next, MRIGs_score was calculated as follows: , where coefi and Expi represented the risk factor and expression of each gene, respectively. Based on the median MRIGs_score, a total of 1070 patients in the training group were divided into two groups (low-risk group vs high-risk group). Subsequently, Kaplan Meier survival analysis was performed to analyze PFS for the two groups of patients. Similarly, the validation and test sets were divided into low- and high-risk groups, Kaplan Meier survival analysis was performed, and the receiver operating characteristic (ROC) curve was generated.
Establishment and Validation of a Nomogram Scoring System
Based on clinical features and MRIGs_score, a predictive nomogram scoring system was developed using the “rms” package. In the nomogram scoring system, each variable matched a score, and a total score was acquired through adding the scores of all variables in each sample. Relying on ROC curves, the nomogram was constructed using 1-, 2-, and 4-year lifetime. The nomogram calibration was plotted to depict the predicted values between predicted 1-, 2-, and 4-year survival events and virtual observations.
Signature Genes Expression Level Analysis
Gene Set Cancer Analysis (GSCA: http://bioinfo.hust.edu.cn/GSCA/#/), an integrated platform for genome and immunogenomic networks for gene set cancer research, was used to investigate the features of eight signature genes, including Single-Nucleotide Variation (SNV) profile and Genomics of Drug Sensitivity in Cancer (GDSC).Citation32
Reverse Transcription Quantitative Polymerase Chain Reaction
Twelve pairs of primary BRCA tissues and metastasis tissues were collected to verify the expression levels of eight signature genes by reverse transcription quantitative polymerase chain reaction (RT-qPCR). A TRIzol reagent (Invitrogen, Carlsbad, CA, USA) was used for the isolation of total RNA from breast tissue. The cDNA was prepared with the TransScript One-Step gDNA Removal and cDNA Synthesis SuperMix TransScript Kit (Transgen, Beijing, China) using the below-mentioned primer sequences. Subsequently, RT-qPCR was performed using the TransStart Top Green qPCR SuperMix Top Green Kit (Transgen, Beijing, China). The primer sequences were listed in Table S8. The mRNA expression levels were determined using the 2−∆∆CT approach with GAPDH level as the reference.
Immunohistochemistry
IHC staining was used to validate the protein expression of fasciculation and elongation protein zeta 1 (FEZ1), F12, insulin-like growth factor 2 receptor (IGF2R) and IL-1 receptor antagonist (IL1RN). Twelve pairs of tissues were subject to fixation, embedding, sectioning, and staining with rabbit anti-human polyclonal antibody (Proteintech, Wuhan, China). Next, the protein expression was detected. The dilution ratio was 1:20–1:500. Then, the samples were hybridized with biotinylated anti-rabbit secondary antibody, and the avidin-biotin enzyme complex (1:200, Servicebio, Wuhan, China) staining was observed using a Nikon microscope (Nikon Eclipse E100, Nikon, Tokyo, Japan). The final scores obtained by immunoreactive score (IRS), and staining intensity (SI) × percentage of positive cells (PP) were used as quantitative scoring criteria to evaluate the protein expression of metastasis-related signature genes in each tissue. The positive color intensity could be graded as follows: grade 0, without positive coloration; grade 1, light yellow weak positive; grade 2, brownish yellow medium positive; grade 3, tan strong positive. The positive cell ratio was graded as follows: grade 0, 0–5%; grade 1, 6%–25%; grade 2, 26%–50%; grade 3, 51%–75%; grade 4, >75%. Besides, 0 was negative (-), 1–4 was weak positive (+), 5–8 was positive (++), and 9–12 was strongly positive (+++).
Statistical Analysis
All statistical analyses were performed using R version 4.1.1. The data were analyzed by virtue of Student’s t-test, Spearman correlation analysis and one-way ANOVA analysis. P < 0.05 was considered statistically significant.
Results
Construction of Weighted Gene Co-Expression Network and Identification of Metastasis-Related Immune Genes by WGCNA
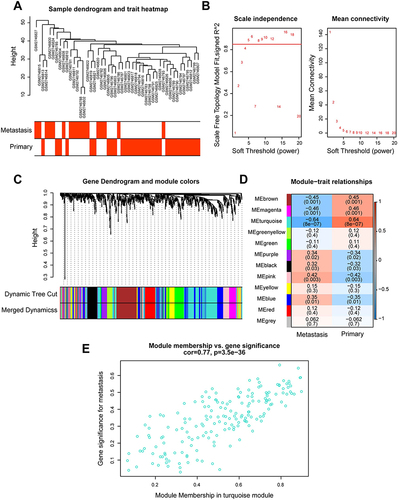
The study design followed in the current study was shown in . To identify MRIGs, the expression profiles and clinical features of 48 BRCA patients of GSE102818 were analyzed by WGCNA. Firstly, the sample clustering dendrogram and trait heat map () were plotted. As shown in , the horizontal axis was the soft threshold, and the vertical axis was the evaluation parameter of the scale-free network. The higher the value of the evaluation parameter, the more consistent the network was with the characteristics of scale-free networks. In , the horizontal line indicated a soft threshold of 0.85. According to the soft threshold, the optimal soft threshold power based on scale-free networks was 5. To ensure a scale-free network (R2 = 0.91, Figure S1), the dendrogram of all immune genes (n = 730) was clustered using the mean linkage method and the biweight midcorrelation. Through hierarchical clustering, a total of 11 modules with large differences of co-expressed genes were identified (). The co-expression network was visualized as a TOM plot consisting of a hierarchical clustering dendrogram and TOM matrix (Figure S2). Also, the clusters and correlations between modules were plotted (Figure S3). Genes and their attribution modules were listed in Table S9. The relationship between modules and traits (primary vs metastasis) () was then explored, and the turquoise module most relevant to metastasis was selected. The relationship between turquoise module and gene significance for metastasis was also investigated (correlation coefficient = 0.77, P = 0.000, ). There were 167 genes associated with BRCA metastasis in the turquoise module.
Figure 2 Construction of weighted gene co-expression network and identification of significant modules in weighted gene co-expression network analysis. (A) Cluster dendrogram of 48 breast cancer samples. (B) The scale-free fit index for soft threshold powers. Left: the relationship between the soft threshold and scale-free R2. Right: the relationship between the soft threshold and mean connectivity. Different modules were labeled in different colors. (C) Cluster dendrogram and module assignment of weighted gene co-expression network analysis. The branches referred to clusters of genes highly connected. The colors in the horizontal bar represented the modules. (D) Heatmap of the correlation between module genes and disease status. Each cell contained the correlation coefficients and p value. Red indicated positive correlations while blue indicated negative. (E) Module memberships in turquoise module and their correlation with metastasis (cor represented correlation coefficient).
Functional Annotations of MRIGs
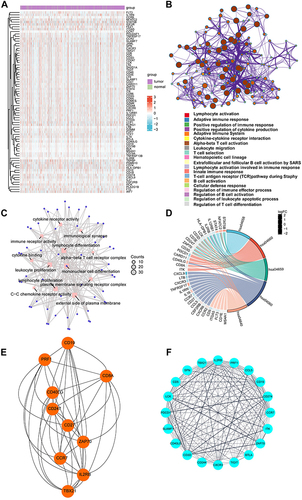
To further screen for genes related to prognosis, univariate Cox regression analysis was adopted to measure PFS to determine the prognostic significance of 167 immune genes (Table S5) using TCGA-BRCA datasets. Among 167 genes, there were 76 genes with statistical difference in PFS, which were named as MRIGs. The expression levels of MRIGs were shown in heatmap (). Some immune-related pathways have been reported to be linked to BRCA metastasis.Citation33–35 The function of the 76 proteins was analyzed using the Metascape database and presented in Cytoscape (), which was related to immune process like leukocyte migration. GO enriched terms involved in leukocyte proliferation and lymphocyte proliferation (). All pathways mentioned above were associated with immune activities. Another evidence of immune cell function was from KEGG enrichment pathways. The MRIGs were mostly enriched in T helper (Th) 17 cell differentiation and Th1 and Th2 cell differentiation, which were mechanisms promoting metastasisCitation36,Citation37 (). With the help of the STRING database, a PPI network of MRIGs was constructed. Further, two functional subnet modules were selected from the PPI network by Cytohubba and MCODE plugins, respectively ( and ). The PPI network exhibited the relationship between the MDS, indicating that the relevant pathways could be explored in these directions to reveal the metastasis.
Figure 3 Functional annotations of metastasis-related immune genes. (A) The expression levels of 76 genes in The Cancer Genome Atlas-Breast Cancer datasets. Red indicated up-regulated genes; blue indicated down-regulated genes. (B) Metascape website analysis. Nodes with the same cluster ID were typically close to each other, and the same color indicated the same cluster ID. (C) The top twelve Gene Ontology functional analysis results. (D) The top five Kyoto Encyclopedia of Genes and Genomes analysis results. (E and F) Identification of subnet modules from the protein protein interaction network with the Cytohubba and MCODE (MCODE score = 16.316) algorithm.
Grouping of MRIG Subtypes by Consistent Clustering
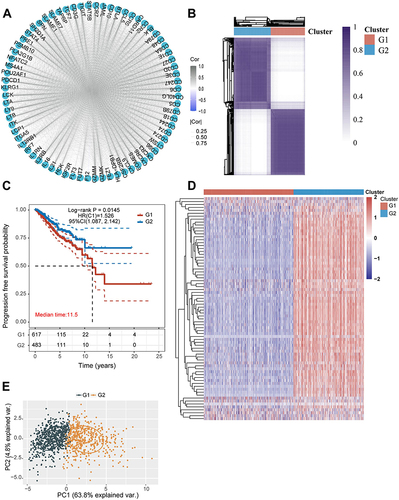
To fully understand the expression pattern in which MRIGs were involved in metastasis, 1070 patients with TCGA-BRCA were enrolled in our study for further analysis (Table S2). MRIGs interacting and regulating connections were shown in based on the TCGA-BRCA database. Then, the MRIG subtypes of 1070 patients were identified using a consensus clustering algorithm based on the expression profiles of 76 MRIGs (Table S6). Our results showed that k = 2 appeared to be the best choice for classifying the entire cohort into G1 (n = 599) and G2 (n = 471) groups (). The Kaplan Meier survival curves for the two groups were displayed in , which indicated the poor prognosis in G1 group (P = 0.0145). Furthermore, the expression of MRIGs of each sample in the two groups was plotted as a heatmap (). Principal component analysis showed that samples in different groups were well discriminated ().
Figure 4 Metastasis-related immune gene subtype characteristics of two distinct subtypes of samples divided by consistent clustering. (A) Correlation between the 76 genes. (B) Consensus matrix heatmap defining two clusters (k = 2) and their correlation areas. (C) Survival analyses for two distinct subtypes in The Cancer Genome Atlas-Breast Cancer cohort using Kaplan Meier curves. (Log rank test, p = 0.0145). (D) Hierarchical clustering of metastasis-related immune genes in The Cancer Genome Atlas-Breast Cancer cohorts. Hierarchical clustering was performed with Euclidean distance and Ward linkage. The cluster was shown as annotations. Rows represented metastasis-related immune genes, and columns represented breast cancer samples. Red represented high expression and blue represented low expression of each gene. (E) Principal component analysis showing a remarkable difference in transcriptomes between the two subtypes.
Comparison of Immune Scores Between G1 and G2 Groups
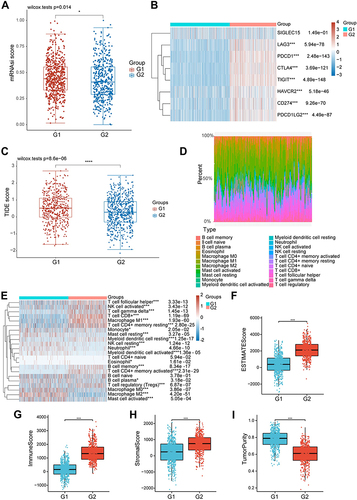
For further exploring the difference of immunocytes in tumor microenvironment of BRCA patients, the mRNAsi score between the two groups was compared. As shown in , the mRNAsi score in the G1 group was higher than that in the G2 group (P = 0.014, ). In addition, we analyzed the level of common immune checkpoint genes in two groups. The analysis results showed that the expression levels of these genes were significantly elevated in G2, suggesting that the efficacy of immune checkpoint inhibitors (ICIs) might be different in two groups (). Besides, the TIDE score of the two groups was calculated. The calculation results disclosed that the TIDE score of subjects in the G1 group was higher than that in the G2 group (P = 0.000, ), indicating that patients in the G2 group benefited more from ICI treatment than those in the G1 group. Furthermore, the CIBERSORT algorithm was utilized to quantify the activity or enrichment levels of immune cells in BRCA tumor tissues (Table S10). The quantification results indicated that the composition of immunocytes significantly differed in the two groups ( and ). In addition, we also calculated the immune score by several other algorithms, including EPIC, MCPCOUNTER, QUANTISEQ, TIMER, XCELL. The results indicated that multiple immune cells were more abundant in the G2 group than those in the G1 group, including CD4+ T cell, CD8+ T cell, NK cell, and so on (Figures S4–S9). Furthermore, the ESTIMATE results demonstrated that the ESTIMATEScore, StromalScore, and ImmuneScore were significantly increased in the G2 group compared with those in the G1 group (ESTIMATEScore: P < 0.001, StromalScore: P < 0.001, ImmuneScore: P < 0.001, ), while the TumorPurity decreased (P < 0.001, ).
Figure 5 The differences between the metastasis-related immune gene subtypes. (A) Differences in mRNA expression-based stemness index score between the two different MRIGS groups. (B) The heatmap of the expression of immune checkpoint genes in the signature in two metastasis-related immune gene subtypes. (C) Differences in the Tumor Immune Dysfunction and Exclusion score among different metastasis-related immune gene groups. (D) The bar plot for the proportion of twenty-two infiltrating immune cells based on the CIBERSORT algorithm in the Tumor Immune Dysfunction and Exclusion datasets. (E) The heatmap of twenty-two infiltrating immune cell types in the two metastasis-related immune gene subtypes. (F–I) Correlations between the two metastasis-related immune gene subtypes and tumor microenvironment score (Tumor microenvironment score included ESTIMATE score, immune score, stromal score and tumor purity) (*P < 0.05; ***P < 0.001; ****P < 0.0001).
Construction of the Prognostic Risk Model
To further screen the key genes in 76 MRIGs, multivariate Cox regression analysis was performed to evaluate the prognostic significance of MRIGs. The analysis outcomes revealed that eleven MRIGs (Table S7) could significantly predict the PFS of TCGA-BRCA patients (). Subsequently, eight MRIGs were processed by the LASSO algorithm to construct the prognostic model (). The TCGA-BRCA dataset was used as the training set of LASSO regression. An optimal number of genes was determined by comparing the partial likelihood deviance with log (lambda) (Figure S10). Finally, eight signature MRIGs were included in the prognostic model, including 4 high-risk genes (FEZ1, ITGA5, F12, IGF2R) and 4 low-risk genes (FLT3, IL16, IL1RN, CD79A) (Table S11). Based on the results of LASSO regression analysis, the risk score named as MRIGs_score was constructed as follows:
Figure 6 Construction of the metastasis-related immune genes_score in the training set. (A) Forest map of multivariate survival analysis. (B) LASSO regression curves where each curve represented one gene. (C and D) Ranked dot and scatter plots showing the metastasis-related immune genes_score distribution and patient progression status. (E) Relationships between the expression of eight signature genes and metastasis-related immune genes_score. (F) Sankey diagram of subtype distributions in groups with different metastasis-related immune genes_score and progression outcomes.
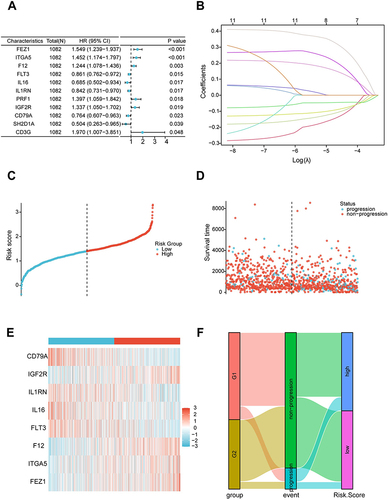
The MRIGs_score of TCGA-BRCA patients was shown in and . Patients with MRIGs_score below the median risk score were classified as low risk (n = 535), while patients with MRIGs_score above the median risk score were classified as high risk (n = 535). The expression levels of eight signature MRIGs were presented in . To analyze the association between MRIGs groups and MRIGs_score, we evaluated the PFS outcome of each patient in TCGA-BRCA dataset (). The distributions of patients in G1/G2, PFS outcomes, and two MRIGs_score groups were exhibited in . The results indicated the consistence of two classification standard (G1/G2 group vs low/high MRIGs_score).
Prognostic Value and Features of Prognostic Risk Model in the Training Set
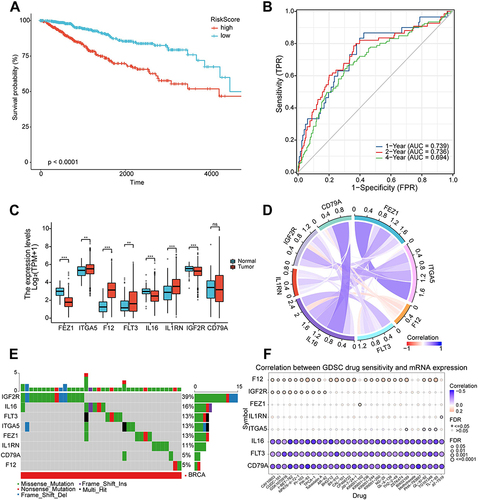
Subsequently, the Kaplan Meier survival curve was plotted to test the prediction performance of the LASSO regression model. Specifically, patients with low MRIGs_score had significantly better outcomes of PFS compared with those with high MRIGs_score (Log rank test, P <0.0001; ). In addition, according to MRIGs_score, the 1-, 2-, and 4-year survival area under the curve (AUC) values of TCGA-BRCA patients were 0.739, 0.736, and 0.694, respectively (). The results demonstrated that MRIGs_score model exhibited an acceptable discriminatory ability for BRCA patients’ PFS. Subsequently, we analyzed differential expression of 8 signature MRIGs. The analysis results indicated that FEZ1, ITGA5, F12, and IGF2R were significantly up-regulated in tumor tissues of BRCA-TCGA patients, and FLT3, IL16, and IL1RN were down-regulated in tumor tissues (). The correlation analysis demonstrated a positive correlation of FEZ1-ITGA5 with CD79A-IL16, etc. (). Besides, in light of the Single-Nucleotide Variation (SNV) profile, the mutation percentage of 8 signature MRIG was measured via GSCA database. The measurement outcomes displayed that IGF2R had the highest mutation rate with the type of missense mutation (). Furthermore, the Copy Number Variation (CNV) was obtained by GSCA database, and the deletion mutation was located mostly in FEZ1 (Figure S11). Besides, the methylation level of FEZ1 was highest among 8 signature MRIGs in TCGA-BRCA patients (Figure S12). Moreover, the correlation between GDSC drug sensitivity and signature MRIGs’ mRNA levels indicated that higher level of F12 or IGF2R meant better drug sensitivity ().
Figure 7 Prognostic value and features of LASSO regression model in the training set. (A) Kaplan-Meier survival curve in the training set. The red line represented the high-risk group, and the blue line represented the low-risk group. (B) The area under the curve of time-dependent receiver operating characteristics curve analysis for evaluating the prognostic performance of the risk score for 1,2,4-year progression-free survival of the training set. (C) Expression of eight signature genes in The Cancer Genome Atlas-Breast Cancer cohort. (D) Correlation between the eight signature genes. (E) Mutation profile analysis of signature genes by using The Cancer Genome Atlas datasets. (F) Correlation between gene expression and the sensitivity of Genomics of Drug Sensitivity in Cancer drugs. (*P < 0.05; **P < 0.01; ***P < 0.001).
Validation and Application of the Prognostic Risk Model
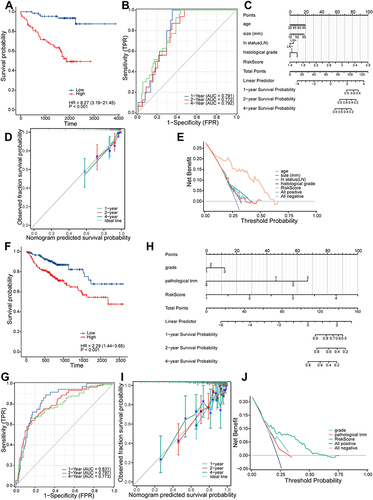
We selected two GEO datasets as the validation (GSE45255) and test (GSE86166) sets and verified the performance of the prognostic risk model. Log-rank analysis showed that higher MRIGs_score was significantly associated with poor prognosis of PFS in BRCA patients (HR = 8.27, P <0.001 for GSE45255, ; HR = 2.29, P <0.001 for GSE86166, ). The results of AUC showed that the prognostic risk model could discriminate the patients’ PFS of 1, 2 and 4 years in the validation set and test set; the AUC values were 0.791, 0.772, 0.792 for validation set and 0.831, 0.797, 0.773 for test set, respectively ( and ). To predict the one-, two-, and four-year PFS for BRCA patients, a nomogram was constructed using MRIGs_score and associated factors ( and ). The calibration curves for validation set and test set both presented the good prediction performance ( and ). The results of decision curve analysis (DCA) showed that the two nomograms had the favorable net clinical benefits in a large range of threshold probability (0–0.75, and ).
Figure 8 Validation and application of the prognostic risk model. (A) Kaplan-Meier survival curve in the validation set. (B) The area under the curve of time-dependent receiver operating characteristics curve analysis for evaluating the prognostic performance of the risk score for 1,2,4-year progression-free survival of the training set. (C) Nomogram for predicting the 1-, 2-, 4-year progression-free survival of metastasis-related immune genes_patients in the validation set. (D) Calibration curves of the nomogram for predicting of 1-, 2- and 4-year progression-free survival of the validation set. (E) Decision curve analysis based on validation set. (F) Kaplan-Meier survival curve in the testing set. (G) The area under the curve of time-dependent ROC curve analysis for evaluating the prognostic performance of the risk score for 1,2,4-year progression-free survival of the testing set. (H) Nomogram for predicting the 1-, 2-, 4-year progression-free survival of metastasis-related immune gene patients in the testing set. (I) Calibration curves of the nomogram for predicting of 1-, 2- and 4-year progression-free survival of the testing set. (J) Decision curve analysis based on testing set.
Validation of Eight MRIGs Expression Levels
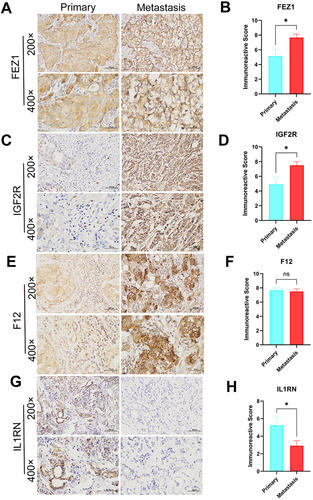
After bioinformatics analysis, twenty-four tissue samples were collected from 12 primary BRCA patients and 12 BRCA patients with distant metastasis for validating the expression of the 8 MRIGs through the validation experiments (Table S12). The RT-qPCR assay showed significant up-regulation of FEZ1, F12, and IGF2R ( and ), and down-regulation of FLT3, IL16, and IL1RN in the metastasis group ( and ). There were no significant differences in ITGA5 or CD79A level ( and ) between the two groups. According to the risk coefficient weight, we chose the top 4 MRIGs to validate their protein levels by IHC analysis, including three risk factors (FEZ1, F12, IGF2R) and one protective factor (IL1RN). The results demonstrated that the FEZ1, IGF2R and IL1RN ( and ) (primary vs metastasis; 7 vs 12; 5 vs 12; 7 vs 1) were statistically significant expressed between the two groups, while F12 (primary vs metastasis; 11 vs 12) was not (). Paired t-test showed that the expression levels of FEZ1 and IGF2R in metastasis samples were considerably higher than those in primary samples (, P = 0.0214; , P = 0.0257), while the level of ILRN was lower than that in patients with primary samples (, P = 0.0426). There was no significant difference in the expression level of F12 between patients with primary samples and patients with metastasis samples (, P = 0.7369). The above findings were consistent with the bioinformatics analysis results.
Figure 9 Validation of reverse transcription-quantitative polymerase chain reaction using primary (n = 12) breast cancer tissue samples and metastasis breast cancer tissue (n = 12) samples. (A–H) The mRNA expression of eight signature genes (FEZ1, ITGA5, F12, FLT3, IL16, IL1RN, IGF2R and CD79A) were confirmed by reverse transcription-quantitative polymerase chain reaction. (**P < 0.01).
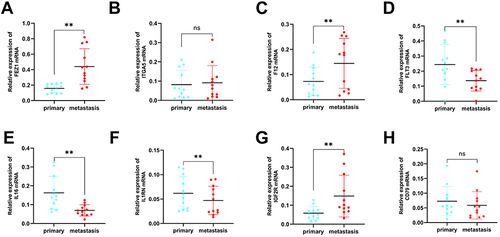
Figure 10 Expression levels of FEZ1, F12, IGF2R and IL1RN in breast cancers by IHC. (A, C, E and G) Expression of FEZ1, F12, IGF2R and IL1RN, respectively in primary (n = 12) and metastasis (n = 12) breast cancer tissue (SPx400). (B, D, F and H) Typical IHC images obtained at a 400× magnification together with IRS were used for analyzing the IHC results of FEZ1, F12, IGF2R and IL1RN, respectively, in primary breast cancer (n = 12) and metastasis (n = 12) samples. (mean ± SEM, *P < 0.05).
Discussion
TIME plays an important role in the metastasis of BRCA.Citation38,Citation39 It is necessary to explore the key components of the tumor microenvironment and immune-related genes in breast tumor metastasis. In order to screen immune genes related to BRCA metastasis, GSE102818 was subject to the WGCNA. After that, gene modules related to metastasis, including 167 genes, were acquired. Then, according to the results of univariate cox analysis, 76 MRIGs were significantly associated with patients’ PFS. Based on the 76 genes, patients were classified into two categories via unsupervised clustering. Differential survival outcomes and immune responses were found in these two clusters, suggesting a favourable classification effect of MRIGs. Subsequently, the GO/KEGG enrichment analysis revealed that the 76 immune genes were mostly correlated with the immune system and T cell signaling pathway mediated by white blood cells. Besides, a prediction model was constructed using LASSO regression analysis, including 8 MRIGs, to calculate the MRIG score. Eight genes included four risk genes (FEZ1, ITGA5, F12, IGF2R) and four protective genes (FLT3, IL16, IL1RN, and CD79A). Patients in the high MRIG score group were more likely to have a distant metastasis. We also validated and tested the model using GSE45255 and GSE86616, respectively, and the results showed that the model had good predictive performance. Eventually, RT-qPCR and IHC were used to verify the mRNA and protein expression level of the signature genes in this study.
The MRIGs were obtained through WGCNA and univariate cox analysis. WGCNA was employed to search for co-expressed gene modules and explore the correlation between gene networks and phenotypes of interest.Citation9 Compared to traditional differential gene analysis that can only analyze differential genes between tumors and normal tissues, WGCNA has significant advantages, such as considering gene modules, rather than focusing solely on genes and their interactions.Citation40,Citation41 Similarly, through WGCNA, Chen et al identified the gene modules mostly correlated with gastric cancer and obtained the key genes in the regulatory network.Citation42 Therefore, to screen the module of entire immune gene cluster involved in the BRCA metastasis, we applied WGCNA to identify the turquoise module with 167 immune genes as the target one, which was associated with BRCA metastasis and used for further screening the MRIGs.
Besides, the MRIGs were used as a classifier, and the TCGA-BRCA patients were divided into two groups (G1 and G2) using the R package “ConsensusClusterPlus”. The analysis results showed that G1 had a high mRNAsi score, indicating a poor outcome. In addition, high TIDE score in the G1 group may contribute to immunosuppression and showed a correlation with a poor prognosis to ICIs in BRCA patients. Furthermore, infiltration levels of B cell, CD4+ T cell, CD8+ T cell, neutrophil, and myeloid dendritic cell were higher in the G2 group than those in the G1 group; moreover, the above infiltration levels were significantly negatively correlated with PFS. Liu et al stated that CD8+ T-cell infiltration could prolong the overall survival of patients with muscle-invasive bladder cancer.Citation43 Previous study indicated a high infiltration level of B cells in the tumor tissues of extranodal natural killer/T-cell lymphoma patients and a correlation of a high infiltration of B cells with patients’ better overall survival.Citation44 The results above suggested that the immunocyte infiltration in TIME was linked to the prognosis and metastasis of BRCA patients.
Subsequently, a prognostic model was constructed to predict BRCA patients’ PFS status using 8 MRIGs (FEZ1, ITGA5, F12, FLT3, IL16, IL1RN, IGF2R, CD79A) from 76 MRIGs. The performance of this model was validated and tested by GEO datasets (GSE45255 and GSE86166). Results of calibration curves and DCA presented the good prediction performance of this model. Similarly, Song et al constructed a predictive model to predict patients’ recurrence-free survival based on a set of pyroptosis-related genes and verified the predictive ability of this model in colorectal cancer patients.Citation45 Different from previous studies, our study focused on the role of immune related genes. The eight immune related genes in the prognostic model played an important role in the outcome of PFS among BRCA patients.
There were eight MRIGs in the LASSO cox regression model. Then, we obtained tissue samples from 12 cases of primary BRCA and 12 cases of metastatic BRCA to verify these eight genes at the mRNA and protein levels. However, the results showed that there was no statistical difference between CD79A and ITGA5 in the two tissues at mRNA level. Next, immunohistochemical experiments were performed on the four genes with the highest risk coefficient. The experimental results revealed that FEZ1 and IGF2R were up-regulated while IL1RN was down-regulated in metastatic BRCA tissues. Previous studies have stated that these genes were associated with the progression of cancer by participating in immune processes.Citation46–48 Malikov et al found that FEZ1, a therapeutic target for cancer such as prostate cancer, exerted an anti-cancer effect partly through the activation of HSPA8/DNA-PK innate immune pathway.Citation46,Citation49 IL1RN, as a member of IL-1 family, can protect individuals from immune dysregulation and uncontrolled systemic inflammation triggered by IL1 for a range of innate stimulatory agents such as pathogens.Citation50 Villatoro et al confirmed that low IL1RN expression levels promoted the formation of various tumors, including leukemia,Citation48,Citation51 which was consistent with our result. The IGF2R is able to sequester the insulin-like growth factor for internalization and degradation.Citation52 Consistent with our findings, Liu et al demonstrated that the IGF2R could promote the carcinogenesis and progression of laryngeal cancer.Citation47 In addition, tumour typing based on MRIGs and analysis of immune infiltration showed that the model constructed in this study was closely related to the immune response and could be targeted for immunotherapy. The eight MRIGs condensed from this model exhibited good predictive effects and significant expression differences between primary and metastatic tissues, which could be used to develop means of prevention and treatment of tumour metastasis.
There are still following limitations in this study: (1) to obtain unique MRIGs, the sample size of the WGCNA dataset was relatively small; (2) some of the datasets included in this study lacked the partial clinical information, such as surgery, new adjuvant and radiotherapy, which may affect the results; (3) all analyses were performed based on the data from public databases, and all samples were obtained through retrospective analysis; (4) the small size of tissue samples may be the reason for the inconsistency of our bioinformatics results with RT-qPCR and IHC results. Therefore, inherent case selection bias may have an impact on the results of our study. Overall, our findings still need to be further confirmed through large scale of prospective cohort study and experimental studies in vivo and in vitro in the future.
Conclusions
The joint regulation of multiple immune genes plays an important role in the progress and distant metastasis of BRCA. Our comprehensive analysis of MRIGs sheds light on their extensive regulatory mechanisms and impact on the tumor immune microenvironment, clinical pathological features, and prognosis. The findings of this research may advance our understanding of tumor biology and facilitate the development of personalized treatment strategies. Additionally, understanding the therapeutic responsibility of MRIGs allows us to identify potential targets for enhancing the efficacy of immunotherapy and improving patient outcomes.
Abbreviations
BRCA, breast cancer; TCGA, The Cancer Genome Atlas; GEO, Gene Expression Omnibus; WGCNA, Weighted gene co-expression network analysis; RT-qPCR, reverse transcription quantitative polymerase chain reaction; IHC, Immunohistochemistry; MRIGs, Metastasis-related immune genes; MRNAsi, MRNA expression-based stemness index; TIME, Tumor immune microenvironment; FPKM, Fragments per kb per million reads; TPM, Transcripts per kilobase million; GO, Gene Ontology; KEGG, Kyoto Encyclopedia of Genes and Genomes; PPI, Protein protein interaction; PFS, Progression free survival; ROC, Receiver operating characteristics curve.
Data Sharing Statement
This study analyzed data from The Cancer Genome Atlas (TCGA) (https://portal.gdc.cancer.gov/) and Gene Expression Omnibus data base (GEO) (https://ncbi.nlm.nih.gov/geo/). These data are free and publicly available.
Ethics Approval and Consent to Participate
The study was approved by Ethics Committee of The Fourth Hospital of Hebei Medical University (approval ID: 2019MEC067). All methods were carried out in accordance with relevant guidelines and regulations. This study strictly follows the Helsinki Declaration. All patients provided written informed consent.
Disclosure
The authors declare no competing interests in this work.
Acknowledgments
We appreciate the patients and researchers who participated in TCGA and other datasets for providing data.
Additional information
Funding
References
- Sung H, Ferlay J, Siegel RL, et al. Global cancer statistics 2020: GLOBOCAN estimates of incidence and mortality worldwide for 36 cancers in 185 countries. CA Cancer J Clin. 2021;71(3):209–249. doi:10.3322/caac.21660
- Cao W, Chen HD, Yu YW, Li N, Chen WQ. Changing profiles of cancer burden worldwide and in China: a secondary analysis of the global cancer statistics 2020. Chin Med J. 2021;134(7):783–791. doi:10.1097/CM9.0000000000001474
- Siegel RL, Miller KD, Wagle NS, Jemal A. Cancer statistics, 2023. CA Cancer J Clin. 2023;73(1):17–48. doi:10.3322/caac.21763
- Xue Y, Li M, Hu J, et al. Ca(v)2.2-NFAT2-USP43 axis promotes invadopodia formation and breast cancer metastasis through cortactin stabilization. Cell Death Dis. 2022;13(9):812. doi:10.1038/s41419-022-05174-0
- Xu W, Solis NV, Ehrlich RL, et al. Activation and alliance of regulatory pathways in C. albicans during mammalian infection. PLoS Biol. 2015;13(2):e1002076. doi:10.1371/journal.pbio.1002076
- Yu Y, He Z, Ouyang J, et al. Magnetic resonance imaging radiomics predicts preoperative axillary lymph node metastasis to support surgical decisions and is associated with tumor microenvironment in invasive breast cancer: a machine learning, multicenter study. EBioMedicine. 2021;69:103460. doi:10.1016/j.ebiom.2021.103460
- Binnewies M, Roberts EW, Kersten K, et al. Understanding the tumor immune microenvironment (TIME) for effective therapy. Nat Med. 2018;24(5):541–550. doi:10.1038/s41591-018-0014-x
- Teng MW, Ngiow SF, Ribas A, Smyth MJ. Classifying cancers based on T-cell infiltration and PD-L1. Cancer Res. 2015;75(11):2139–2145. doi:10.1158/0008-5472.CAN-15-0255
- Langfelder P, Horvath S. WGCNA: an R package for weighted correlation network analysis. BMC Bioinf. 2008;9(1):559. doi:10.1186/1471-2105-9-559
- Zuo S, Dai G, Ren X. Identification of a 6-gene signature predicting prognosis for colorectal cancer. Cancer Cell Int. 2019;19(1):6. doi:10.1186/s12935-018-0724-7
- Ashburner M, Ball CA, Blake JA, et al. Gene ontology: tool for the unification of biology. The Gene Ontology Consortium. Nat Genet. 2000;25(1):25–29. doi:10.1038/75556
- Kanehisa M, Furumichi M, Tanabe M, Sato Y, Morishima K. KEGG: new perspectives on genomes, pathways, diseases and drugs. Nucleic Acids Res. 2017;45(D1):D353–D361. doi:10.1093/nar/gkw1092
- Yu G, Wang LG, Han Y, He QY. clusterProfiler: an R package for comparing biological themes among gene clusters. OMICS. 2012;16(5):284–287. doi:10.1089/omi.2011.0118
- Wu T, Hu E, Xu S, et al. clusterProfiler 4.0: a universal enrichment tool for interpreting omics data. Innovation. 2021;2(3):100141. doi:10.1016/j.xinn.2021.100141
- Bozhilova LV, Whitmore AV, Wray J, Reinert G, Deane CM. Measuring rank robustness in scored protein interaction networks. BMC Bioinf. 2019;20(1):446. doi:10.1186/s12859-019-3036-6
- Stamatakis A. RAxML version 8: a tool for phylogenetic analysis and post-analysis of large phylogenies. Bioinformatics. 2014;30(9):1312–1313. doi:10.1093/bioinformatics/btu033
- Bader GD, Hogue CW. An automated method for finding molecular complexes in large protein interaction networks. BMC Bioinf. 2003;4(2). doi:10.1186/1471-2105-4-2
- Wilkerson MD, Hayes DN. ConsensusClusterPlus: a class discovery tool with confidence assessments and item tracking. Bioinformatics. 2010;26(12):1572–1573. doi:10.1093/bioinformatics/btq170
- Malta TM, Sokolov A, Gentles AJ, et al. Machine learning identifies stemness features associated with oncogenic dedifferentiation. Cell. 2018;173(2):338–354 e315. doi:10.1016/j.cell.2018.03.034
- Liu Y, Wang Y, Yang Y, et al. Emerging phagocytosis checkpoints in cancer immunotherapy. Signal Transduct Target Ther. 2023;8(1):104. doi:10.1038/s41392-023-01365-z
- Jiang P, Gu S, Pan D, et al. Signatures of T cell dysfunction and exclusion predict cancer immunotherapy response. Nat Med. 2018;24(10):1550–1558. doi:10.1038/s41591-018-0136-1
- Sturm G, Finotello F, List M. Immunedeconv: an R package for unified access to computational methods for estimating immune cell fractions from bulk RNA-sequencing data. Methods Mol Biol. 2020;2120:223–232.
- Sturm G, Finotello F, Petitprez F, et al. Comprehensive evaluation of transcriptome-based cell-type quantification methods for immuno-oncology. Bioinformatics. 2019;35(14):i436–i445. doi:10.1093/bioinformatics/btz363
- Aran D, Hu Z, Butte AJ. xCell: digitally portraying the tissue cellular heterogeneity landscape. Genome Biol. 2017;18(1):220. doi:10.1186/s13059-017-1349-1
- Li T, Fu J, Zeng Z, et al. TIMER2.0 for analysis of tumor-infiltrating immune cells. Nucleic Acids Res. 2020;48(W1):W509–W514. doi:10.1093/nar/gkaa407
- Becht E, Giraldo NA, Lacroix L, et al. Estimating the population abundance of tissue-infiltrating immune and stromal cell populations using gene expression. Genome Biol. 2016;17(1):218. doi:10.1186/s13059-016-1070-5
- Newman AM, Liu CL, Green MR, et al. Robust enumeration of cell subsets from tissue expression profiles. Nat Methods. 2015;12(5):453–457. doi:10.1038/nmeth.3337
- Racle J, de Jonge K, Baumgaertner P, Speiser DE, Gfeller D. Simultaneous enumeration of cancer and immune cell types from bulk tumor gene expression data. Elife. 2017;6. doi:10.7554/eLife.26476
- Finotello F, Mayer C, Plattner C, et al. Molecular and pharmacological modulators of the tumor immune contexture revealed by deconvolution of RNA-seq data. Genome Med. 2019;11(34):1–20.
- Yoshihara K, Shahmoradgoli M, Martínez E, et al. Inferring tumour purity and stromal and immune cell admixture from expression data. Nat Commun. 2013;4(1):2612. doi:10.1038/ncomms3612
- Tibshirani R. The lasso method for variable selection in the Cox model. Stat Med. 1997;16(4):385–395. doi:10.1002/(SICI)1097-0258(19970228)16:4<385::AID-SIM380>3.0.CO;2-3
- Liu CJ, Hu -F-F, Xia M-X, et al. GSCALite: a web server for gene set cancer analysis. Bioinformatics. 2018;34(21):3771–3772. doi:10.1093/bioinformatics/bty411
- Coffelt SB, Kersten K, Doornebal CW, et al. IL-17-producing gammadelta T cells and neutrophils conspire to promote breast cancer metastasis. Nature. 2015;522(7556):345–348. doi:10.1038/nature14282
- Ngamcherdtrakul W, Yantasee W. siRNA therapeutics for breast cancer: recent efforts in targeting metastasis, drug resistance, and immune evasion. Transl Res. 2019;214:105–120. doi:10.1016/j.trsl.2019.08.005
- Zhang M, Liu ZZ, Aoshima K, et al. CECR2 drives breast cancer metastasis by promoting NF-kappaB signaling and macrophage-mediated immune suppression. Sci Transl Med. 2022;14(630):eabf5473. doi:10.1126/scitranslmed.abf5473
- Filip-Psurska B, Zachary H, Strzykalska A, Wietrzyk J. Vitamin D, Th17 Lymphocytes, and Breast Cancer. Cancers. 2022;14(15):3649. doi:10.3390/cancers14153649
- Masoumi J, Jafarzadeh A, Tavakoli T, et al. Inhibition of apelin/APJ axis enhances the potential of dendritic cell-based vaccination to modulate TH1 and TH2 cell-related immune responses in an animal model of metastatic breast cancer. Adv Med Sci. 2022;67(1):170–178. doi:10.1016/j.advms.2022.02.006
- Fridman WH, Pages F, Sautes-Fridman C, Galon J. The immune contexture in human tumours: impact on clinical outcome. Nat Rev Cancer. 2012;12(4):298–306. doi:10.1038/nrc3245
- Kim J, Bae JS. Tumor-associated macrophages and neutrophils in tumor microenvironment. Mediators Inflamm. 2016;2016:6058147. doi:10.1155/2016/6058147
- Yang W, Shi J, Zhou Y, et al. Integrating proteomics and transcriptomics for the identification of potential targets in early colorectal cancer. Int J Oncol. 2019;55(2):439–450. doi:10.3892/ijo.2019.4833
- Gholaminejad A, Fathalipour M, Roointan A. Comprehensive analysis of diabetic nephropathy expression profile based on weighted gene co-expression network analysis algorithm. BMC Nephrol. 2021;22(1):245. doi:10.1186/s12882-021-02447-2
- Zhou X, Zhang Y, Wang N. Systematic identification of key extracellular proteins as the potential biomarkers in lupus nephritis. Front Immunol. 2022;13:915784. doi:10.3389/fimmu.2022.915784
- Liu C, Jiang ZC, Shao CX, et al. Preliminary study of the relationship between novel coronavirus pneumonia and liver function damage: a multicenter study. Zhonghua Gan Zang Bing Za Zhi. 2020;28(2):107–111. doi:10.3760/cma.j.issn.1007-3418.2020.02.003
- Chen MM, Zeng G-P, Li J, et al. High infiltration of CD20(+) B lymphocytes in extranodal natural killer/T-cell lymphoma is associated with better prognosis. Br J Haematol. 2020;191(5):e116–e120. doi:10.1111/bjh.17069
- Song W, Ren J, Xiang R, Kong C, Fu T. Identification of pyroptosis-related subtypes, the development of a prognosis model, and characterization of tumor microenvironment infiltration in colorectal cancer. Oncoimmunology. 2021;10(1):1987636. doi:10.1080/2162402X.2021.1987636
- Malikov V, Meade N, Simons LM, Hultquist JF, Naghavi MH. IGF2R. Cell Rep. 2022;38(7):110396. doi:10.1016/j.celrep.2022.110396
- Liu B, Hu Y, Wan L, et al. Proteomics analysis of cancer tissues identifies IGF2R as a potential therapeutic target in laryngeal carcinoma. Front Endocrinol. 2022;13:1031210. doi:10.3389/fendo.2022.1031210
- Villatoro A, Cuminetti V, Bernal A, et al. Endogenous IL-1 receptor antagonist restricts healthy and malignant myeloproliferation. Nat Commun. 2023;14(1):12. doi:10.1038/s41467-022-35700-9
- Medova M, Medo M, Hovhannisyan L, et al. DNA-PK in human malignant disorders: mechanisms and implications for pharmacological interventions. Pharmacol Ther. 2020;215:107617. doi:10.1016/j.pharmthera.2020.107617
- Zhang HF, Hughes CS, Li W, et al. Proteomic screens for suppressors of anoikis identify IL1RAP as a promising surface target in Ewing sarcoma. Cancer Discov. 2021;11(11):2884–2903. doi:10.1158/2159-8290.CD-20-1690
- Herremans KM, Szymkiewicz DD, Riner AN, et al. The interleukin-1 axis and the tumor immune microenvironment in pancreatic ductal adenocarcinoma. Neoplasia. 2022;28:100789. doi:10.1016/j.neo.2022.100789
- Falls JG, Pulford DJ, Wylie AA, Jirtle RL. Genomic imprinting: implications for human disease. Am J Pathol. 1999;154(3):635–647. doi:10.1016/S0002-9440(10)65309-6