
Abstract
Radiosensitization using either metformin or 2-deoxy-d-glucose (2-DG) in various cancer cells has been reported. The present study reveals novel information on combining these drugs to enhance radiosensitization effect in breast cancer (BC) cells. Responses to low-dose Cobalt60 radiation, as well as a newly emerged radioiodine therapy target for BC, that is, sodium-iodide symporter (NIS or SLC5A5) protein, are tested. As therapeutic potential of NIS in BC is often limited due to low uptake and fast efflux rate of iodine, the scope of these two radiosensitizers to further improve NIS-mediated 131I therapeutic efficacy is explored. Two BC cell lines, MCF-7, and MDA MB231 are tested to optimize minimal drug doses required for radiosensitization. A combination of 2 mM metformin and 20 mM 2-DG with 2 grey (Gy) Cobalt60 radiation shows significant radiosensitization effect (P=0.0002). In cells treated with the combination therapy, increased γH2A.X foci formation was noted. Further, MCF-7 BC cells overexpressing NIS (MCF-7 NIS) was established, and using the optimized drug concentrations, significant radiosensitization (P=0.0019) by 50 μ Ci 131I usage was found to be the case as well. Apoptosis data corroborates with the result of clonogenic assay showing significant increase in apoptotic population upon dual drug-mediated radiosensitization. In case of metformin treatment, lowered adenosine triphosphate (ATP) content of the cell has been observed. The encouraging radiosensitization effect observed using combined 2-DG and metformin may aid in reducing Cobalt60 radiation exposure or for targeted radioiodine therapy in BC cells with NIS expression. This study indicates high potential of this drug combination in sensitizing BC cells for NIS-mediated-targeted radioiodine therapy, which otherwise may have lacked efficacy.
Introduction
Breast cancer (BC) is the most common form of cancer in female population all over the world. Major treatment strategy for BC includes surgery, chemotherapy, hormonal therapy, and radiation therapy. Radiation therapy usually extends patients’ survival; however, it has several side effects. Thus, reducing the dose of radiation to effectively kill the cancer cells with the aid of radiosensitizers has long been of great research interest. In addition, efficacious targeted radiotherapy option for various subtypes of BC is yet to develop. One such emerging strategy under active research investigation is the endogenous aberrant expression of sodium-iodide symporter (NIS or SLC5A5) protein, which can serve the purpose of the targeted radioiodine therapy. Human NIS is an integral membrane protein that is involved in active uptake of iodide ions inside the thyroid cells, which has a crucial function in delivering iodine content required for the synthesis of thyroid hormones T3 and T4. NIS overexpression also serves the basis for the targeted radioiodine therapy of patients with thyroid cancer since past 60 years.Citation1,Citation2 Study of NIS in BC was pioneered by Tazebay et al, showing NIS-positive expression in 80% patients with BC, whereas normal breast tissue samples examined from the patients who underwent reductive mamoplasty showed negative expression.Citation3 Following this study, many reports across the world confirmed high NIS expression in BC by various molecular analysis methods.Citation4–Citation9 In our own study, NIS expression was observed in 70% BC cases, where its expression was predominantly intracellular except in a few cases where NIS staining at the cell surface was also observed.Citation9
Translational-medicine-based studies have also been carried out for testing the efficacy of NIS-based therapy and diagnosis of malignant breast tissue. Moon et al reported significant 99mTcO4− uptake in four out of 25 patients with BC by scintigraphic scanning method.Citation10 In a very important study, Wapnir et al detected radioiodide uptake in metastatic BC by scintigraphic analysis using radioiodides (123I and 131I) or 99mTcO4−.Citation7 In this study, iodine uptake was noted in 25% of NIS-positive metastatic breast tissues (two out of eight). In addition, this study also showed significant suppression of thyroid radioiodine uptake by administration of agents like thyroxine and methimazole in trial patients. In another study, NIS expression was observed in 15 out of 23 patients with triple-negative BC, and membrane expression was observed in four patients with BC.Citation4 Further, radioiodide uptake was also demonstrated in tumor tissue by 123I scintigraphy in a patient with large primary BC; however, it was reported that had the isotope been 131I, the cumulative concentration of iodine in the tumor may not deliver sufficient therapeutic benefits.Citation4
Overall, these reports together suggest that NIS expression is high in BC as compared with normal breast tissue, but its expression is strong in a very small subset (<25%) of positive cases. This discrepancy widens the scope of multiple studies that have focused on modulating the expression level of NIS with agents such as retinoic acids and histone deacetylases before 131I therapy.Citation11–Citation13 Another strategy that is still unexplored is to enhance the 131I treatment efficacy itself by using radiosensitizer drugs. Use of radiosensitizers may enhance cytotoxicity of 131I therapy in case of a very low iodine uptake when NIS expression is low. At the same time, with the use of radiosensitizers, a lower concentration of 131I can be used when NIS expression is high, which may benefit by minimizing the side effects of radiation in other NIS-expressing tissues, where entry of radioiodine cannot be avoided. Further, without the presence of a defined iodide organification mechanism in BC cells, radiosensitizers may enhance radio-ablative effect even during the short presence of 131I inside these cells. Since radiation therapy is known to show cytotoxicity via free radical-mediated oxidative damage, it has been proposed that combining radiation therapy with agents that cause oxidative stress-induced injury may sensitize cells to the cytotoxic effect of radiation.Citation14,Citation15 Thus, 2-deoxy-D-glucose (2-DG) shows good radiosensitization effect by disrupting thiol metabolism and increasing oxidative stress.Citation16–Citation19 Another drug used in this study is metformin (a bi-guanide drug and activator of AMP-activated protein kinase [AMPK]), which has been reported as a radiosensitizer for BC cells and showed eradication of radioresistant cancer stem cells by activating AMPK and suppressing mTOR.Citation20
To date, this is the first study to show the combination of 2-DG and metformin as radiosensitizers for the enhancement of Cobalt60 or 131I radio-ablative effect on the cancer cells. We focus on combining the two radiosensitizer drugs against the two different radiation exposure methods and measuring the benefit using BC cells. We show that a combination of metformin and 2-DG along with Cobalt60 radiation or NIS-mediated 131I radiation shows significantly enhanced cytotoxicity. To the best of our knowledge, this is also the first report where radiosensitization effect alone has been shown to enhance NIS-mediated 131I therapy efficacy in BC cell model.
Materials and methods
Materials
MCF-7 and MDA MB231 BC cell lines were from ATCC (Manassas, VA, USA). RPMI1640 (Cat # 31800-022) and L15 (41300021) media, fetal bovine serum (10082-147), Trypsin-ethylenediaminetetraacetic acid (EDTA) (25300-062), lipofectamine 2000 (11668-027), and Hank’s Balanced Salt Solution (HBSS, 24020-117) were obtained from Thermo Fisher Scientific (Waltham, MA, USA). pattB-CAG plasmid vector was obtained from Addgene (Cambridge, MA, USA). 2-DG (D8375), metformin (PHR 1084), propidium iodide (PI, P4170), 4′,6-diamidino-2-phenylindole (DAPI, D8417), and MTT (M5655) were obtained from Sigma-Aldrich Co (St Louis, MO, USA). Monoclonal human NIS antibody (ab17795) and annexin V FITC (fluorescein isothiocyanate) apoptosis detection kit (ab14085) were obtained from Abcam (Cambridge, UK). H2A.X monoclonal antibody (MA5-15130) and anti-mouse (35512) and anti-rabbit Dylite633 (35562) antibody were obtained from Thermo Fisher Scientific. Enliten ATP assay kit (FF2000) was from Promega Corporation (Fitchburg, WI, USA). The authors advise no ethical approval was required for this study, as they did not use any human tissue samples, and the complete study was performed using well established breast cancer cell lines.
MTT assay
A total of 5,000 cells/well were seeded in 96-well plate. Cells were allowed to adhere overnight before they were treated with mentioned drug doses of metformin or 2-DG. After 48 hours of treatment, cell viability was measured by MTT assay, and data are represented as percentage cell viability as compared with the untreated cells.
Preparation of NIS overexpression plasmid
NIS gene was inserted immediately downstream of chicken β-actin promoter in pcDNA3.1+ attB-CAG-FTT (Fluc2-tdtomato-thymidine kinase) vector system. Briefly, NIS gene was amplified by polymerase chain reaction using primers containing Nhe-I and Not-I restriction sites. The pcDNA3.1+ attB vector was digested with Nhe-I and Not-I, which released the FTT reporter from vector backbone. Further, NIS gene and attB vector backbone were ligated. Positive colonies were screened for NIS gene insertion by enzyme digestions and sequencing.
Preparation of NIS expressing BC cell line
MCF-7 BC cells were co-transfected by lipofectamine 2000 with pcDNA 3.1+ attB-CAG-NIS vector and integrase vector. We used integrase-based transfection method, where the plasmid vector contained bacterial attachment site (attB) upstream to chicken β-actin promoter.Citation21 As the plasmid contained neomycin gene, positive clones were selected using 500 μg G418. The isolated cell colonies were expanded and checked for NIS expression by immunofluorescence assay and functionally validated for iodine uptake. Cells obtained showed different levels of NIS expression and thus different levels of iodine uptake. The single cell colony (MCF-7 NIS) showing high expression of NIS protein, as well as good iodine uptake, was used for radiosensitization experiments.
Iodine uptake assay
A total of 50,000 MCF-7 NIS cells were seeded in 24-well plate in duplicates and incubated with 2 μCi 125I/mL for 1 hour in uptake buffer (10 mM, 4-(2-hydroxyethyl)-1-piperazineethanesulfonic acid [HEPES] in HBSS). At the end of 1 hour, medium was removed and cells were washed once with cold uptake buffer, trypsinized, and collected. The iodine uptake in the collected cells is measured by beta counter. For showing NIS-specific iodine uptake, the sodium transporter was blocked by addition of 30 μM KClO4 along with 125I.
Iodine efflux assay
A total of 50,000 cells were seeded in 24-well plate in duplicates and incubated with 125 I for 1 hour. At the end of 1 hour, 125 I-containing medium was removed and replaced with plain medium without 125 I. Cells were collected at the mentioned time points and remaining 125I activity was measured by beta counter.
Clonogenic assay
In this assay, 2×10⁶ cells were seeded in 25 mm flask and incubated with 50 μCi 131I/mL in HBSS for 5–6 hours. At the end of the time point, 131 I-containing medium was removed, and cells were washed with cold HBSS. Cells were trypsinized, and 1,000 cells were seeded in six-well plates in triplicates. Medium was changed at regular intervals, and after 14 days, cells were fixed with 10% formaldehyde and stained with 4% crystal violet in methanol. Stained colonies were counted under stereomicroscope, and survival fraction was calculated according to the protocol mentioned in a previous publication.Citation22 All the drug treatments were given 12 hours before the 131 I treatment/radiation therapy and were replaced by plain medium after 12 hours of 131I treatment, and assay was performed after 24 hours of treatment.
Immunofluorescence for NIS and γH2A.X foci assay
Cells were seeded on cover slip in 35 mm plate, and after drug/radiation/131I treatment, they were washed with 1× phosphate buffered saline (PBS) for three times and fixed with 4% para formaldehyde in PBS at 37°C. An additional permeabilization step with 0.2% TritonX 100 in 4% para formaldehyde was carried out for foci staining. Non-specific sites were blocked using 2% bovine serum albumin in PBS. Cells were then incubated with γH2A.X or NIS antibody in 1:400/1:50 dilutions, respectively, for overnight at 4°C in a humid chamber. After incubation with primary antibody, cells were washed with 1× PBS and incubated with either anti-rabbit Dylight633 or anti-mouse Dylight633 secondary antibody, respectively (1:200) for 1 hour at room temperature in dark humid chamber. Cells were washed with 1× PBS, and nucleus was stained with DAPI. Cells were mounted with Vecta Shield, and images were captured under confocal microscope (LSM510, Zeiss). Foci assay was performed at the immediate end of radiation/131I treatment. For quantification of the foci, intensity of staining in red channel was measured by ImageJ software. For each treatment, 50 cells were analyzed, and average fluorescence intensity was plotted.
Cell cycle analysis and apoptosis assay
At the mentioned time points, 1×10⁶ cells were trypsinized, collected, and washed with 1× PBS. For cell cycle analysis, cells were fixed with 70% ethanol and incubated overnight at −20°C. Next day, cells were pelleted and washed with 1× PBS. Washed cells were treated with 1 μg/mL RNase A for 10 minutes at 37°C. Then, 300 μL of 50 μg/mL propidium iodide was added in each tube, incubated for 30 minutes at 37°C, and acquired in FACSCalibur™.
For apoptotic cell count, annexin V apoptosis detection kit was used, and the protocol mentioned in the kit was followed.
ATP measurement
Total cellular ATP was determined using manufactured recommended protocol of luciferase-based ATP detection kit. Total ATP was measured after 24 hours of radiation or 131I therapy.
Statistics
Data are presented as mean ± standard error. Student’s t-test was used to judge the significance of difference. All tests were two-sided, and P<0.05 was considered as significant. Graph pad Prizm software was used for all the statistical analysis.
Results
A combination of 2-DG and metformin enhances tumor cell ablation upon Cobalt60 radiation treatment
To determine the cytotoxic effect of 2-DG and metformin, BC cell lines were first exposed to various concentrations of these two drugs ranging between 0.1 mM and 100 mM, and viable cell count was measured by MTT assay (). Further, based on the MTT data, 10–50 mM dose of 2-DG and 2–10 mM dose of metformin were combined with 1 or 2 grey (Gy) Cobalt60 radiation to determine the minimal optimum drug dose required for maximum radiosensitization, and cell survival analysis was performed by clonogenic assay in MCF-7 cells. We observed that a combination of 20 mM 2-DG with 1 Gy reduced twofold cell survival as compared with 1 Gy radiation alone, while its combination with 2 Gy radiation showed 1.6-fold decrease in cell survival than radiation alone (). Further increment in 2-DG dose did not show any significant enhancement in radiosensitization effect. Similarly, treatment of cells with metformin showed dose-dependent radiosensitization effect (). Combination of 2 mM metformin with 1 Gy radiation dose showed 1.5-fold decrease in cell survival as compared with 1 Gy radiation alone, while the combination of 2 mM metformin with 2 Gy radiation resulted in 1.9-fold decrease in cell survival as compared with 2 Gy radiation alone.
Figure 1 Effect of 2-DG, metformin, and their combination with Cobalt60 radiation on MCF-7 cells.
Abbreviations: 2-DG, 2-deoxy-d-glucose; ATP, adenosine triphosphate; Gy, grey; Met F, metformin; SEM, standard error of mean.
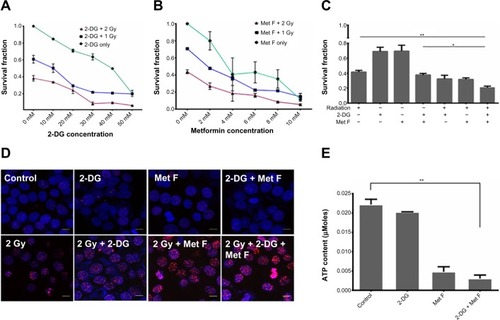
Upon deciding the effective minimal drug doses, we also combined both the drugs and tested in combination with 2 Gy Cobalt60 radiation. Cell survival showed significant drop in cells treated with dual drug radiosensitization to that of cells treated with radiation alone (P=0.0094, CI =95%) (). In addition to MCF-7 cells, we also evaluated the effect of radiosensitizers on Cobalt60 radiotherapy in MDA MB231 cells (). In MDA MB231 cells, 4 mM metformin and 5 mM 2-DG dose showed radiosensitization with 1 Gy, as well as 2 Gy, radiation dose. Further, combination of both the drugs with 2 Gy radiation showed significant decrease in cell survival as compared with 2 Gy radiation alone (P=0.0020, CI =95%). Further, γH2A.X foci assay was performed to ensure increased cell death is associated to increased DNA double-strand break (), and quantification of the immunofluorescence images indicated increase in foci intensity in cells treated with drug for 12 hours followed by the measured radiation exposure as compared with cells treated with similar radiation dose alone (). In case of untreated cells or cells treated with drugs alone, foci formation is recorded as negligible. Since metformin and 2-DG therapy are known to reduce ATP content of the cell, we also analyzed ATP content with or without drug treatment and observed a significant drop in cells treated with metformin (P=0.0058, CI =95%), whereas this drop was not significant when cells were treated with 2-DG alone (). Further decrease in ATP content was noted when both the drugs were combined.
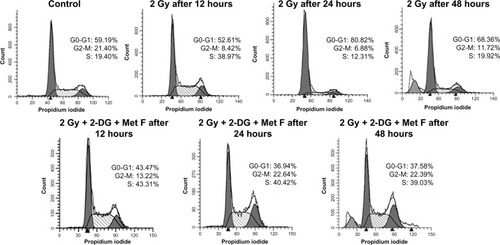
Cell cycle analysis was also performed at different time points after the combination therapy, which revealed S-phase arrest after 12 hours of treatment in combination as well as in case of only radiation therapy (). It was also observed that after 24 hours and 48 hours of combination therapy, cells remained arrested in S phase, whereas in case of only radiation therapy, this arrest was relieved at these time points, indicating prolonged cytotoxic effect of combination therapy.
Figure 2 Cell cycle status at different time points of treatment of MCF-7 cell.
Abbreviations: 2-DG, 2-deoxy-d-glucose; Gy, grey; Met F, metformin.
Established BC cell line overexpressing cell membrane NIS protein demonstrates good iodine influx for short duration
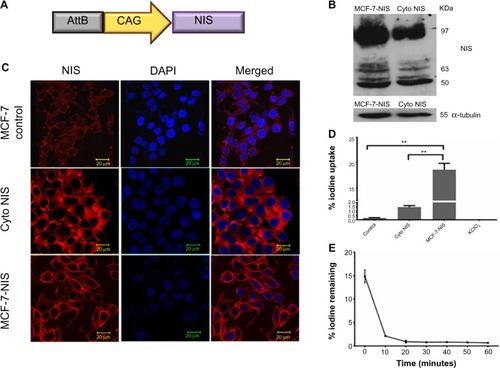
For effective iodide accumulation inside cells, the presence of NIS transporter protein on cell membrane is crucial. Keeping this fact in mind, we engineered a mammalian expression vector for expressing NIS () and isolated MCF-7 BC clonal cell variants with abundant NIS protein localized either on the cell membrane or in the cytoplasm. NIS transcript and protein expression were confirmed by real-time PCR (data not shown), western blot analysis (), and immunofluorescence (). As shown in , when NIS protein was expressed on the membrane, significantly high iodine accumulation took place as compared with the cells where NIS was localized predominantly in the cytoplasm (P=0.0028. CI =95%) or the baseline MCF-7. Treatment of NIS-positive cells with KClO4, a competitive iodide inhibitor, showed complete inhibition of iodine uptake in cells, indicating NIS-specific iodine uptake. Further, to estimate the duration of iodine retention in membrane expressing clones (MCF-7 NIS), efflux assay was performed, and the results showed that 90% iodine was released within 15 minutes of incubation ().
Figure 3 Characterization of MCF-7 cells stably expressing NIS.
Abbreviations: AttB, attachment site of bacteria; CAG, synthetic promoter made by fusion of various elements; Cyto, cytoplasmic; DAPI, 4′,6-diamidino-2-phenylindole; NIS, sodium-iodide symporter; SEM, standard error of mean.
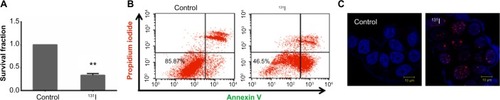
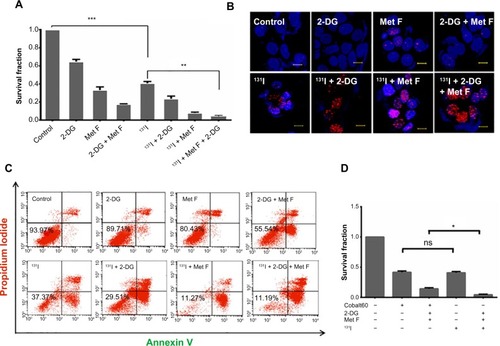
We have also evaluated the therapeutic efficacy of 131I treatment on MCF-7 NIS membrane expressing cell line by measuring the survival fraction by clonogenic assay. As detailed in the “Materials and methods” section, a brief exposure of these cells to 50 μCi 131I was found to reduce cell survival significantly (P<0.0001, CI =95%) than the untreated cells (). Radiation injury causing cellular apoptosis was assessed by annexin V staining protocol, which showed 46.5% live cells in case of 131I treatment as compared with 86% in control (). To confirm that such brief and low-dose exposure of MCF-7 NIS cell still cause DNA double-strand break, γH2A.X foci formation assay was performed at different time intervals after 131I treatment. Formation of a significantly large number of foci in treated cells was noted as compared with the untreated cells at 12 hours post-treatment time point (). However, γH2AX time kinetics did show that at 48 hours, the number and size of foci significantly diminished (data not shown). Thus, together our results confirm that although major amount of iodine was effluxed out by these cells within a short duration, still sufficient radio-ablative effects on MCF-7 NIS cell were evident.
Figure 4 Cytotoxic effect of radioiodine therapy in MCF-7 cells stably expressing NIS.
Abbreviations: NIS, sodium-iodide symporter; SEM, standard error of mean.
Treatment efficacy of radioiodine (131I) is significantly enhanced by 2-DG and metformin combination
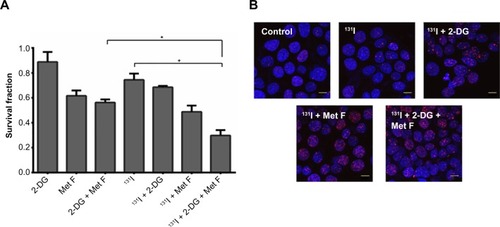
The effective 2-DG and metformin dose of 20 mM and 2 mM, respectively, was tested prior to Cobalt60 radiation treatment. The similar treatment was applied in combination with 131I radioisotope in NIS expressing cells. Treatment of cells with 100 μCi of 131I alone resulted in high number of cell death (data not shown), making radiosensitization effects obscure, a lowered concentration (50 μCi) of 131I was used for all the experiments. Combination of dual drugs with 50 μCi 131I showed 9.5-fold decrease in survival fraction when compared with the cells treated with 131I alone (P=0.0019) and fourfold decrease when compared with cells treated with the two drugs alone (P=0.0036) (). The change in cell survival was further confirmed by annexin V staining to measure apoptosis in parallel (). Cells were analyzed for apoptosis after 48 hours of treatment, and it was observed that live cell population was 37.37% in case of 131I therapy, whereas it was only 11% for the combination therapy. When cells were treated with both the drugs together in absence of 131I, 55.54% cells were alive. Thus, the combination of both the drugs with 131I therapy in NIS-expressing cells results in a significant drop in live cell population. Further γH2A.X foci immunofluorescence staining showed increase in number and intensity variation of foci in case of combined treatment, while in case of 131I treatment alone, the number and size of foci were much lower ( and ). We also performed cell cycle analysis after 48 hours of the combination treatment and a very slight S-phase elongation was observed, which was not significant (data not shown). Finally, we compared cytotoxic efficacy of 2 Gy Cobalt60 radiation with that of the 50 μCi 131I, which showed a comparable cell survival fraction (). However, in the presence of the radiosensitizers, a significantly lower survival fraction in 131I than in Cobalt60 radiation was noted (P=0.0201, CI =95%). This result confirms that the combination of 2-DG and metformin can effectively radiosensitize BC cell and thus can be combined with either Cobalt60 radiation or NIS-targeted radioiodine therapy.
Figure 5 Effect of 2-DG, metformin, and their combination with 131I treatment on different prospects of MCF-7 NIS cells.
Abbreviations: 2-DG, 2-deoxy-d-glucose; Met F, metformin; NIS, sodium-iodide symporter; ns, not significant.
Since in majority of the patients with BC, NIS expression is localized in the cytoplasm, it is important to evaluate the effect of radiosensitizers combined with 131I in plain MCF-7 cells. Our data suggest that treatment with 50 μCi 131I results in 30% cell death () as opposed to 60% death in case of MCF-7 NIS overexpressing cells. However, addition of radiosensitizers to the 131I therapy results in significant increase in cell death (70%) as compared with 131I alone (P=0.0110, CI =95%). Thus, combination therapy of 131I with radio sensitizers in MCF-7 cells is as effective as 131I therapy alone in MCF-7 NIS cells, where NIS is localized at membrane. We also performed γH2A.X assay to evaluate DNA damage response in plain MCF-7 cells in presence or absence of radiosensitizers (). Our data showed foci formation post-131I therapy in plain MCF-7 cells. Quantification of immunofluorescence images showed increased focal intensity after addition of radiosensitizers (). As expected, the intensity of foci in MCF-7 plain cells was much less than the intensity in MCF-7 NIS cells undergoing the same treatment.
Figure 6 Effect of 2-DG, metformin, and their combination with 131I treatment on survival of plain MCF-7 cells.
Abbreviations: 2-DG, 2-deoxy-d-glucose; Met F, metformin; NIS, sodium-iodide symporter; PI, propidium iodide.
Discussion
In the present study, we have combined 2-DG and metformin to sensitize radio-ablative effect in BC cell and tested the cytotoxic efficacy in combination with two different sources of radiation, that is, Cobalt60 radiation or 131I in NIS-expressing MCF-7 cells. 2-DG treatment creates a glucose-deprived state preferentially in cancer cells, and output from glycolysis and pentose phosphate pathway is reduced. Metformin is a bi-guanide and anti-diabetic drug, which inhibits gluconeogenesis in liver, and thus helps to control the sugar levels in patients with diabetes. Previously, metformin was also known to inhibit proliferation of a large range of cancer cells by inducing apoptosis.Citation23–Citation26 It has also been shown recently to target cancer-initiating cells.Citation27 Individually, the use of 2-DG and metformin has been reported as radiosensitizer,Citation19,Citation20,Citation28 whereas the use of both in combination with low-dose radiation (either from Cobalt60 source or NIS gene-targeted radioiodine [131I]), which is shown for first time during this study, indicated much enhanced radio-ablative effect than using either of the drugs alone. To avoid drug toxicity at higher doses, we used very low dose of these drugs as radiosensitizers, as evident from MTT assay (). We observed nearly twofold decrease in survival fraction upon 2 mM metformin treatment in combination with 2 Gy radiation as compared with radiation alone, which corroborates with the earlier study by Song et al, where 5 mM metformin showed radiosensitization effect in MCF-7 cells.Citation20 When 20 mM 2-DG was combined with 2 Gy radiation dose, we observed 1.6-fold decrease in cell survival as compared with radiation alone as was reported in a study by Lin et al.Citation12 The minor variation in our results may be due to differences in accurate drug dosing, timing of 2-DG, and radiation dose. However, when we combine both 2-DG and metformin with 2 Gy radiation dose, we observe a dramatic difference in cell survival, a nearly threefold decrease (P=0.0094, CI =95%) as compared with 2 Gy radiation alone. Combined drug treatment-mediated cell death proved to be a more significantly enhanced radiosensitization effect than any of the treatment.
Further, our study on γH2A.X foci formation suggests increase in the intensity of foci in case of dual-drug combined treatment than radiation alone, confirming radiosensitization by these agents. It is noteworthy here that cellular heterogeneity for foci formation encountered can possibly be explained by the presence of cells at different stages of cell cycle. Previous reports suggest the action of metformin and 2-DG is due to lowered ATP content of the cell. Metformin alters mitochondrial oxidative phosphorylation, and 2-DG inhibits ATP synthesis through glycolysis. Therefore, we have also evidenced lowered ATP content of the cell in case of metformin or dual-drug treatment, but not the 2-DG treatment. Further, we looked into cell cycle status under different drug treatment conditions and observed that combined treatment resulted in elongation of S phase. This S-phase elongation was also observed in case of radiation but was relieved after 48 hours of treatment, whereas it remained nearly constant in case of combination therapy even at 48 hours.
Since 20 mM 2-DG and 2 mM metformin showed effective radiosensitization with Cobalt60 radiation, we maintained the similar dose and time points in experiments combining 2-DG and metformin with 131I treatment in MCF-7 NIS and plain MCF-7 cells. The use of 100 μCi 131I treatment alone resulted in complete cell death (data not shown). Therefore, 50% lower dose of 131I (ie, 50 μCi) was attempted, which showed 1.5-fold decrease in survival fraction in MCF-7 NIS cells as compared with untreated cells. Thus, for all the radioiodine therapy experiments, only 50 μCi of 131I was used. Even at this low radiation dose, the dual-drug use for radiosensitization showed significant decrease in cell survival, which is near-equivalent to the twofold higher dose (ie, 100 μCi alone) of 131I. Apoptosis data corroborate with the result of clonogenic assay, showing significant increase in apoptotic population with the addition of dual-drug radiosensitizers. We have also performed cell cycle analysis after 48 hours of treatment but did not observe any significant differences among samples with different treatments (data not shown). Since localization of NIS is crucial for 131I therapy and various reports suggest cytoplasmic localization of NIS in breast tumor tissues, it is important to evaluate the potential of radio sensitizers with 131I therapy in plain MCF-7 cells. Our results indicate that although 131I therapy alone shows minimal effect on cell survival, combination of radioiodine with radiosensitizers results in significant loss of live cell population in plain MCF-7cells. Thus, the present study demonstrates the potential of metformin and 2-DG combination treatment as radiosensitizer in combination with Cobalt60 or 131I radiation in NIS-expressing cells. The combination can deliver better therapeutic efficacy than using either of these drugs as a single agent. In addition to their drug toxicity, such radiosensitization effect may further boost mass reduction in cancer cases. To note, at present, there are ongoing clinical trials with both these drugs either in combination with chemotherapy or with radiation.Citation29,Citation30 Thus, combination of 2-DG and metformin with Cobalt60 radiation might play an even more important role in sensitizing radioresistant population as was observed previously with combination of metformin and radiation.Citation20 Previous reports suggest that combination of metformin and 2-DG induces p53-dependent apoptosis in prostate cancer cells through AMPK pathway and metformin inhibits 2-DG induced autophagy in these cells.Citation31 In future, it will be interesting to understand how these mechanistic pathways are regulated when Cobalt60 radiation or 131I is combined with these two drug combination. Further, it would also be important to understand the effect of these drugs in vivo in combination with 131I in NIS-expressing breast tumor in preclinical and clinical settings.
Conclusion
In the present study, we have shown the use of a combination of two radiosensitizers, 2-DG and metformin, to enhance the radio-ablative effect in combination with either Cobalt60 radiation or targeted NIS-mediated radioiodine therapy. The combination of the radiosensitizers improves therapeutic efficacy effectively in BC cell lines than using any one of the radiosensitizers. Thus, in addition to the drug cytotoxicity, the radiosensitization effect may further boost effective mass reduction in pre-surgical cancer cases.
Disclosure
The authors report no conflicts of interest in this work.
Acknowledgments
Radioactive iodine-related experiments were carried out in the Radiation Medicine Centre, TATA Memorial Hospital campus, Mumbai, India. Research funding from the Indian Council for Medical Research, New Delhi, to AD (reference number 5/13/25/10/NCD-III); and personal support from the Advanced Centre for Treatment, Research and Education in Cancer, Tata Memorial Centre, to SC for graduate study, is also acknowledged.
Supplementary materials
Figure S1 Cytotoxic effect of 2-DG and metformin in (A) MCF-7 and (B) MDA MB 231 breast cancer cell lines.
Abbreviations: 2-DG, 2-deoxy-d-glucose; Met F, metformin.
Figure S2 Effect of 2-DG, metformin, and their combination with Cobalt60 radiation on MDA MB 231 cells.
Abbreviations: 2-DG, 2-deoxy-d-glucose; Ctrl, control; Gy, grey; Met F, metformin; ns, not significant.
Figure S3 Effect of Cobalt60 radiation and it’s combination with 2-DG and Met F on foci formation in MCF-7 cells.
Abbreviations: 2-DG, 2-Deoxy-d-glucose; DAPI, 4′,6-diamidino-2-phenylindole; Gy, grey; IF, immunofluorescence; Met F, metformin; MFI, mean fluorescence intensity.
Figure S4 (A) Foci assay images from (MCF-7 NIS cells treated with 131I and its combination with radio sensitizers) showing foci staining with dylight 633 secondary antibody in red channel, nucleus stained with DAPI in blue channel, and merged image showing colocalization of foci with nucleus. Scale bars represent 10 μm. (B) Quantification of foci from the IF images. In each sample, 50 cells were quantified for intensity of staining from various fields of the cover slip.
Figure S5 (A) Foci assay images from (MCF-7 plain cells treated with 131I and its combination with radio sensitizers) showing foci staining with dylight 633 secondary antibody in red channel, nucleus stained with DAPI in blue channel, and merged image showing colocalization of foci with nucleus. Scale bars represent 10 μm. (B) Quantification of foci from the IF images. In each sample, 50 cells were quantified for intensity of staining from various fields of the cover slip.
References
- KestonASBallRPFrantzVKPalmerWWStorage of radioactive iodine in a metastasis from thyroid carcinomaScience194295246636236317745299
- SeidlinSMRossmanIOshryESiegelERadioiodine therapy of metastases from carcinoma of the thyroid; a 6-year progress reportJ Clin Endocrinol Metab19499111122113715395978
- TazebayUHWapnirILLevyOThe mammary gland iodide transporter is expressed during lactation and in breast cancerNat Med20006887187810932223
- RenierCVogelHOfforOYaoCWapnirIBreast cancer brain metastases express the sodium iodide symporterJ Neurooncol201096333133619618116
- RyanJCurranCEHennessyEThe sodium iodide symporter (NIS) and potential regulators in normal, benign and malignant human breast tissuePLoS One201161e1602321283523
- UpadhyayGSinghRAgarwalGFunctional expression of sodium iodide symporter (NIS) in human breast cancer tissueBreast Cancer Res Treat200377215716512602914
- WapnirILGorisMYuddAThe Na+/I- symporter mediates iodide uptake in breast cancer metastases and can be selectively down-regulated in the thyroidClin Cancer Res200410134294430215240514
- WapnirILvan de RijnMNowelsKImmunohistochemical profile of the sodium/iodide symporter in thyroid, breast, and other carcinomas using high density tissue microarrays and conventional sectionsJ Clin Endocrinol Metab20038841880188812679487
- ChatterjeeSMalhotraRVargheseFQuantitative immunohistochemical analysis reveals association between sodium iodide symporter and estrogen receptor expression in breast cancerPLoS One201381e5405523342072
- MoonDHLeeSJParkKYCorrelation between 99mTc-pertechnetate uptakes and expressions of human sodium iodide symporter gene in breast tumor tissuesNucl Med Biol200128782983411578905
- KogaiTTakiKBrentGAEnhancement of sodium/iodide symporter expression in thyroid and breast cancerEndocr Relat Cancer200613379782616954431
- LiuZXingMInduction of sodium/iodide symporter (NIS) expression and radioiodine uptake in non-thyroid cancer cellsPLoS One201272e3172922359623
- KogaiTSchultzJJJohnsonLSHuangMBrentGARetinoic acid induces sodium/iodide symporter gene expression and radioiodide uptake in the MCF-7 breast cancer cell lineProc Natl Acad Sci U S A200097158519852410890895
- BiaglowJEClarkEPEppERMorse-GuadioMVarnesMEMitchellJBNonprotein thiols and the radiation response of A549 human lung carcinoma cellsInt J Radiat Biol Relat Stud Phys Chem Med19834454894956605951
- MitchellJBRussoAThe role of glutathione in radiation and drug induced cytotoxicityBr J Cancer19878Suppl96104
- BlackburnRVSpitzDRLiuXMetabolic oxidative stress activates signal transduction and gene expression during glucose deprivation in human tumor cellsFree Radic Biol Med1999263–44194309895234
- ParniakMKalantNIncorporation of glucose into glycogen in primary cultures of rat hepatocytesCan J Biochem Cell Biol19856353333403893656
- SpitzDRSimJERidnourLAGaloforoSSLeeYJGlucose deprivation-induced oxidative stress in human tumor cells. A fundamental defect in metabolism?Ann N Y Acad Sci200089934936210863552
- LinXZhangFBradburyCM2-Deoxy-D-glucose-induced cytotoxicity and radiosensitization in tumor cells is mediated via disruptions in thiol metabolismCancer Res200363123413341712810678
- SongCWLeeHDingsRPMetformin kills and radiosensitizes cancer cells and preferentially kills cancer stem cellsSci Rep2012236222500211
- GrothACOlivaresECThyagarajanBCalosMPA phage integrase directs efficient site-specific integration in human cellsProc Natl Acad Sci U S A200097115995600010801973
- FrankenNARodermondHMStapJHavemanJvan BreeCClonogenic assay of cells in vitroNat Protoc2006152315231917406473
- Ben SahraILaurentKLoubatAThe antidiabetic drug metformin exerts an antitumoral effect in vitro and in vivo through a decrease of cyclin D1 levelOncogene200827253576358618212742
- BuzzaiMJonesRGAmaravadiRKSystemic treatment with the antidiabetic drug metformin selectively impairs p53-deficient tumor cell growthCancer Res200767146745675217638885
- DowlingRJGoodwinPJStambolicVUnderstanding the benefit of metformin use in cancer treatmentBMC Med201193321470407
- ZakikhaniMDowlingRFantusIGSonenbergNPollakMMetformin is an AMP kinase-dependent growth inhibitor for breast cancer cellsCancer Res20066621102691027317062558
- HirschHAIliopoulosDTsichlisPNStruhlKMetformin selectively targets cancer stem cells, and acts together with chemotherapy to block tumor growth and prolong remissionCancer Res200969197507751119752085
- DwarkanathBSZolzerFChandanaSHeterogeneity in 2-deoxy-D-glucose-induced modifications in energetics and radiation responses of human tumor cell linesInt J Radiat Oncol Biol Phys20015041051106111429233
- CazzanigaMBonanniBGuerrieri-GonzagaADecensiAIs it time to test metformin in breast cancer clinical trials?Cancer Epidemiol Biomarkers Prev200918370170519240238
- MohantiBKRathGKAnanthaNImproving cancer radiotherapy with 2-deoxy-D-glucose: phase I/II clinical trials on human cerebral gliomasInt J Radiat Oncol Biol Phys19963511031118641905
- Ben SahraITantiJFBostFThe combination of metformin and 2-deoxyglucose inhibits autophagy and induces AMPK-dependent apoptosis in prostate cancer cellsAutophagy20106567067120559023