
Abstract
Background
Nevus sebaceous (NS) is a benign hamartoma of the skin, characterized by hyperplasia of the epidermis, in addition to immature hair follicles. The exact mechanisms of folliculo-sebaceous-apocrine defects and adnexal tumorigenesis are unknown in NS, but benign and malignant neoplasms are often due to a complex etiology in NS. Long noncoding RNAs (lncRNAs) have been implicated in various important biological processes and regulate inflammatory diseases and tumors. However, the role of lncRNAs in nevus sebaceous is unclear.
Objective
To identify NS-associated mRNA and lncRNA profiles and predict their potential roles in the development of the folliculo-sebaceous-apocrine unit and adnexal tumorigenesis.
Methods
RNA-seq was used to identify NS-associated genes and lncRNAs. Analysis software Illumina NovaSeq 6000 was used to analyze the sequences, and real-time PCR and Western blot were used to validate the differentially expressed genes. Competing endogenous RNAs (ceRNA) networks were constructed by prediction software TargetScan & miRanda.
Results
Many mRNAs were significantly differentially expressed between nevus sebaceous and adjacent normal scalp tissues. Among them, 72 were upregulated and 18 were downregulated. KEGG pathway analysis further revealed that 32 functional pathways were associated with the upregulated mRNAs, while only 1 pathway was associated with the downregulated mRNAs. Verification by real-time PCR and Western blot indicated that CDKN2AIP gene was downregulated consistently in NS tissue compared to normal scalp skin. Additionally, 7 upregulated and 10 downregulated significantly differentially expressed lncRNAs were detected between NS and adjacent normal scalp tissues. Three downregulated lncRNAs including AL355607.2, RP5-1024G6.8 and AC007780.1 were predicted to consistently associate with CDKN2AIP expression by competing endogenous RNAs(ceRNA) construction.
Conclusion
Both mRNA and lncRNA profiles were altered in NS scalp tissues. We identified a downregulated gene, CDKN2AIP, as a target of differentially expressed mRNA and predicted a ceRNA network of CDKN2AIP with differentially expressed lncRNA.
Introduction
Nevus sebaceous (NS) is a congenital hamartoma that combines a variety of epidermal, hair follicle, sebaceous, and apocrine gland abnormalities. NS is detected in 0.5–1% of all dermatologic patients, with a male: female occurrence ratio of 1:2.Citation1,Citation2 It usually occurs on the head and neck region and presents as a well-circumscribed, yellow to orange, hairless patch. Benign or malignant neoplasms may occur in NS, with an incidence as high as 39% as reported by Wilson-Jones and HeylCitation3 or 22.2% as reported by Beer et al.Citation4 The most prevalent secondary benign neoplasms are trichoblastoma and syringocystadenoma papilliferum(SCAP), while basal cell carcinoma (BCC) is the most common secondary malignant neoplasm.Citation5
RAS, a GTP-binding protein, promotes cell growth through activation of multiple pathways including the mitogen-activated protein kinase (MAPK) signal-transduction pathway. Activating mutations in this gene family have well-established links to various cancers.Citation6,Citation7 One study focused on the role of postzygotic HRAS and KRAS mutations in the development of both isolated nevus sebaceous and Schimmelpenning syndrome.Citation8 However, the precise molecular mechanism governing the role of RAS signaling in nevus sebaceous remains elusive.
In the human genome, approximately 93% of DNA can be transcribed as RNA, only 2% of which is protein-encoding (mRNA) and the remaining 98% referred to as noncoding RNA.Citation9 The role of protein-encoding mRNA in the pathogenesis of diseases has been extensively established. Recently, mounting evidence has described that non-protein-coding gene in the human genome may also play important roles in a variety of cellular processes. Noncoding RNA (ncRNA) refer to small ncRNA such as microRNA (miRNA, ~20 nucleotides in length) and long ncRNA (lncRNA, correspond to nucleotides typically larger than 200 bp in length).Citation10 In particular, lncRNA demonstrate important roles in epigenetic control and the regulation of transcription, RNA metabolism, cell autophagy and apoptosis, and embryonic development.Citation11–Citation13 Additionally, lncRNA may act as competing endogenous RNA (ceRNA), communicating with and regulating target mRNA by competing for binding to shared miRNA.Citation14,Citation15
Presently, lncRNA have been implicated across a variety of diseases including different types of cancer, neurological and cardiovascular diseases.Citation16–Citation18 Dysregulation of lncRNA has also been previously reported in dermatological diseases including systemic lupus erythematosus, malignant melanoma and hair disorders like androgenic alopecia and alopecia areata.Citation14,Citation19–Citation21 The functional significance and expression profile of lncRNA in nevus sebaceous have not been investigated. We speculate that lncRNA may be involved in the pathogenesis and development of nevus sebaceous. In order to test this hypothesis, RNA-seq analysis was used to analyze the genome-wide expression levels of mRNA and lncRNA in nevus sebaceous and paired adjacent normal scalp tissues.
Materials and Methods
Subjects
Four subjects diagnosed with nevus sebaceous between August 2020 and October 2020 at the Institute of Dermatology, Chinese Academy of Medical Sciences were recruited to participate in the study. Nevus sebaceous and normal skin tissues were obtained from scalp. Samples were stored in a −196°C liquid nitrogen for subsequent experiments. The diagnoses were confirmed by histopathology. Written informed consent was obtained from all participants and the study protocol was approved by the ethical committees of Institute of Dermatology, Chinese Academy of Medical Sciences (2021-KY-033).
RNA Sequencing
Total RNA was extracted by Trizol reagent (Invitrogen, California, USA) from frozen tissues according to the manufacturer’s standard protocol. The NanoDrop ND2000 (Thermo Fisher Scientific Inc, Waltham, MA) instrument was used to quantify total RNA and standard denaturing agarose gel electrophoresis was used to evaluate the quality of the RNA. An RNA Sequencing library was conducted by Reagent test kit according to the manufacturer’s instructions. The RNA sequencing library was assessed using Agilent 2100 Bioanalyzer (Agilent Technologies Inc, Santa Rosa, CA) and quantified by quantitative polymerase chain reaction (qPCR). Illumina NovaSeq 6000 was applied for sequencing.
Data Analysis
Raw sequencing data produced by Illumina NovaSeq 6000 went through quality control to evaluate whether it was suitable for subsequent analysis. Sequencing data was pretreated by removing 5’ as well as 3’ sequences and filtration of short fragments (less than 20bp) to produce trimmed data. The trimmed data was compared by String Tie software to the known transcriptome. The transcription abundance was then calculated by Ballgown (a R language package to analysis differential expression of RNA-Seq data). The unit of expression is expressed as fragments per kilobase of gene/ transcript model per million mapped fragments (FPKM). The expression threshold of a gene or transcript was set at FPKM ≥ 0.5. The following formula was used to calculate FPKM: (C: number of fragments compared to a gene/transcript; L: the length of a gene/transcript in kb. N: the total number of fragments aligned to genes/transcripts in a sample). Significantly differentially expressed (DE) genes or lncRNAs were identified through fold change as well as P value calculated by t-test. The threshold set for upregulated and downregulated genes was an average FPKM≥ 0.5, a |fold change|>1.5 and a level of significance P< 0.05.
Gene Ontology (GO) and KEGG (Kyoto Encyclopedia of Genes and Genomes) pathway analysis were applied to describe the possible function of these significantly differentially expressed mRNAs. GO analysis uses a statistical algorithm (Fisher’s exact test) to find out which specific functional items are most closely related to a set of differentially expressed genes. Each GO item in the analysis corresponds to a statistical p-value to indicate significance, the smaller the p-value, the greater the connection between the GO entry and the input differentially expressed genes. In the KEGG analysis, each pathway entry similarly corresponds to a statistical p-value to indicate significance. The smaller the p-value, the greater the connection between the pathway entry and the input differentially expressed genes.
Finally, scatter diagram, volcano plots and hierarchical clustering were performed to visually display the distinguishable genes’ expression pattern among the samples.
Real-Time PCR for Quantification of Differentially Expressed Genes
Total RNA was isolated by TRI Reagent (Sigma) from a 50–100mg tissue sample. A total of 1.5 µg RNA was reverse transcribed into complementary DNA (cDNA) using a SuperScriptTM III Reverse Transcriptase kit (Invitrogen). Additionally, 375 ng of cDNA was used for the subsequent qPCR performed with the 2X PCR master mix (Arraystar). Amplification was performed in an QuantStudio™ 5 Real-time PCR System (Applied Biosystems) where β-actin expression was selected as an internal control. The fold changes of genes between the NS group and the normal group were calculated using relative quantification (the 2−ΔΔCt method). Primers used are listed in .
Table 1 The Primer Sequences of Selected mRNA Genes and Transcripts That Were Differentially Expressed Between NS and Adjacent Normal Tissues
Western Blot Verification of Candidate Genes
Total protein from four pairs of NS and normal scalp tissues were extracted respectively by RIPA lysis buffer (P0013, Beyotime Institute of Biotechnology) with protease and phosphatase inhibitors (P1045, Beyotime Institute of Biotechnology) at 4°C. BCA kit (Beyotime) was used to measure the concentration of the total protein. Then, proteins were loaded onto 4–16% SDS-PAGE gel (120 V) (20µg/lane) and the separated proteins were transferred to Polyvinylidene Fluoride membranes (FFP24, Beyotime Institute of Biotechnology; 300 mA for 50 min). After treatment with 5% BSA for 1 h to reduce non-specific binding, membranes were incubated with primary antibodies including anti-CDKN2AIP (1:1000, proteintech) and anti-GAPDH (1:3000, proteintech) overnight at 4°C. A secondary antibody HRP-goat anti rabbit IgG (1:2000, abclonal) was incubated for 1 h at room temperature the following day. Protein signals were detected via enhanced chemiluminescence (ECL) and visualized by a chemi-luminescence detection system (Amersham Biosciences, Piscataway, NJ, USA).
Construction of the ceRNA Network
The ceRNA hypothesis states that RNA transcripts display an entire crosstalk capability through the mechanism of competitive binding on common microRNAs with microRNA response elements (MREs). To investigate potential targets of microRNAs, the target/microRNAs is typically predicted with miRNA target prediction software TargetScan & miRanda. To establish lncRNA‐miRNA‐mRNA network, we assayed potential targets of microRNAs that interacted with the candidate gene. CDKN2AIP was selected as the candidate gene due to consistent differential expression patterns verified by qPCR and western blot. By merging common targeted miRNAs between the CDKN2AIP mRNA and DE lncRNAs, we constructed a hypothetical ceRNA network.
Results
Differential Expression Profiles of mRNAs and lncRNAs
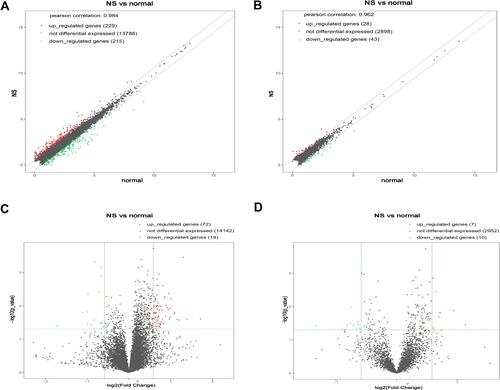
A total of 90 mRNAs were found to be significantly differentially expressed (based on a |fold change|>1.5 and a significance level of P<0.05) between nevus sebaceous and adjacent normal tissues, including 72 upregulated and 18 downregulated. Hierarchical clustering was used to describe the distribution of up-regulated and down-regulated mRNA in the different tissues (). Additionally, hierarchical clustering of the top 20 significantly differentially expressed mRNAs were illustrated (). With regard to lncRNA significantly differential expression, there were 7 upregulated and 10 downregulated lncRNAs identified between nevus sebaceous and adjacent normal tissues. Hierarchical clustering of the significantly differentially expressed lncRNAs are expressed in . Differences in mRNA and lncRNA expression levels (a |fold change|>1.5) between nevus sebaceous and adjacent normal tissues were depicted and evaluated using scatter plots ( and ). There were 229 upregulated, 215 down regulated, and 13,788 non differentially expressed mRNAs (Pearson’s correlation=0.984) () together with 28 upregulated, 43 down regulated, and 2898 non differentially expressed lncRNAs (Pearson’s correlation= 0.962) () between nevus sebaceous and adjacent normal tissues. Significantly different expression levels (a |fold change|>1.5 and a level of significance of P<0.05) of mRNA and lncRNA between NS and adjacent normal tissues were presented by volcano plot filtering ( and ). There were 72 upregulated, 18 down regulated, and 14,142 non- differentially expressed mRNAs () and 7 upregulated, 10 down regulated, and 2952 non-differentially expressed lncRNA () identified between NS and adjacent normal tissues.
Figure 1 The heat maps of significantly differentially expressed mRNAs and lncRNAs between NS and normal tissues. (A) All the significantly differential expression levels for mRNAs. (B) The top 20 upregulated and down regulated mRNAs. (C) All the differential expression levels for LncRNAs.
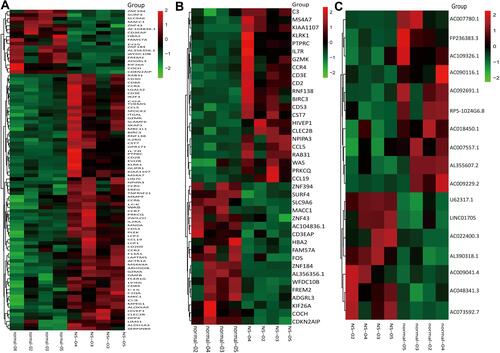
Figure 2 The scatter and volcano plot of differentially expressed mRNAs and lncRNAs. (A and B) Scatter plots indicate the distribution trend of differentially expressed mRNAs (A) and lncRNAs (B) between NS and normal tissues. (C and D) Volcano plots indicate the relationship between the fold change and the corresponding statistical significance of the differentially expressed mRNA (C) and lncRNA (D) across NS and normal tissues.
GO Functional Enrichment and KEGG Pathway Analysis
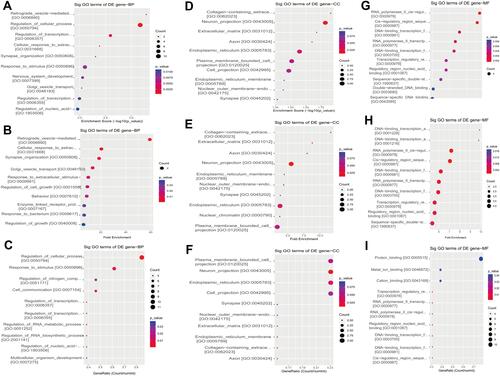
GO is a gene function classification which contains three sub-entries, including molecular function (MF), cellular component (CC), and biological process (BP). The significance of GO term enrichment in the significantly differentially expressed mRNA list is indicated by a P value. A lower P value indicates a more significant GO term. depicts the top 10 upregulated Enrichment Score terms, the top 10 upregulated Fold Enrichment terms and the top 10 upregulated Gene Ratio terms. GO analysis indicated that 698 BP, 82 CC and 78 MF were enriched by upregulated mRNA. The top 10 BP, CC, and MF identified in upregulated mRNAs are described in . Immune system process, cell periphery, and protein binding were the most enriched BP, CC and MF, respectively. On the other hand, downregulated mRNA mainly converged on 38 BP, 11 CC and 17 MF. The 10 most downregulated Enrichment Score terms, the 10 most downregulated Fold Enrichment terms and the 10 most downregulated Gene Ratio terms are described in . The top 10 BP, CC, and MF identified in downregulated mRNAs were described in . Among them, retrograde vesicle-mediated transport, collagen-containing extracellular matrix and RNA polymerase II cis-regulatory region sequence-specific DNA binding were the most enriched BP, CC and MF, respectively.
Figure 3 The 10 most upregulated GO functions in nevus sebaceous scalp tissues. (A) GO terms in the GO analysis that correlated with coding mRNA in biological process categories with the 10 lowest P values according to the enrichment score analysis. (B) GO terms in the GO analysis that correlated with coding mRNA in biological process categories with the 10 lowest P values according to fold enrichment analysis. (C) GO terms in the GO analysis that correlated with coding mRNA in biological process categories with the 10 lowest P values according to gene ratio analysis. (D) GO terms in the GO analysis that correlated with coding mRNA in cellular component categories with the 10 lowest P values according to enrichment score analysis. (E) GO terms in the GO analysis that correlated with coding mRNA in cellular component categories with the 10 lowest P values according to fold enrichment analysis. (F) GO terms in the GO analysis that correlated with coding mRNA in cellular component categories with the 10 lowest P values according to gene ratio analysis. (G) GO terms in the GO analysis that correlated with coding mRNAs in molecular function categories with the 10 lowest P values according to enrichment score analysis. (H) GO terms in the GO analysis that correlated with coding mRNA in molecular function categories with the 10 lowest P values according to fold enrichment analysis. (I) GO terms in the GO analysis that correlated with coding mRNA in molecular function categories with the 10 lowest P values according to gene ratio analysis.
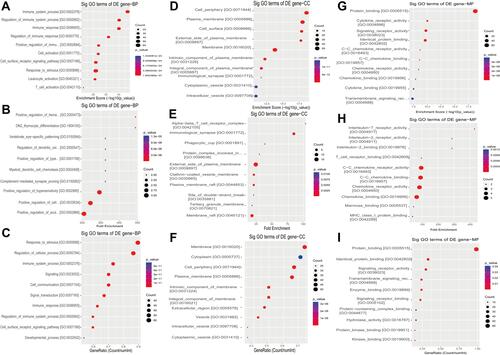
Figure 4 GO analysis of differentially expressed genes. (A and B) The bar graphs indicate the 10 GO entities upregulated (A) and downregulated (B) between NS and normal tissues according to statistical significance threshold.
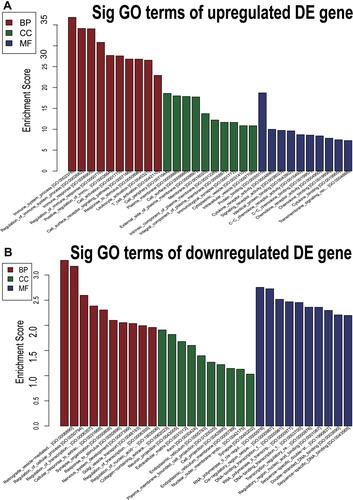
Figure 5 The 10 most downregulated GO functions in nevus sebaceous scalp tissue according to Enrichment Score, Fold Enrichment Terms and GeneRatio. (A) GO terms in the GO analysis that correlated with coding mRNA in biological process categories with the 10 lowest P values according to enrichment score analysis. (B) GO terms in the GO analysis that correlated with coding mRNA in biological process categories with the 10 lowest P values according to fold enrichment analysis. (C) GO terms in the GO analysis that correlated with coding mRNA in biological process categories with the 10 lowest P values according to gene ratio analysis. (D) GO terms in the GO analysis that correlated with coding mRNA in cellular component categories with the 10 lowest P values according to enrichment score analysis. (E) GO terms in the GO analysis that correlated with coding mRNA in cellular component categories with the 10 lowest P values according to fold enrichment analysis. (F) GO terms in the GO analysis that correlated with coding mRNA in cellular component categories with the 10 lowest P values according to gene ratio analysis. (G) GO terms in the GO analysis that correlated with coding mRNA in molecular function categories with the 10 lowest P values according to enrichment score analysis. (H) GO terms in the GO analysis that correlated with coding mRNA in molecular function categories with the 10 lowest P values according to fold enrichment analysis. (I) GO terms in the GO analysis that correlated with coding mRNA in molecular function categories with the 10 lowest P values according to gene ratio analysis.
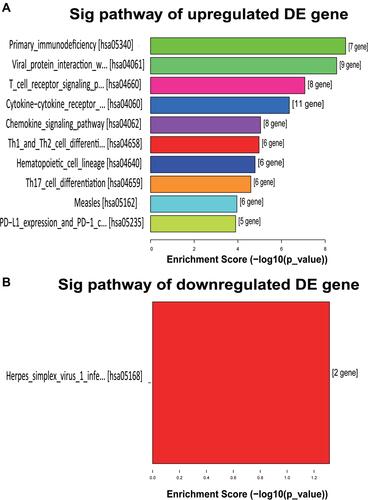
KEGG pathway enrichment analyses revealed that 45 upregulated and 2 downregulated genes were associated with different KEGG Pathways. and show the top 10 upregulated KEGG pathways and 1 downregulated pathway, respectively. According to the KEGG pathway analysis, primary immunodeficiency was the most enriched network, containing 7 differentially expressed target mRNA between the NS and normal tissues. The most enriched downregulated pathway was the Herpes simplex virus 1 infection, consisting of 2 differentially expressed target mRNA.
Figure 6 KEGG pathway enrichment analysis of differentially expressed genes. (A) The bar graph of 10 upregulated gene enrichment pathways. (B) The bar graph of a downregulated gene enrichment pathway.
Real-Time PCR and Protein Expression for Quantification of Selected mRNAs
Our study focused on the pathogenesis of the folliculo-sebaceous-apocrine unit development and adnexal tumorigenesis. After critical review of the literature, we selected six candidates to perform further validation. These candidates were comprised one upregulated gene (RIF1Citation22,Citation23) and five downregulated genes (CDKN2AIP,Citation24 MACC1,Citation25 DDX5,Citation26 BMPR2,Citation27 KDM3ACitation28) from the top 20 significantly differentially expressed genes. The genes were selected based on function implicating RNA binding, growth factor activity, nucleic acid binding, enzyme binding, and DNA-binding transcription factor activity. We also focused on genes regulating cell proliferation and tumorigenesis through the wnt/β-catenin pathway, a vital signal pathway in regulating folliculo-sebaceous development.
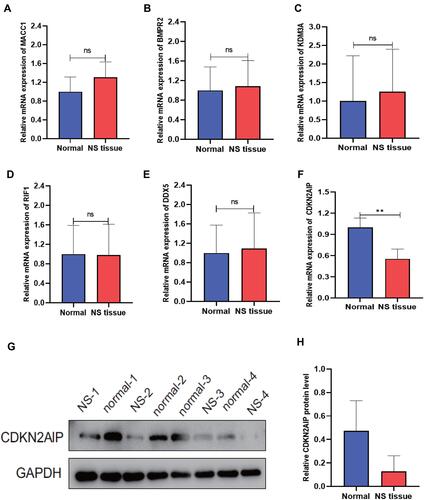
The candidate genes were validated in four different pairs of nevus sebaceous and normal tissues using real-time PCR. Only the RT-PCR result of the CDKN2AIP gene () was ultimately consistent with RNA sequencing result (). The protein expression of CDKN2AIP was further validated across e four tissue pairs by Western blot. The result demonstrated that the protein expression of CDKN2AIP was downregulated in nevus sebaceous tissue but normally expressed in healthy skin tissue, consistent with real-time PCR result ( and ).
Figure 7 Verification of selected differentially expressed transcripts in NS-paired adjacent tissue pairs. Real-time PCR was performed to validate the expression of the complementary gene targets identified by differentially expressed mRNAs in this study (**P < 0.01). Western blot was performed to further validate the protein expression of the gene product. (A) RT-PCR of MACC1 expression. (B) RT-PCR of BMPR2 expression. (C) RT-PCR of KDM3A expression. (D) RT-PCR of RIF1 expression. (E) RT-PCR of DDX5 expression. (F) RT-PCR of CDKN2AIP expression. (G) Protein expression result of CDKN2AIP in four-pair of NS and normal tissue samples. (H) Relative protein expression of CDKN2AIP.
Construction of the ceRNA Network
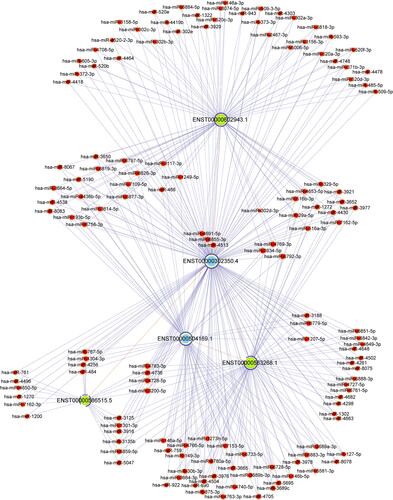
It is well-established that ceRNA (the most common are lncRNA and circRNA) can form complexes with miRNA through binding of the MREs to modulate gene silencing effected by miRNAs. On this premise, an interaction lncRNA-miRNA-mRNA ceRNA network can be constructed. The lncRNA-miRNA-mRNA ceRNA networks contained 3 lncRNA‐mRNA pairs, in which the mRNA corresponded to the CDKN2AIP gene and the lncRNAs were based on previously established, differentially expressed lncRNAs. Three downregulated lncRNAs including AL355607.2, RP5-1024G6.8 and AC007780.1 were predicted to consistently associate with CDKN2AIP expression. The lncRNA-miRNA-mRNA ceRNA networks also included 141 miRNA‐mRNA pairs, where the mRNA was the transcript encoded by the CDKN2AIP gene and the miRNAs were taken from CDKN2AIP-interacting predictions determined by the prediction software TargetScan & miRanda ().
Figure 8 The construction of a ceRNA network correlated with CDKN2AIP for NS-affected scalp tissues. Red nodes indicate microRNAs, light-blue nodes indicate CDKN2AIP-associated mRNA, and light-green nodes indicate lncRNAs; Edges with a T-shaped arrow represent directional relationships. Edges without arrows represent a ceRNA relationship.
Discussion
Nevus sebaceous is an abnormality of the epidermis, hair follicles, sebaceous glands and sweat glands. Mature hair follicles in the skin lesions are usually greatly reduced or even disappeared, and the dermal papilla-like structures with hypoplasia and benign proliferation of some hair follicle components are often seen.Citation29 The exact mechanism of nevus sebaceous (including the reduced hair follicle development) is not clear. Postzygotic mosaic mutations in the HRAS or KRAS genes are thought to cause nevus sebaceous and nevus sebaceous syndrome. RAS promotes cell growth through activation of multiple pathways, including the mitogen-activated protein kinase (MAPK) signal-transduction pathway.Citation30 Lee et al reported that immature and ectopic sebaceous glands in sebaceous nevi exhibit decreased secretion of hair induction factors like Wnt10b, β-catenin and Lef1, while increased secretion of factors such as IL-4, IL −6 and DKK-1 were associated with inhibited hair growth and increased hair follicle apoptosis.Citation31
The present study utilized RNA-seq and bioinformatics approaches (and subsequently qRT-PCR and Western blot) to uncover the role of mRNA and lncRNA in the pathogenesis of NS. Our results indicated that 72 upregulated mRNAs and 18 downregulated mRNAs together with 7 upregulated lncRNAs and 10 downregulated lncRNAs were differentially expressed between four paired NS and adjacent normal tissue samples.
In addition, KEGG pathway enrichment analysis revealed that 45 upregulated mRNA and 2 downregulated mRNA were associated with different KEGG Pathways. Among them, primary immunodeficiency, viral protein interaction with cytokine and cytokine receptor, and T cell receptor signaling pathway seemed to play important roles in NS. Primary immunodeficiencies (PIs) are a heterogeneous group of disorders which affect cellular and humoral immunity or non-specific host defense mechanisms mediated by complement proteins and cells like phagocytes and natural killer (NK) cells. These disorders of the immune system cause increased susceptibility to infection, autoimmune disease, and malignancy.Citation32–Citation34 Viral cytokines and cytokine receptor homologs, including other binding proteins, may activate or inhibit cytokine signaling and possibly affect different aspects of immunity.Citation35,Citation36 Raghu et alCitation37 have previously reported a case of NS-like cutaneous hyperplasia secondary to HPV infection and chronic epidermal irritation and inflammation. Activation of T lymphocytes is a key event for an efficient response of the immune system. T cell receptor signaling mainly recruits PI3K signaling. While impaired PI3K signaling can lead to immunodeficiency.Citation38,Citation39 Our results substantiate that primary immunodeficiencies, viral infection and cytokines might play important roles in the pathogenesis of NS, although more research must be performed to further investigate this.
We used RT-PCR to validate the results of RNA-seq with regard to the expression patterns of differentially expressed mRNA in four paired samples. Our verification efforts indicated that the mRNA expression of the CDKN2AIP gene was higher in normal tissues than in NS, in accordance with RNA-seq results. Western blot further verified this pattern.
CDKN2AIP (CARF, the collaborator of ARF) is a serine-rich protein, which was initially identified as a collaborator of ARF in activating p53.Citation40 It is located on human chromosome 4, at the 4q35 arm. Human CDKN2AIP protein is ubiquitously expressed, consisting of 580 amino acids (~61-kDa).Citation41 The protein encoded by the CDKN2AIP gene regulates the DNA damage response through many signal pathways involved in cell proliferation, apoptosis and aging. One of these pathways is the p53-HDM2-p21 (WAF1) pathway, which is essential for the DNA damage response.Citation42 CDKN2AIP has also been demonstrated as a positive regulator of the Wnt/β-catenin signaling pathway. It plays an important role in regulating the proliferation of spermatogonia and the epithelial-mesenchymal transition of breast and ovarian cancer.Citation24,Citation43,Citation44 The Wnt/β-catenin signaling pathway plays the most important role in the embryogenesis and development of hair follicles.Citation45,Citation46 Whether and how the low expression of CDKN2AIP may contribute to the pathogenesis of NS or the dysregulation of hair follicle growth requires further validation.
Dysregulation of lncRNAs has been reported to be associated with several human diseases, including autoimmune diseases, and tumors.Citation14,Citation19–Citation21 However, the relationship between lncRNA and NS has not been elucidated thus far. This study established a lncRNA and mRNA co-expression network based on abnormally expressed lncRNAs predicted to interact with CDKN2AIP mRNA (based on the TargetScan & miRanda prediction software). The results indicated that downregulated lncRNA AL355607.2, RP5-1024G6.8 and AC007780.1 were connected to CDKN2AIP expression by interaction with shared miRNA. However, further verification of lncRNA expression in these tissues is required in the future. Moreover, the exact molecular mechanism of lncRNA-mMiRNA-mRNA regulation required further exploration both in vitro and in vivo.
Some of the limitations of this study include a small sample size, low verification size of candidate differentially expressed mRNAs, and the fact that shared miRNA connected with mRNA and lncRNA were based on software predictions not verified by miRNA sequencing. We expect to further explore and verify the lncRNA-miRNA-mRNA network and investigate the precise mechanism of NS in a future study.
Conclusion
Both mRNA and lncRNA profiles were altered in nevus sebaceous scalp compared with normal scalp tissue. Additionally, we identified a differentially expressed targeted gene CDKN2AIP, which regulates the p53-HDM2-p21 (WAF1) pathway and is a positive regulator of wnt/β-catenin pathway. This gene and associated networks may play a role in the pathogenesis of nevus sebaceous, though a targeted mechanical assessment is further required.
Institutional Review Board Statement
The study was conducted according to the guidelines of the Declaration of Helsinki, and approved by the ethical committees of Institute of Dermatology, Chinese Academy of Medical Sciences. (2021-KY-033).
Data Sharing Statement
The data presented in this study are openly available in GEO repository. The series record of our date is GSE189848 and accession number is #22551124.
Informed Consent Statement
Informed consent was obtained from all subjects involved in the study.
Disclosure
The authors declare no conflicts of interest in this work.
Additional information
Funding
References
- Muñoz-Pérez MA, García-Hernandez MJ, Ríos JJ, Camacho F. Sebaceus naevi: a clinicopathologic study. J Eur Acad Dermatol Venereol. 2002;16:319–324. doi:10.1046/j.1468-3083.2002.00543.x
- Terenzi V, Indrizzi E, Buonaccorsi S, et al. Nevus sebaceus of Jadassohn. J Craniofac Surg. 2006;17(6):1234–1239. doi:10.1097/01.scs.0000221531.56529.cc
- Jones EW, Heyl T. Naevus sebaceus. A report of 140 cases with special regard to the development of secondary malignant tumours. Br J Dermatol. 1970;82:99–117. doi:10.1111/j.1365-2133.1970.tb15000.x
- Beer GM, Widder W, Cierpka K, Kompatscher P, Meyer VE. Malignant tumors associated with nevus sebaceous: therapeutic consequences. Aesthetic Plast Surg. 1999;23:224–227. doi:10.1007/s002669900272
- Kamyab-Hesari K, Seirafi H, Jahan S, et al. Nevus sebaceus: a clinicopathological study of 168 cases and review of the literature. Int J Dermatol. 2016;55:193–200. doi:10.1111/ijd.12845
- Sun BK, Saggini A, Sarin KY, et al. Mosaic activating RAS mutations in nevus sebaceus and nevus sebaceus syndrome. J Invest Dermatol. 2013;133:824–827. doi:10.1038/jid.2012.377
- Schubbert S, Shannon K, Bollag G. Hyperactive Ras in developmental disorders and cancer. Nat Rev Cancer. 2007;7:295–308. doi:10.1038/nrc2109
- Happle R. Nevus sebaceus is a mosaic RASopathy. J Invest Dermatol. 2013;133:597–600. doi:10.1038/jid.2012.447
- Clark MB, Amaral PP, Schlesinger FJ, et al. The reality of pervasive transcription. PLoS Biol. 2011;9:e1000625; discussion e1001102. doi:10.1371/journal.pbio.1000625
- Esteller M. Non-coding RNAs in human disease. Nat Rev Genet. 2011;12:861–874. doi:10.1038/nrg3074
- Qian X, Zhao J, Yeung PY, Zhang QC, Kwok CK. Revealing lncRNA structures and interactions by sequencing-based approaches. Trends Biochem Sci. 2019;44:33–52. doi:10.1016/j.tibs.2018.09.012
- Mercer TR, Dinger ME, Mattick JS. Long non-coding RNAs: insights into functions. Nat Rev Genet. 2009;10:155–159. doi:10.1038/nrg2521
- Rinn JL, Chang HY. Genome regulation by long noncoding RNAs. Annu Rev Biochem. 2012;81:145–166. doi:10.1146/annurev-biochem-051410-092902
- Sheng Y, Ma J, Zhao J, et al. Differential expression patterns of specific long noncoding RNAs and competing endogenous RNA network in alopecia areata. J Cell Biochem. 2019;120:10737–10747. doi:10.1002/jcb.28365
- Tay Y, Rinn J, Pandolfi PP. The multilayered complexity of ceRNA crosstalk and competition. Nature. 2014;505(7483):344–352. doi:10.1038/nature12986
- Uchida S, Dimmeler S. Long noncoding RNAs in cardiovascular diseases. Circ Res. 2015;116:737–750. doi:10.1161/circresaha.116.302521
- Schmitt AM, Chang HY. Long noncoding RNAs in cancer pathways. Cancer Cell. 2016;29:452–463. doi:10.1016/j.ccell.2016.03.010
- Fenoglio C, Ridolfi E, Galimberti D, Scarpini EJ. An emerging role for long non-coding RNA dysregulation in neurological disorders. Int J Mol Sci. 2013;14:20427–20442. doi:10.3390/ijms141020427
- Zhang F, Wu L, Qian J, et al. Identification of the long noncoding RNA NEAT1 as a novel inflammatory regulator acting through MAPK pathway in human lupus. J Autoimmun. 2016;75:96–104. doi:10.1016/j.jaut.2016.07.012
- Wang L-X, Wan C, Dong Z-B, et al. Integrative analysis of long noncoding RNA (lncRNA), microRNA (miRNA) and mRNA expression and construction of a competing endogenous RNA (ceRNA) network in metastatic melanoma. Med Sci Monit. 2019;25:2896–2907. doi:10.12659/MSM.913881
- Bao L, Yu A, Luo Y, et al. Genomewide differential expression profiling of long non-coding RNAs in androgenetic alopecia in a Chinese male population. J Eur Acad Dermatol Venereol. 2017;31(8):1360–1371. doi:10.1111/jdv.14278
- Mei Y, Liu Y-B, Cao S, Tian Z-W, Zhou H-H. RIF1 promotes tumor growth and cancer stem cell-like traits in NSCLC by protein phosphatase 1-mediated activation of Wnt/β-catenin signaling. Cell Death Dis. 2018;9(10):942. doi:10.1038/s41419-018-0972-4
- Mei Y, Liu YB, Cao S, Tian ZW, Zhou HH. Correction: RIF1 promotes tumor growth and cancer stem cell-like traits in NSCLC by protein phosphatase 1-mediated activation of Wnt/β-catenin signaling. Cell Death Dis. 2021;12:812. doi:10.1038/s41419-021-04097-6
- Kalra RS, Chaudhary A, Yoon A-R, et al. CARF enrichment promotes epithelial-mesenchymal transition via Wnt/β-catenin signaling: its clinical relevance and potential as a therapeutic target. Oncogenesis. 2018;7:39. doi:10.1038/s41389-018-0048-4
- Kim HJ, Moon SJ, Kim SH, Heo K, Kim JH. DBC1 regulates Wnt/β-catenin-mediated expression of MACC1, a key regulator of cancer progression, in colon cancer. Cell Death Dis. 2018;9:831. doi:10.1038/s41419-018-0899-9
- Zhang M, Weng W, Zhang Q, et al. The lncRNA NEAT1 activates Wnt/β-catenin signaling and promotes colorectal cancer progression via interacting with DDX5. J Hematol Oncol. 2018;11:113. doi:10.1186/s13045-018-0656-7
- Lewis RM, Keller JJ, Wan L, Stone JS. Bone morphogenetic protein 4 antagonizes hair cell regeneration in the avian auditory epithelium. Hear Res. 2018;364:1–11. doi:10.1016/j.heares.2018.04.008
- Wang W, Li R. MiR-216a-5p alleviates chronic constriction injury-induced neuropathic pain in rats by targeting KDM3A and inactivating Wnt/β-catenin signaling pathway. Neurosci Res. 2021;170:255–264. doi:10.1016/j.neures.2020.08.001
- Simi CM, Rajalakshmi T, Correa M. Clinicopathologic analysis of 21 cases of nevus sebaceus: a retrospective study. Indian J Dermatol Venereol Leprol. 2008;74:625–627. doi:10.4103/0378-6323.45107
- Groesser L, Herschberger E, Ruetten A, et al. Postzygotic HRAS and KRAS mutations cause nevus sebaceous and Schimmelpenning syndrome. Nat Genet. 2012;44:783–787. doi:10.1038/ng.2316
- Lee WJ, Cha HW, Lim HJ, Lee SJ, Kim DW. The effect of sebocytes cultured from nevus sebaceus on hair growth. Exp Dermatol. 2012;21:796–798. doi:10.1111/j.1600-0625.2012.01572.x
- Fischer A. Human primary immunodeficiency diseases: a perspective. Nat Immunol. 2004;5:23–30. doi:10.1038/ni1023
- Geha RS, Notarangelo LD, Casanova J-L, et al. Primary immunodeficiency diseases: an update from the international union of immunological societies primary immunodeficiency diseases classification committee. J Allergy Clin Immunol. 2007;120:776–794. doi:10.1016/j.jaci.2007.08.053
- Fischer A. Human primary immunodeficiency diseases. Immunity. 2007;27:835–845. doi:10.1016/j.immuni.2007.11.012
- Pontejo SM, Murphy PM. Chemokines encoded by herpesviruses. J Leukoc Biol. 2017;102:1199–1217. doi:10.1189/jlb.4RU0417-145RR
- de Munnik SM, Smit MJ, Leurs R, Vischer HF. Modulation of cellular signaling by herpesvirus-encoded G protein-coupled receptors. Front Pharmacol. 2015;6:40. doi:10.3389/fphar.2015.00040
- Raghu P, Tran TA, Rady P, Tyring S, Carlson JA. Ileostomy-associated chronic papillomatous dermatitis showing nevus sebaceous-like hyperplasia, HPV 16 infection, and lymphedema: a case report and literature review of ostomy-associated reactive epidermal hyperplasias. Am J Dermatopathol. 2012;34:e97–e102, doi:10.1097/DAD.0b013e3182562526
- Huang Y, Wange RL. T cell receptor signaling: beyond complex complexes. J Biol Chem. 2004;279:28827–28830. doi:10.1074/jbc.R400012200
- Okkenhaug K, Vanhaesebroeck B. PI3K in lymphocyte development, differentiation and activation. Nat Rev Immunol. 2003;3:317–330. doi:10.1038/nri1056
- Hasan MK, Yaguchi T, Sugihara T, et al. CARF is a novel protein that cooperates with mouse p19ARF (human p14ARF) in activating p53. J Biol Chem. 2002;277:37765–37770. doi:10.1074/jbc.M204177200
- Wadhwa R, Kalra RS, Kaul SC. CARF is a multi-module regulator of cell proliferation and a molecular bridge between cellular senescence and carcinogenesis. Mech Ageing Dev. 2017;166:64–68. doi:10.1016/j.mad.2017.07.008
- Kalra RS, Chaudhary A, Omar A, et al. Stress-induced changes in CARF expression determine cell fate to death, survival, or malignant transformation. Cell Stress Chaperones. 2020;25:481–494. doi:10.1007/s12192-020-01088-y
- Cui W, He X, Zhai X, et al. CARF promotes spermatogonial self-renewal and proliferation through Wnt signaling pathway. Cell Discovery. 2020;6(1). doi:10.1038/s41421-020-00212-7
- He X, Zhang W, Yan C, et al. Chemical biology reveals CARF as a positive regulator of canonical Wnt signaling by promoting TCF/β-catenin transcriptional activity. Cell Discovery. 2017;3(1). doi:10.1038/celldisc.2017.3
- Millar SE. Molecular mechanisms regulating hair follicle development. J Invest Dermatol. 2002;118:216–225. doi:10.1046/j.0022-202x.2001.01670.x
- Shimizu H, Morgan BA. Wnt signaling through the β-catenin pathway is sufficient to maintain, but not restore, anagen-phase characteristics of dermal papilla cells. J Invest Dermatol. 2004;122:239–245. doi:10.1046/j.0022-202X.2004.22224.x