
Abstract
Bile acid reflux in the esophagus plays an important role in the carcinogenesis of esophageal adenocarcinoma (EAC). The G-protein coupled bile acid receptor (TGR5) has been associated with the development of gastrointestinal cancer. However, little is known regarding the role of TGR5 in esophageal carcinoma and precancerous lesions. We analyzed genomic DNA from 116 EACs for copy number aberrations via Affymetrix SNP6.0 microarrays. The TGR5 gene locus was amplified in 12.7% (14/116) of the EACs. The TGR5 protein expression was also assessed using immunohistochemistry from tissue microarrays, including Barrett’s esophagus (BE), low-(LGD) and high-grade dysplasia (HGD), columnar cell metaplasia (CM), squamous epithelium (SE), EAC and squamous cell carcinoma. The TGR5 protein was highly expressed in 71% of EAC (75/106), 100% of HGD (11/11), 72% of LGD (13/18), 66% of BE (23/35), 84% of CM (52/62), and 36% of SE (30/83). The patients with high expression of TGR5 exhibited significantly worse overall survival compared to the patients with nonhigh expression. TGR5 high expression was significantly increased in the males compared to the females in all cases with an odds ratio of 1.9 times. The vitamin D receptor (VDR) was significantly correlated with TGR5 expression. Our findings indicated that TGR5 may play an important role in the development and prognosis of EAC through a bile acid ligand. Gender differences in TGR5 and VDR expression may explain why males have a higher incidence of EAC compared to females.
Introduction
The incidence of adenocarcinoma of the distal esophagus and gastroesophageal junction has substantially increased in Western populations in the previous decades.Citation1 In the absence of major improvements in treatment during these years, the number of deaths has also rapidly increased. Studies have suggested that esophageal adenocarcinoma (EAC) develops sequentially from gastroesophageal reflux (GERD), Barrett’s esophagus (BE), low-grade dysplasia (LGD), and high-grade dysplasia (HGD) to EAC. The progression from BE to EAC is attributed to a series of genetic and epigenetic events.Citation2 Bile acid, acid reflux, and inflammation from GERD play important roles in the carcinogenesis of adenocarcinoma.Citation3,Citation4
The G-protein coupled bile acid receptor Gpbar1 (TGR5) is a bile acid receptor and a member of the G-protein-coupled receptor (GPCR) family with seven transmembrane domains.Citation5 It has been described as a cell membrane GPCR and membrane-bile acid receptorCitation6 or TGR5.Citation7 TGR5 gene expression is widely distributed in the endocrine glands, adipocytes, muscles, immune organs, spinal cord, and the enteric nervous system.Citation5 It is important in bile acid-regulated lipid metabolism, energy homeostasis, and glucose metabolism.Citation8–Citation10 TGR5 has recently been reported to have potential links between bile acids (BAs) and cancers.Citation5,Citation8,Citation11,Citation12 TGR5 has been implicated in the activation of carcinogenic pathways in gastric carcinoma cell lines.Citation13 TGR5 was also highly expressed in gastric intestinal-type adenocarcinomas and has been associated with decreased patient survival in gastric adenocarcinomas.Citation8 In colorectal adenocarcinoma and pancreatic ductal adenocarcinoma, TGR5 was also involved in colorectal cancer or pancreatic ductal adenocarcinoma tumorigenesis by blocking the activation of epidermal growth factor receptor (EGFR), a mitogen-activated protein kinase.Citation14 In the liver, TGR5 has been demonstrated to be overexpressed in human cholangiocarcinomas and may promote tumor development.Citation15 Controversially, another report demonstrated that TGR5 was a suppressor of human liver carcinogenesis.Citation16
The involvement of BAs in the progression from BE to adenocarcinoma is well established.Citation17–Citation20 However, few studies have investigated the implication of bile acid receptors in the development of BE disease and adenocarcinoma.Citation11, Citation21,Citation22–Citation24 One in vitro study has indicated an association between TGR5 and the progression of esophageal carcinoma.Citation11 The authors demonstrated that bile acid induced TGR5 expression in EAC FLO cells and the BE BAR-T cell line. However, the distribution of TGR5 in EAC and precancerous lesions has not been investigated. In addition, the associations between TGR5 expression and patient prognosis and clinicopathologic features are unknown.
The vitamin D receptor (VDR) is a nuclear receptor that controls the most known role of 1,25 (OH)2D3, the hormonal form of vitamin D; it is also a bile acid receptor. Increasing evidence indicates that the VDR plays an essential role in innate immunity, inflammation, and cancer.Citation21–Citation23 VDR polymorphisms are reported to influence the development of various types of cancers, such as breast, liver, prostate, brain, and colon.Citation24,Citation26 In our recent study, VDR protein was highly expressed in EAC and precancerous lesions.Citation27 However, the relationship between the VDR and TGR5 expression in EAC and precancerous lesions is not clear.
Our study aimed to investigate TGR5 amplification and expression, including 1) TGR5 amplification via high resolution DNA microarray; 2) the distribution of TGR5 expression in EAC, LGD and HGD, BE, columnar cell metaplasia (CM), and squamous epithelium (SE), 3) the relationships between TGR5 high expression and clinicopathologic characteristics, including gender, age, differentiation, and tumor stage in EAC; and 4) the relationship between TGR5 expression and the VDR in EAC and precancerous lesions.
Materials and methods
Construction of tissue microarray
Tissue microarrays, which included 35 cases of BE, 62 cases of columnar CM, 83 cases of SE, 18 cases of LGD, 11 cases of HGD, and 106 cases of EAC, were constructed from the representative areas of formalin-fixed specimens collected between 1997 and 2005 at the Department of Pathology and Laboratory Medicine, University of Rochester Medical Center/Strong Memorial Hospital, Rochester, New York. Five-micron sections were cut from the tissue microarrays and were stained with H&E to confirm the presence of the expected tissue histology within each tissue core. Additional sections were cut for immunohistochemistry. In some cases, tissue cores in the tissue microarrays were dislodged from the slides during processing and were excluded from the study.
Patients for tissue microarrays
All 106 patients with EAC who provided samples for the tissue microarray construction were treated with esophagectomy at Strong Memorial Hospital/University of Rochester between 1997 and 2005. These patients included 96 males (90%) and 10 females (10%). The patient ages ranged from 34 to 85 years with a mean of 65 years. The follow-up period following esophagectomy ranged from 0.3 to 142 months with a mean of 39 months.
Patients for Affymetrix SNP 6.0 analysis
Tumors were obtained from 116 patients who had undergone esophagectomy at the University of Pittsburgh Medical Center, Pittsburgh, PA, USA, between 2002 and 2008 with a median follow-up of 26.8 months. The patient ages ranged from 43 to 88 years, and the cohort consisted of 95 males and 21 females. The final pathologic stages comprised stage I (28), stage II (31), stage III (49), and stage IV (7). All tumor specimens were evaluated by a pathologist and were determined to be >70% tumor cell representation. The patients who received neoadjuvant therapy (1) and suffered perioperative deaths (3) were not included in the survival analyses. All the tissues from patients were consented for tissue banking and research.
Affymetrix SNP 6.0 analysis
Genomic DNA was isolated using the QiaAmp DNA mini kit (Qiagen, Valencia, CA, USA); 600 ng was used for labeling and array hybridization at the SUNY Upstate Medical University microarray core facility (Syracuse, NY, USA) using kits and protocols provided by Affymetrix (Santa Clara, CA, USA). The array data quality was assessed using Affymetrix Genotyping Console 3.0, and all further data analyses were performed using Nexus 5.0 Copy Number Analysis software (Biodiscovery, Inc., El Segundo, CA, USA). The microarray data for this cohort have been submitted to the Gene Expression Omnibus (GSE36460) and are publically available at http://www.ncbi.nlm.nih.gov/geo/query/acc.cgi?acc=GSE36460.
Immunohistochemistry
Immunohistochemistry was conducted according to previously described methods with modifications.Citation28,Citation29 Tissue sections from the tissue microarray were deparaffinized, rehydrated through graded alcohols, and washed with phosphate buffered saline. Antigen retrieval for TGR5 and VDR was performed by heating sections in 10 mM citrate (pH 6.0) boiling buffer for 15 minutes. The tissues were permeabilized with 0.3% triton-X for 1 hour at room temperature. After the endogenous peroxidase activity was quenched and the nonspecific binding was blocked, the sections were incubated with mouse monoclonal anti-TGR5 and anti-VDR (Santa Cruz, CA, USA) at 4°C overnight. Biotinylated secondary antibody (Jackson Immuno Research Laboratories, Inc.) was incubated for 1 hour. After washing, the sections were incubated with avidin–biotin–peroxidase complex (Vector Laboratories) for 1 hour at room temperature. For color-reaction development, the slides were immersed in Vector NovaRed substrate (Vector Laboratories) for 2 minutes and counterstained with Flex Hematoxylin for 2 minutes. A negative control was performed by replacing anti-TGR5 and anti-VDR antibodies with normal serum.
Immunohistochemistry scoring
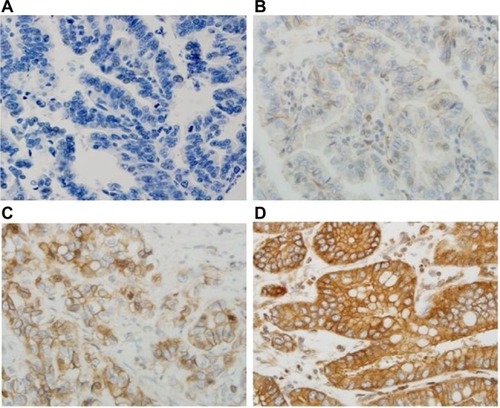
All sections were independently reviewed by Z.Z. and C.P., who were blinded to all clinical and pathologic information. Discordant cases were reviewed by both Z.Z. and C.P., and a final consensus was reached. For the TGR5 immunohistochemical stain, the percentage (0%–100%) of positive cells was determined. The intensity of TGR5 staining was graded as 0, 1+, 2+, or 3+ (); 0 was defined as no stain or weak stain in <10% of the cells; 1 was defined as a weak stain in ≥10% of the tumor cells; 2 was defined as a moderate stain in ≥10% of the cells; and 3 was defined as a strong stain in ≥10% of the cells. TGR5 high expression was defined as an intensity of 2 or 3 in ≥10% of the cells.
Figure 1 Immunohistochemical score of TGR5 in EAC.
Abbreviations: EAC, esophageal adenocarcinoma; TGR5, the G-protein coupled bile acid receptor.
Statistical analysis
Summary data are expressed as the means (standard deviation). All statistical tests are two-sided unless otherwise noted. P-values of <0.05 are considered statistically significant. A Kaplan–Meier survival estimator with a log-rank test was used to compare the patient survival rates between the TGR5 high-expression/amplification group and the TGR5 nonhigh expression/nonamplification group. To assess the associations between the clinicopathologic characteristics and TGR5 expression, Students t-tests, Pearson’s chi-square tests, and Fisher’s exact tests were utilized as appropriate. A univariate logistic model with the diagnostic group as the sole explanatory variable of TGR5 high-expression is fit, and contrast tests are used to compare the TGR5 positivity rates between the diagnostic groups: adenocarcinoma, high and LGD, BE, columnar CM and SE. Statistical analyses were performed using SAS version 9.3 (SAS Institute, Inc., Cary, NC, USA).
Ethics statement
This project was granted by Research Subjects Review Board at the University of Rochester with approval number RSRB40320 and granted by the Institutional Review Board at University of Pittsburgh with approval number UPCI#98-122. The tissue was collected by Dr Zhou at the University of Rochester and the tissue from the University of Pittsburgh Tissue Banking was collected by Drs Arjun Pennathur and James D Luketich at the University of Pittsburgh for EAC tissues. All patients consented for tissue banking and research.
Results
High expression of TGR5 in EAC and precancerous lesions
TGR5 was highly expressed in 71% (75/106) of EAC, 100% (11/11) of HGD, 72% (13/18) of LGD, 66% (23/35) of BE, 84% (52/62) of CM, and 36% (30/83) of SE ( and ). Statistically, the rate of TGR5 high expression was significantly increased in EAC, LGD, BE, and CM compared to SE (p<0.05; ). TGR5 in SE exhibited a moderate high expression (score 2+) in most cases (). In addition, the rate of TGR5 high expression in CM was increased compared to BE. However, if the small number of cases were considered with a Bonferroni correction, significant differences was only identified between EAC versus SE (p<0.0001) and CM versus SE (p<0.0001).
Figure 2 High expression of TGR5 in various histologic subtypes assessed via immunohistochemical studies.
Notes: (A) TGR5 positive cells (score 2+ in most cells) predominately distributed in the basal layer of normal esophageal squamous epithelium; (B) TGR5 strongly positive cells evenly distributed in the glands of columnar cell metaplasia; (C) TGR5 strongly positive cells evenly distributed in the glands of Barrett’s esophagus; (D) TGR5 strongly positive cells evenly distributed in low-grade dysplasia glands; (E) TGR5 strongly positive cells evenly distributed in high-grade dysplasia glands; (F) TGR5 strongly positive cells evenly distributed in EAC glands. Magnification (A) 200× and (B–F) 400×.
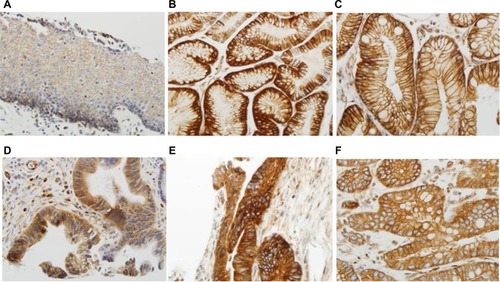
Table 1 Rates of TGR5 high expression in EAC and precancerous lesions
Table 2 Comparison of TGR5 high-expression rates between various esophageal lesions
Survival rate in EAC cases
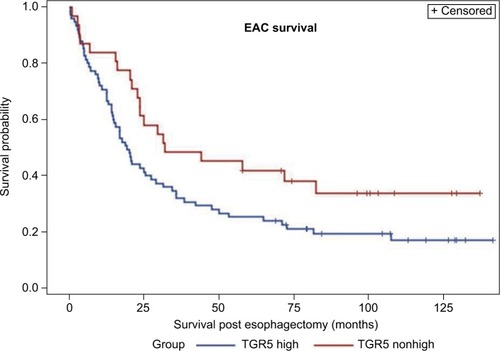
A Kaplan–Meier analysis was used to calculate the survival curves of the TGR5 high and nonhigh expression groups. A log-rank test was used to compare the effect of TGR5 expression on the survival rates of the patients with EAC. The median survival time in the TGR5 high-expression group, determined by immunostain, was 19 months with a mean survival time of 38 months (censoring rate=19%). The TGR5 nonhigh expression group had a median survival time of 32 months with a mean survival time of 46 months (censoring rate=35%). The log-rank test indicated that the survival time for the TGR5 high-expression group was statistically shorter compared to the TGR5 nonhigh expression group (p=0.0432, ). Note that the mean survival times of the TGR5 high-expression groups were underestimated because of censoring within the data and missing data.
Figure 3 Association between TGR5 high expression and overall survival of esophageal adenocarcinoma patients.
Abbreviations: EAC, esophageal adenocarcinoma; TGR5, the G-protein coupled bile acid receptor.
Association of high TGR5 expression with clinicopathologic characteristics of EAC
The TGR5 high expression and the clinicopathologic features in EAC were analyzed. In contrast to the significant association between the survival time and TGR5 high expression previously described (p=0.0432), none of the other clinicopathologic characteristics, including age, gender, TNM staging, or differentiation, were significantly associated with TGR5 high expression ().
Table 3 Examination of the relationship between TGR5 high expression and clinicopathologic characteristics in esophageal adenocarcinoma
Association between high TGR5 expression and high VDR expression
We further compared the expression level of TGR5 with VDR data from our recently published study.Citation27 The correlation between TGR5 high expression and VDR high expression was analyzed across all cases and within each diagnostic group. There was a significantly positive correlation between VDR and TGR5 high expression across all groups (p=0.0001) using a Pearson correlation coefficient test ().
Table 4 Overall association between high TGR5 expression and high VDR expression in esophageal adenocarcinoma and precancerous lesions
Association between TGR5 high expression and gender
Males have a high incidence of EAC.Citation1 We analyzed the association of TGR5 high expression and gender in all groups including EAC and precancerous lesions. We identified a significant overall association between TGR5 high expression and gender (p=0.0464). The odds of TGR5 high expression were 1.9 times higher in the males (67%) compared to the females (51%). However, there was no significant association between TGR5 high expression and precancerous lesions in EAC group only ().
Defining the TGR5 amplicon in EAC with high density microarrays
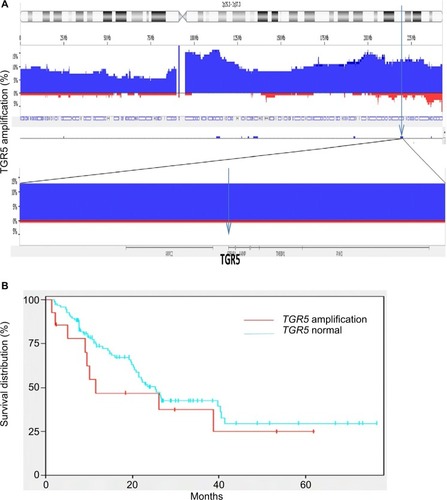
Using high density copy number microarrays, we analyzed 116 EAC specimens and identified TRG 5 amplification in 12.7% (14/116) of the cases. TGR5 lies in a 1.7 Mb minimal amplicon at 2q35, which contains 85 genes (). In this cohort, no significant association was identified between TGR5 amplification and overall survival (p=0.33) () or disease-free survival (p=0.45).
Figure 4 TGR5 amplification and overall survival.
Notes: (A) Frequency histogram indicates amplification of the TGR5 locus at chromosome 2q35 in 116 esophageal adenocarcinoma samples, using high density copy number DNA microarrays. This locus is amplified in 14/116 (12.7%) cases in this patient cohort. (B) There is no significant association between TGR5 amplification and overall survival (p=0.33).
Discussion
In our study, for the first time, we used immunohistochemistry to demonstrate the expression of the TGR5 protein in EAC and precancerous lesions. We demonstrated that TGR5 expression was significantly increased in glandular lesions compared to SE. The patients with TGR5 high expression exhibited significantly worse overall survival compared to the patients with nonhigh expression. TGR5 expression was significantly increased in males compared to females in all cases with an odds ratio of 1.9 times.
The TGR5 receptor is the first known GPCR specific for BAs. Maruyam et alCitation6 cloned the TGR5 receptor in human embryonic kidney HEK 293 cells and characterized the variations in the binding affinities of individual BAs to TGR5. These findings were confirmed by studies in Chinese Hamster ovarian cells by Kawamata et al.Citation7 Recently, Hong et al demonstrated that the TGR5 messenger RNA (mRNA) and protein were expressed in an EAC cell line and BE cell line as well as human esophageal tissues.Citation11 TGR5 mRNA and protein levels are significantly higher in EAC tissues than in normal esophageal mucosa or BE.Citation11 Our immunohistochemical findings further confirmed that TGR5 was highly expressed in EAC and precancerous lesions based on tissue microarrays. However, the distribution of TGR5 high expression in our study is different from that in previous study. We found that it is not significantly different from CM, BE, LGD, HGD, and EAC. In gastric adenocarcinoma, TGR5 overexpression was found in 52% of the intestinal subtype and 25% of the diffuse subtype of gastric adenocarcinoma.Citation8 TGR5 was also expressed in normal mucosa (39.8%) and intestinal meta-plasia (46.3%). Our findings indicated that the rate of TGR5 high expression was substantially increased in EAC (71%) compared to gastric adenocarcinoma. A similar increased expression of TGR5 was identified in precancerous lesions, such as columnar CM (84%) and BE (66%).
BAs play an important role in the carcinogenesis of EAC.Citation3,Citation4,Citation17,Citation30 Multiple bile acid receptors, such as farnesoid X receptor (FXR), VDR, and TGR5, have been detected in EAC and precancerous lesions.Citation31–Citation34 Gottardi et al demonstrated that the FXR protein was only expressed in nuclei in EAC and BE.Citation31 We demonstrated that VDR expression was significantly increased in 95% of BE and 100% of LGD compared to 79% of EAC.Citation27 In the current study, we reported that TGR5 exhibited high expression in CM, BE, LGD, and HGD and lower expression in EAC. The distribution pattern of TGR5 expression is significantly associated with VDR in EAC and precancerous lesions. This finding implies that bile acid may be involved in the early stage of carcinogenesis through both VDR and TGR5 receptors. However, Hong et al found that TGR5 mRNA and protein levels were significantly higher in EAC tissues than in normal esophageal mucosa or BE,Citation11 but TGR5 expression is not significantly different from intestinal metaplasia and gastric adenocarcinoma reported in the same group.Citation8 The effect of TGR5 needs to be further studied in different cancers.
The mechanism of TGR5 on carcinogenesis actually remains controversial. In the liver, TGR5 activation substantially inhibited the proliferation and migration of human liver cancer cells. TGR5 activation antagonizes the signal transducer and activator of transcription 3 (STAT3) pathway by suppressing STAT3 phosphorylation, which suggests that TGR5 is a novel liver tumor suppressor.Citation16 In the stomach, activation of TGR5 antagonizes gastric cancer proliferation and migration in part by inhibiting STAT3 signalingCitation35 and inhibits the gastric inflammation in part by antagonizing NK-kappaB signaling.Citation36 In the stomach and esophagus, Cao et al demonstrated that BAs significantly increased cell proliferation, including NOX5-S expression, H2O2 production, and thymidine incorporation, in EAC, BE cell lines, and gastric adenocarcinoma.Citation8,Citation11 Knockdown of TGR5 substantially inhibited the bile acid-induced increase in the cell proliferation effect. The overexpression of TGR5 significantly enhanced the bile acid effects in EAC cell lines through the Gqα protein and in gastric adenocarcinoma through both Gqα protein and G αi-3.Citation8,Citation11 In addition, unconjugated BAs induce cAMP response element-binding protein and AP-1-dependent COX-2 expression in BE and EAC through respiratory oxygen species (ROS)-mediated activation of phosphoinositide 3-kinase/AKT and extracellular signal-regulated kinases (ERK)1/2Citation37 and deoxycholate acid (DCA) also induce caudal-related homeobox transcription factor 2 (CDX2) upregulation through inhibiting the Notch signaling pathway and transactivation of EGFR.Citation19,Citation30 Using AGS human gastric adenocarcinoma cells, DCA-induced EGFR-ERK1/2 activation was blocked by siRNA silencing of TGR5.Citation13 In colorectal cancer and pancreatic ductal adenocarcinoma cell lines, RNA interference-mediated silencing of TGR5 inhibited DCA-induced EGFR, mitogen-activated protein kinase (MARK), and STAT3 signaling, blunted cyclin D1 expression and cell-cycle progression,Citation14 which support that TGR5 may play an important role in gastrointestinal carcinogenesis. In the current study, we demonstrated the high expression of TGR5 in the EAC and precancerous lesions and the association of TGR5 with decreased survival, which further supports that the TGR5 high expression may be related to carcinogenesis and worse prognosis of EAC.
In gastric adenocarcinoma, moderate and strong expression of TGR5 was identified in both intestinal and diffuse gastric adenocarcinoma, which was associated with a worse prognosis.Citation8 In our study, the high expression of TGR5 is associated with a worse prognosis in EAC (median survival: 38 vs 46 months, respectively). However, the amplification of the TGR5 gene in EAC was not associated with overall survival or disease-free survival. We found that the percentage of the TGR5 DNA amplification (12%) in EAC is significantly lower compared to TGR5 high expression (71%). It implies that TGR5 high expression does not directly depend on the amplification of TGR5 DNA. The detailed mechanism requires further investigation. The amplification of the VDR gene in EAC detected by high resolution DNA microarray demonstrated the association with a worse prognosis; however, the high expression of VDR protein did not exhibit the association. These findings imply that the effect of bile acid is not only associated with the early carcinogenesis of EAC but also the prognosis of EAC through various receptors. However, we did not find that TGR5 high expression was associated with clinicopathologic features such as the differentiation or staging, which is similar to the previous study in gastric adenocarcinoma. There was no statistically significant difference in tumor stage, chemotherapy, and radiation therapy between negative to weak and moderate to strong TGR5 staining gastric adenocarcinoma.Citation8 The mechanism of the association of TGR5 with the worse prognosis is complicated and unclear. In EAC, the bile acid taurodeoxycholic acid-induced increase in cell proliferation may depend on activation of the TGR5 receptor through Gqα protein and NOX5-S.Citation11 In addition, activation of TGR5 by bile acid also is related with DCA-induced EGFR, MARK, and STAT3 signaling and cell-cycle progression in gastric, colorectal, and pancreatic ductal adenocarcinoma.Citation13,Citation14 These signal pathways through activation of TGR5 may play a role in worse prognosis. Further studies with animal models and clinical trials for TGR5 agonists and antagonists may help to understand the mechanism of TGR5 association of worse prognosis.
The major risks of EAC are associated with age, Caucasian, obesity, and male patients. The ratio of males to females is approximately 7 to 1.Citation1 Based on our data, TGR5 exhibited a significantly different gender distribution between males and females (67% vs 51%, respectively). The expression of VDR also exhibited a significantly different distribution between males and females (82% vs 50%, respectively, in EAC and 92% vs 57%, respectively, in columnar CM). The distribution of bile acid receptors was significantly increased in male patients with EAC and precancerous lesions. These findings may explain, in part, why males have a higher incidence of EAC compared to females. The underlying mechanism of bile acid receptors and gender differences requires further investigation.
In conclusion, we report that the high expression of TGR5 is associated with worse survival in EAC. Gender differences in TGR5 and VDR expression may explain, in part, why males have a high incidence of EAC compared to females. Our findings indicate that bile acid receptors may play an important role in the early development and prognosis of EAC.
Acknowledgments
This project is supported by a private donation from Mr Matt Bell. This research also was supported by R01 grant (R01-DK100342, PI-J. Que) and NYSTEM (C029555, PI-J. Que).
We would like to thank Dr Jorge Yao for construction of the tissue microarray, Qi Yang and Loralee A. McMahon at the University of Rochester for immunohistochemistry, and Drs Arjun Pennathur and James D Luketich at the University of Pittsburgh for EAC tissues.
Disclosure
The authors report no conflicts of interest in this work.
References
- CorleyDAKuboALevinTRRace, ethnicity, sex and temporal differences in Barrett’s oesophagus diagnosis: a large community-based study, 1994–2006Gut200958218218818978173
- ChenXYangCSEsophageal adenocarcinoma: a review and perspectives on the mechanism of carcinogenesis and chemopreventionCarcinogenesis20012281119112911470739
- FangYChenXBajpaiMCellular origins and molecular mechanisms of Barrett’s esophagus and esophageal adenocarcinomaAnn N Y Acad Sci2013130018719924117642
- QuanteMBhagatGAbramsJABile acid and inflammation activate gastric cardia stem cells in a mouse model of Barrett-like metaplasiaCancer Cell2012211365122264787
- DubocHTacheYHofmannAFThe bile acid TGR5 membrane receptor: from basic research to clinical applicationDig Liver Dis201446430231224411485
- MaruyamaTMiyamotoYNakamuraTIdentification of membrane-type receptor for bile acids (M-BAR)Biochem Biophys Res Commun2002298571471912419312
- KawamataYFujiiRHosoyaMA G protein-coupled receptor responsive to bile acidsJ Biol Chem2003278119435944012524422
- CaoWTianWHongJExpression of bile acid receptor TGR5 in gastric adenocarcinomaAm J Physiol Gastrointest Liver Physiol20133044G322G32723238937
- HoutenSMWatanabeMAuwerxJEndocrine functions of bile acidsEMBO J20062571419142516541101
- KatsumaSHirasawaATsujimotoGBile acids promote glucagon-like peptide-1 secretion through TGR5 in a murine enteroendocrine cell line STC-1Biochem Biophys Res Commun2005329138639015721318
- HongJBeharJWandsJRole of a novel bile acid receptor TGR5 in the development of oesophageal adenocarcinomaGut201059217018019926617
- PeanNDoignonITordjmannTBile acids and liver carcinogenesis: TGR5 as a novel piece in the puzzle?Clin Res Hepatol Gastroenterol201337322622923434440
- YasudaHHirataSInoueKMashimaHOhnishiHYoshibaMInvolvement of membrane-type bile acid receptor M-BAR/TGR5 in bile acid-induced activation of epidermal growth factor receptor and mitogen-activated protein kinases in gastric carcinoma cellsBiochem Biophys Rese Commun20073541154159
- NagathihalliNSBeesettyYLeeWWashingtonMKChenXLockhartACMerchantNBNovel mechanistic insights into ectodomain shedding of EGFR ligands amphiregulin and TGF-alpha: impact on gastrointestinal cancers driven by secondary bile acidsCancer Res20147472062207224520077
- KeitelVHaussingerDTGR5 in cholangiocytesCurr Opin Gastroenterol201329329930423429467
- ChenWDYuDFormanBMHuangWWangYDDeficiency of G-protein-coupled bile acid receptor Gpbar1 (TGR5) enhances chemically induced liver carcinogenesisHepatology201357265666622911633
- MatsuzakiJSuzukiHTsugawaHBile acids increase levels of microRNAs 221 and 222, leading to degradation of CDX2 during esophageal carcinogenesisGastroenterology201314561300131123933602
- TamagawaYIshimuraNUnoGNotch signaling pathway and Cdx2 expression in the development of Barrett’s esophagusLab Invest201292689690922449796
- MorrowDJAvissarNEToiaLPathogenesis of Barrett’s esophagus: bile acids inhibit the Notch signaling pathway with induction of CDX2 gene expression in human esophageal cellsSurgery20091464714721 discussion 721–71219789031
- HuYJonesCGellersenOWilliamsVAWatsonTJPetersJHPathogenesis of Barrett esophagus: deoxycholic acid up-regulates goblet-specific gene MUC2 in concert with CDX2 in human esophageal cellsArch Surg20071426540544 discussion 544–54517576890
- CampbellFCXuHEl-TananiMCrowePBinghamVThe yin and yang of vitamin D receptor (VDR) signaling in neoplastic progression: operational networks and tissue-specific growth controlBiochem Pharmacol20107911919737544
- LuRWuSXiaYSunJThe vitamin D receptor, inflammatory bowel diseases, and colon cancerCurr Colorectal Cancer Rep201281576523814529
- SunJMustafiRCerdaSChumsangsriAXiaYRLiYCBissonnetteMLithocholic acid down-regulation of NF-kappaB activity through vitamin D receptor in colonic cancer cellsJ Steroid Biochem Mol Biol20081111–2374018515093
- RaimondiSJohanssonHMaisonneuvePGandiniSReview and meta-analysis on vitamin D receptor polymorphisms and cancer riskCarcinogenesis20093071170118019403841
- BouillonRCarmelietGVerlindenLVitamin D and human health: lessons from vitamin D receptor null miceEndocr Rev200829672677618694980
- MishraDKWuYSarkissyanMVitamin D receptor gene polymorphisms and prognosis of breast cancer among African-American and Hispanic womenPLoS One201383e5796723554871
- ZhouZXiaYBandlaSVitamin D receptor is highly expressed in precancerous lesions and esophageal adenocarcinoma with significant sex differenceHum Pathol20144581744175124951052
- HuYBandlaSGodfreyTEHER2 amplification, overexpression and score criteria in esophageal adenocarcinomaMod Pathol201124789990721460800
- ZhouZBandlaSYeJCyclin E involved in early stage carcinogenesis of esophageal adenocarcinoma by SNP DNA microarray and immunohistochemical studiesBMC Gastroenterol2014147824742107
- AvissarNEToiaLHuYBile acid alone, or in combination with acid, induces CDX2 expression through activation of the epidermal growth factor receptor (EGFR)J Gastrointest Surg200913221222218854960
- De GottardiADumonceauJMBruttinFExpression of the bile acid receptor FXR in Barrett’s esophagus and enhancement of apoptosis by guggulsterone in vitroMol Cancer200654817054793
- TrowbridgeRMittalSKSharmaPHunterWJAgrawalDKVitamin D receptor expression in the mucosal tissue at the gastroesophageal junctionExp Mol Pathol201293224624922664272
- TrowbridgeRSharmaPHunterWJAgrawalDKVitamin D receptor expression and neoadjuvant therapy in esophageal adenocarcinomaExp Mol Pathol201293114715322546272
- ChangCKMulhollandHGCantwellMMVitamin d receptor gene variants and esophageal adenocarcinoma risk: a population-based case-control studyJ Gastrointest Cancer201243351251721948293
- GuoCSuJLiZThe G-protein-coupled bile acid receptor Gpbar1 (TGR5) suppresses gastric cancer cell proliferation and migration through antagonizing STAT3 signaling pathwayOncotarget 2720156333440234413
- GuoCQiHYuYThe G-Protein-Coupled Bile Acid Receptor Gpbar1 (TGR5) inhibits gastric inflammation through antagonizing NF-kappaB signaling pathwayFront Pharmacol2015628726696888
- SongSGuhaSLiuKButtarNSBresalierRSCOX-2 induction by unconjugated bile acids involves reactive oxygen species-mediated signalling pathways in Barrett’s oesophagus and oesophageal adenocarcinomaGut200756111512152117604323