
Abstract
Background
Economic models in oncology are commonly based on the three-state partitioned survival model (PSM) distinguishing between progression-free and progressive states. However, the heterogeneity of responses observed in immuno-oncology (I-O) suggests that new approaches may be appropriate to reflect disease dynamics meaningfully.
Materials and methods
This study explored the impact of incorporating immune-specific health states into economic models of I-O therapy. Two variants of the PSM and a Markov model were populated with data from one clinical trial in metastatic melanoma patients. Short-term modeled outcomes were benchmarked to the clinical trial data and a lifetime model horizon provided estimates of life years and quality adjusted life years (QALYs).
Results
The PSM-based models produced short-term outcomes closely matching the trial outcomes. Adding health states generated increased QALYs while providing a more granular representation of outcomes for decision making. The Markov model gave the greatest level of detail on outcomes but gave short-term results which diverged from those of the trial (overstating year 1 progression-free survival by around 60%).
Conclusion
Increased sophistication in the representation of disease dynamics in economic models is desirable when attempting to model treatment response in I-O. However, the assumptions underlying different model structures and the availability of data for health state mapping may be important limiting factors.
Introduction
Reliable evidence to determine long-term cost-effectiveness is frequently absent when a marketing authorization application is submitted for a new therapy. This evidence is central to recent debates around the affordability of cancer drugs and the sustainability of high drug prices.Citation1–Citation3 The tension between effective management of health care budgets and the provision of optimal care to cancer patients highlights the need for decision makers to assess the true value of cancer treatments using the most rigorous and robust methods.Citation4,Citation5
Together with the challenge of affordability, an accurate depiction of the true impact of anticancer medication is critical particularly given escalating price benchmarks accompanied by, in some cases, only moderate improvements in overall survival (OS). Comparing treatment effect can be complex; this is particularly true given the numerous surrogate endpoints often used in clinical trials which may, or may not, be predictive of a true OS benefit.Citation1,Citation6 In the evaluation of new treatments, a balance between disease progression and treatment-related toxicities is key to determining clinically meaningful outcomes for patients. To improve cross product and disease area comparisons, the European Society for Medical Oncology (ESMO) has developed a reproducible tool which can be applied to new anticancer treatments to assess the magnitude of clinical benefit (ESMO Magnitude of Clinical Benefit Scale). The tool grades each trial within the curative and non-curative disease settings using a two-part rule. Firstly, the lower limit of the 95% confidence interval (CI) on the hazard ratio is compared with specified thresholds. Secondly, the observed absolute difference in treatment outcomes is compared with the minimum absolute gain considered as beneficial.Citation7,Citation8
As more innovative treatments are introduced, the value defined by conventional economic modeling requires renewed scrutiny given the complex technical and data availability issues raised by new therapies.Citation4,Citation5
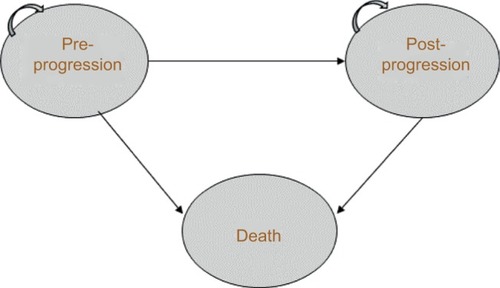
An established approach to economic modeling in oncology is the three-state partitioned survival model (PSM), which classifies patients into the states of “progression free,” “progressive disease” (PD), and “death” (). The approach mirrors the data on progression-free survival (PFS) and OS commonly reported in clinical trials, and is designed to evaluate therapies in which the course of disease is relatively easily captured by a limited number of health states.Citation9
Figure 1 Three-state partitioned survival model. Patients can remain in pre- or post-progression, move from pre- to post-progression, or move from either state to death.
Particular challenges for economic modeling in oncology have been raised by the emergence of checkpoint inhibitors, which are a new therapeutic class of immuno-oncology (I-O) compounds,Citation10 an evolving treatment modality that harnesses the immune system to fight cancer. Fundamental differences in pharmacodynamic and anticancer properties of I-O compared with conventional therapies call for innovative ways to model patient response to treatment. In particular, treatment response with I-O drugs differs from progression with conventional therapies, an example being “pseudo-progression” (ie, tumor growth from treatment effect rather than true disease progression) that has been described with immune checkpoint inhibitors in melanoma. One may inaccurately assess these unique I-O-associated clinical response parameters which, in turn, may prevent robust cost-effectiveness analysis and value-based assessmentsCitation11,Citation12 – as demonstrated in the survival extrapolation of I-O with traditional data fits versus more flexible approaches.Citation13
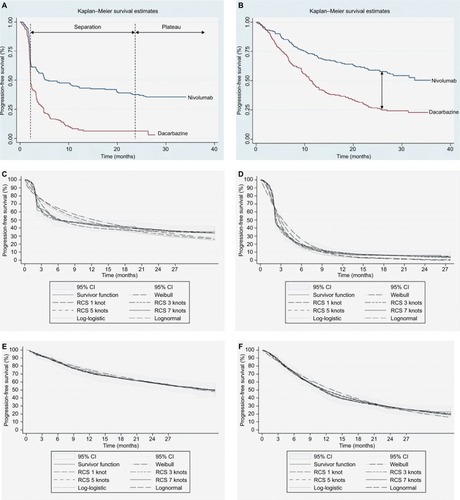
While conventional therapies demonstrate early benefit but often with limited durability (),Citation11,Citation14 some patients treated with I-O therapy tend to exhibit delayed response, followed by subsequent long-term survival.Citation15 This typically occurs in about 20%–30% of patients across several tumor sites.Citation16–Citation18 Meanwhile, the potential for quality of life to be maintained in melanoma has been demonstrated with nivolumab.Citation19
Figure 2 Kaplan–Meier plots for (A) PFS for both treatment arms, (B) OS for both treatment arms, and data fits of conventional and flexible methods applied to (C) PFS for nivolumab, (D) PFS for dacarbazine, (E) OS for nivolumab, and (F) OS for dacarbazine.
Related to the differences in clinical response is the duration of therapy needed to sustain such responses. Traditionally, a treat to progression approach has been used, but there is emerging evidence that a shorter duration of therapy can still be associated with sustained clinical response. In addition, clinical trials in some indications have revealed treatment beyond progression (where treatment is still tolerated) as response continues to be seen irrespective of the standard definition of progression. This highlights the need for models to capture time on treatment as well as disease progression.
Improvements on existing model frameworks used in cost-effectiveness analyses could include increasing the number of health states in the traditional model, partitioning of data based on patient prognosis or clinical outcomes, or patient-level approaches that account for greater heterogeneity. Such methods have the potential to demonstrate significant improvements over a three-state model without addressing the fundamental differences that the patterns of survival associated with I-O imply. To deal with some of these issues, other economic measures that may be applicable have been proposed (eg, assessing survival benefit over a daily scale).Citation1,Citation3,Citation6,Citation8 A key issue is whether economic models can be designed to provide more clinically relevant representations of disease compared with the traditional approaches, which continue to be applied in published cost-effectiveness analyses.Citation20–Citation22 A related challenge is the extent to which the data typically collected as part of clinical trials are reflective of disease dynamics in I-O therapies, potentially constraining analysts’ ability to develop more sophisticated approaches. By testing innovative economic model approaches, the aim of this paper is to explore new ways of aligning model structure with clinical observations in I-O therapy, and to contribute to the development of economic evaluation guidelines in this area.
Materials and methods
This paper presents an empirical application of a range of economic model structures varying in terms of numbers and definitions of health states. These health states are tested against a set of I-O data drawn from one randomized trial in malignant melanoma (CheckMate 066).Citation12 The models are used to investigate how increasingly refined structures, compared with the reference point of the traditional three-state PSM, can help provide more detailed evidence of value for decision making. While the approach is intended to be generalizable to other disease areas and therapeutic options, the picture of immune responses to different single and combination therapies is still emerging. To reinforce good practice and consistency in economic model development, an initial generalized approach to the selection of model frameworks is presented and the implications for economic evaluation in I-O are drawn out. The empirical application is then reported using a stepwise approach to develop models of increasing complexity within that framework.
Selection of model framework
A number of general methodological guidelines exist on decision analytic modeling for the economic evaluation of health care interventions.Citation23–Citation25 Those which focus specifically on the structural design of modelsCitation26–Citation28 identify patient heterogeneity as a critical factor in model selection. Where heterogeneity between groups is an issue, as is the case with I-O therapy, a well-known method of overcoming the homogeneity assumptions inherent in economic models is to increase the number of states in the model,Citation26 with the health states designed to represent the natural history of disease, treatments, and their effects.Citation27 In the context of I-O therapy, limiting the model to pre-progression (PP) and post-progression (PsP) health states is unlikely to capture adequately the evolution of the disease and patients’ response to treatment. This has been recognized to some extent in health technology assessments by the National Institute for Health and Care Excellence (NICE), with some submissions for example, extending the basic model by introducing an on treatment/off treatment distinction,Citation29,Citation30 while others have retained the three-state model.Citation31,Citation32
To make allowances for different patient attributes, health states can be subdivided depending on the impact on health outcomes of various risk factors, which might include stages of the natural history of disease.Citation27 Disadvantages of increasing the number of health states are an increase in model complexity,Citation28 with the potential for reduced transparency and ease of validation, and, in some cases, the placing of excessive demands on data availability. On the other hand, caution has been expressed about simplifying a complex model as it equates to adjusting one or more model parameters,Citation26 a step which may not be justified. In some situations, the identification of a clinically relevant set of health states which capture the important aspects of the condition under investigation may necessitate a reconsideration of the fundamental model structure. If a large number of health states are relevant (and can be supported by data), it is recommended that there is a need to consider individual level modeling.Citation27
More complex approaches, in terms of the number and types of health states defined, reduce the number of observations to populate each health state and stretch the ability of the available data to match the theoretical concepts embodied in those health states. This may not be excessively restrictive if data can be sourced from general scientific literature. In the current context of implementing different model structures on the basis of data from a single clinical trial, there is a trade-off between the number of health states and the number of patient observations with which to populate each individual health state. A potential conflict explored in this study (and one which could usefully be addressed in early economic modeling to inform clinical development programs) is between increased sophistication in the portrayal of the condition being investigated and an effective reduction in the available data, with a consequent increase in uncertainty in the model.
Empirical application
Patient population and trial data
The analysis of treatment outcomes was based on patient-level data from the CheckMate 066 (the clinical trial was funded by Bristol-Myers Squibb; ClinicalTrials.gov number NCT01721772) randomized Phase III clinical trial of nivolumab (N=210, 3 mg/kg every 2 weeks) versus dacarbazine (N=208, 1000 mg/m2 body surface every 3 weeks) in treatment-naïve melanoma patients without the BRAF mutation (average age of 65 years). The primary endpoint of OS was reported alongside secondary endpoints of PFS and objective response rate (ORR). Patients were treated until progression, with tumor response assessed according to Response Evaluation Criteria in Solid Tumors (RECIST; version 1.1),Citation33 except those who had a clinical benefit without experiencing substantial adverse events. Following discontinuation, patients (30.0% in the nivolumab group and 54.8% in the dacarbazine group) received systemic treatment, most commonly ipilimumab, another checkpoint inhibitor that was approved by the US Food and Drug Administration for melanoma in 2011.Citation17
At the first database lock (August 2014, 16.7 months), median OS had not been reached in the nivolumab group (ORR of 40%) and was 10.8 months (ORR of 13.9%) in the dacarbazine group. Median PFS and percentage survival at 1 year were significantly longer with nivolumab (5.1 months and 72.9%) compared with dacarbazine (2.2 months and 42.1%).Citation14,Citation34 At the second database lock (July 2015), OS at 2 years showed a significantly higher proportion surviving in the nivolumab group (57.7%) compared with dacarbazine (26.7%).Citation35
Trial data available for the current analysis included up to 34 months’ follow-up (nivolumab) and 27 months (dacarbazine) for PFS and 36 months for OS (both arms). Crossover to ipilimumab was allowed from July 2014. Baseline characteristics, ORR, and disease status were available and extracted to supplement the model structures. Clinical outcomes generated by the model frameworks presented in this paper were compared with the trial results reported in .
Table 1 Overview of the results from the CheckMate 066 trial and comparisons to clinical outcomes from the conventional PSM, extended versions of the conventional PSM, and the immune-response-based Markov modelTable Footnote*
Model structures
To understand the value of different model frameworks, a stepwise approach to model development (based on clinical input) was taken. The health states considered were chosen to be clinically relevant to patients treated with I-O drugs. For the purposes of capturing the expected benefits of I-O therapy in delayed progression and prolonged survival (in the relevant subset of patients), and to provide a framework that is flexible enough to address some of the limitations of the conventional approach and I-O data (including immature OS and PFS data), three additional frameworks were developed. Two of the three were extensions of the conventional PSM approach, incorporating a broader set of health states but yielding the same estimates of survival. The other was a state-transition model designed to capture the impact of I-O therapy in terms of immune response ().
Figure 3 Model schematics for the (A) conventional three-state PSM, (B) conventional three-state PSM with the additional health state to differentiate levels of response, (C) conventional three-state PSM with additional health states to differentiate levels of response and progression types, (D) immune-response-based Markov model.
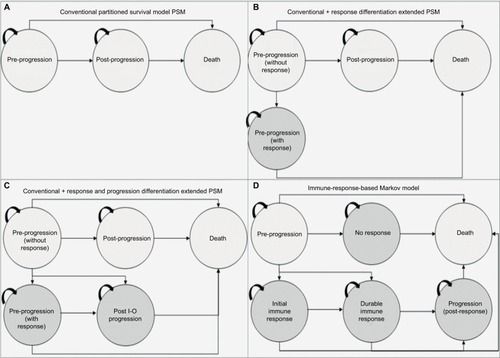
As the additional health states in the three new models were intended to capture a specific immune response, the non I-O group was restricted to the progression-free, PD, and death health states and was excluded from entering the I-O states.
Model 1: PSM
The conventional PSM typically used in the evaluation of oncology treatments involves partitioning survival into states of interest, and was used as a baseline against which to compare the other model frameworks. Model 1 is the standard three-state model including states of PP, PsP, and death (). Trial outcomes for PFS and OS were each modeled directly using survival analysis to allow for extrapolation. This approach did not consider PsP survival directly; instead, time to progression was derived from the difference between the areas under the PFS and OS curves.
Model 2: PSM extension with response differentiation
With the conventional approach, the PP state includes treatment responders and nonresponders. To provide a more definitive representation of response to treatment (and its duration), PP was segregated into PP without response (PP1) and PP with response (PP2). PP1 defined patients with stable disease (SD) without clinical change in lesions, and PP2 referred to patients with partial response (PR) or complete response (CR) to treatment, consistent with the trial definitions. The other health state definitions for PsP and death remain unchanged from the conventional approach (model 1). Based on the best overall response (BOR), the proportion responding (PR/CR) was applied to PFS to define the responder category. Similarly, the proportion with SD based on BOR was applied to PFS to define nonresponders. BOR is a standard approach to classify response categories although others are possible (eg, landmark models).
Trial outcomes for PFS (SD, CR, and PR) and OS were each modeled directly using survival analysis to allow for extrapolation. In line with model 1 (the conventional approach), progression was represented by the difference in the areas under the PFS (SD, and CR/PR) and OS curves.
Model 3: PSM extension with response and progression differentiation
The second extension (model 3, ) classified post-progression into normal (PsP1) and I-O progression (PsP2) states, to reflect the differences in the underlying mechanism of action of treatment, which has given rise to the immune-related response criteriaCitation36 alongside the RECISTCitation33 classification system. The health state definitions for PP were consistent with model 2.
In line with models 1 and 2, progression was represented by the difference in the areas under the PFS (SD, CR, and PR) and OS curves. A further adjustment was made to address the difference in progression types by applying the proportions who respond using BOR as an indicator (PsP1) and who are nonresponders (PsP2) to overall progression as reported in the CheckMate 066 trial.
Model 4: immune-response Markov state-transition model
A state-transition Markov model was developed to model the I-O mechanism in a more exhaustive way than was possible with the basic PSM and variants thereof. Patients in the model were allowed to move between states based on a set of transition probabilities estimated from reported clinical trial events defined by BOR. The model included states of treated/PP, no immune response (NIR), initial immune response (IIR), durable immune response (DIR), post-response progression (PRP), and death. The model can be applied to I-O treated patients and patients treated with other forms of therapy (chemotherapy or targeted therapy) although patients not treated with I-O are theoretically restricted to PP and NIR states. PP, NIR, IIR, DIR, and PRP states were mapped to available clinical trial data according to the following definitions:
Treated/PP: nonfatal event of SD without progression
NIR: nonfatal event of PD
IIR: nonfatal event of PR without progression
DIR: nonfatal event of CR without progression
PRP: SD in responders with PR/CR
Transitions from 1) treated/PP to NIR, IIR, DIR, and death, 2) IIR to DIR, PRP, and death, 3) DIR to PRP and death, and 4) PRP to death were possible. Due to data limitations, all transition probabilities presented in were based on the average patient experience over the period for which trial observations were available, rather than being estimated separately at each time point. Extrapolation beyond the period of data observation assumed time-invariant transition probabilities adjusted for the background mortality consistent with OS applied to PSM.
Table 2 Monthly transition probabilities adjusted for the immune-based Markov model (model 4) based on event rates from patient-level trial data from the CheckMate 066 trial for nivolumab and dacarbazine treatment arms
Model estimation and outcomes
All models were constructed in Microsoft Excel 2010, using a lifetime time horizon, monthly cycles, and a half-cycle correction. Life years (LYs) and quality adjusted life years (QALYs) were discounted at 3.5% to represent the UK perspective for all model approaches. Clinical outcomes of OS, PFS, ORR, and BOR were compared with trial outcomes. Costs were excluded from the current analysis to focus on the way in which the different approaches modeled treatment outcomes.
Survival estimation
The process of fitting parametric survival curves to patient-level data was based on the NICE Decision Support Unit guidance,Citation37 with some modifications to handle I-O data.
For internal validation (prior to interpolation) and in the absence of long-term I-O data, the trial data were randomly partitioned into two datasets: 1) the “training” dataset used to assess the initial data fits and 2) the “validation” dataset used to confirm consistency for optimal model selection. Heterogeneity between the two datasets was assessed by comparing patient characteristics, Kaplan–Meier (K-M) plots, and primary outcomes with the core dataset, and applying a 95% CI to assess variance.Citation13
Traditional parametric methods for Weibull, exponential, lognormal, and log-logistic functions, as well as flexible parametric survival models using restricted cubic splines (RCS) with 1–7 knots were fitted to both OS and PFS in each treatment arm. To assess the goodness of fit to the observed data for each predicted survival model, visual inspection against the K-M plots (for the overall fit and at the distinct I-O phases with emphasis on the plateau) was undertaken (). In addition, the Akaike information criterion and Bayesian information criterion statistical tests were compared among models and hazard plots examined.Citation13
For OS, the lognormal function was used while, for PFS, the RCS with two knots was found to provide the best fit. The limited number of knots provides mitigation against overfitting the data although other approaches to validation, such as bootstrap resampling and k-fold cross-validation, are available. In the absence of long-term external data for nivolumab, ipilimumab studies with 5- and 10-year survival data were used to validate extrapolated survival estimates.Citation12,Citation15,Citation17 On the extrapolated portions of the OS and PFS curves, it was found that modeled PFS and OS crossed (which cannot happen in reality). As modeled PFS was based on a more mature dataset and better validated, it was taken to represent OS and PFS following the overlap of the two curves, an assumption considered to be conservative. Alternative methods of applying an adjustment factor to OS relative to PFS to capture additional survival benefit and surrogacy assumptions over OS in previous submissions have been explored in the evidence submitted to NICECitation38 but rejected by the Evidence Review Group. In general, when extrapolating OS based on PFS, the background mortality should be accounted for to avoid potential overestimation.
Utility estimates
Health-related quality of life estimates suitable for calculating QALYs (utilities) were drawn from the literature and assigned to model health states, without differentiation between patients on and off treatment or between treatment arms. In the absence of literature for specific health states defined in the models presented, proxies based on closely related health states were used to estimate QALYs ().
Table 3 Utilities per health state per modelCitation39,Citation40 and economic outcomes per model for 10 years, 20 years, and lifetime horizons
For model 1, the utility values for the PP (0.802) and PsP (0.728) health states were drawn from a UK prospective study of individual patient-level data (the CheckMate 066 trial), adjusted for significant predictors of utility over time (baseline utility, progression status, time to death or end of follow-up, and treatment arm).Citation39
For models 2–4, the analysis used estimates from a universal set of utility values relating to clinical response states for PR, SD, and PD in advanced melanoma for the general UK population, to capture the variation in utilities with treatment response.Citation40 The utility estimate for SD (0.770)Citation40 was allocated to the PP1 health states in models 2 and 3, and to the treated/PP health state in model 4. The PR (0.850)Citation40 utility value was assigned to the PP2 state in models 2 and 3, and to the IIR and DIR states in model 4 (in the absence of information to differentiate between the level of response). The PD (0.590)Citation40 estimate was assigned to PsP in model 2, to PsP1 and PsP2 states in model 3, and to NIR and PRP states in model 4 (in the absence of information to differentiate between progression in responders and nonresponders).
Compliance with ethical standards
The protocol and amendments for the CheckMate 066 trial were reviewed by the institutional review board at each trial site. The study’s Independent Data Monitoring Committee (DMC) was established to provide oversight on the safety and efficacy considerations and provide advice to the sponsor regarding actions the DMC deemed necessary for the continuing protection of subjects enrolled in the study. The trial was conducted in accordance with the provisions of the Declaration of Helsinki and with Good Clinical Practice guidelines as defined by the International Conference on Harmonisation. All the patients provided written informed consent before enrollment.
Results
Trial endpoints: PSM-based approaches
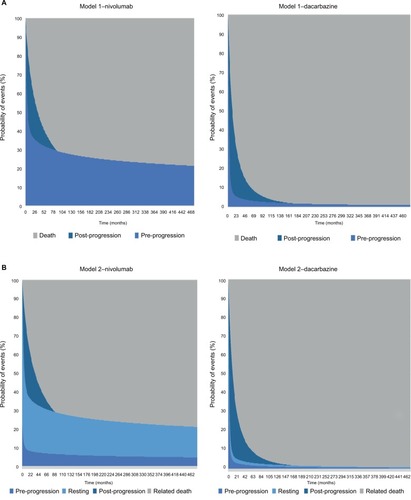
The modeling of OS benefit using the PSM frameworks over the trial period generated survival estimates of 73.3% (nivolumab) and 50.3% (dacarbazine) in year 1, and 58.7% (nivolumab) and 29.1% (dacarbazine) in year 2. These compared with reported trial outcomes in year 1 of 72.9% and 42.1% for nivolumab and dacarbazine, respectively, and in year 2 of 57.7% and 26.7%. The PSM-based approaches gave PFS of 40.5% (nivolumab) and 7.9% (dacarbazine) in year 1, with corresponding estimates of 35.8% and 5.2% in year 2 (). These findings were comparable with the trial reported PFS outcomes of 44.3% for nivolumab and 7.7% for dacarbazine in year 1, and 39.2% for nivolumab in year 2. provides model outcomes to illustrate event probabilities over a lifetime time horizon. With the partitioned approaches, nivolumab demonstrated long-term survival benefits in a subset of patients (21.2%), in contrast to dacarbazine, where survival beyond 15 years was minimal (≤1.0%).
Figure 4 Survival model plots for the (A) conventional PSM, (B) conventional PSM with additional health state to differentiate levels of response, (C) conventional PSM with additional health states to differentiate levels of response and progression types, (D) immune-response-based Markov model.
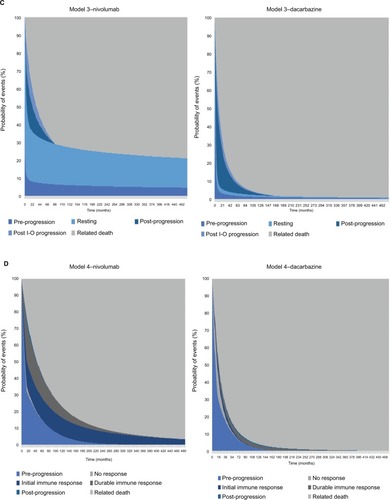
Trial endpoints: immune-response Markov model
The Markov model’s OS estimates for nivolumab of 73.8% and 58.6% and for dacarbazine of 51.5% and 28.8% at years 1 and 2 were similar to those of the PSM-based approaches. In common with the PSM-based approaches, modeled OS in each year for nivolumab and in year 2 for dacarbazine were comparable with the trial results (). In contrast, modeled PFS estimates diverged markedly from those of the PSM approaches and from the trial results. While PFS estimates given by the model were 69.8% and 55.5% in years 1 and 2 for nivolumab and 48.6% in year 1 for dacarbazine, the corresponding trial results showed PFS of 44.3% and 39.2% for nivolumab, and 7.7% for dacarbazine. Whereas PFS estimates generated by models 1–3 were within 10% of the trial estimates, model 4 overestimated year 1 and year 2 PFS for nivolumab by nearly 60% and over 40%, respectively.
LYs and QALYs: PSM-based approaches
LY and QALY outcomes for each model are presented in . All the PSM-based approaches generated increasing increments in overall benefit (for nivolumab) with longer time horizons. The PSM frameworks (models 1–3) each gave the same overall LY outcomes, ranging from a gain in favor of nivolumab of 2.12 LYs over a 10-year time horizon to a gain of 5.13 LYs over a lifetime. Overall life expectancy for those receiving nivolumab was estimated at 3.9 years and 7.1 years for 10-year and lifetime time horizons, respectively. The incremental LY gains for nivolumab versus dacarbazine under the PSM approaches were reflective of the long-term survival of ~20% with nivolumab ().
In model 1, the incremental QALY gain with nivolumab ranged from 1.68 QALYs to 3.99 QALYs as the time horizon increased from 10 years to the lifetime. Corresponding ranges for model 2 were 2.02–4.44 QALYs and, for model 3, 2.02–4.43 QALYs, thus doubling the gain by moving from the 10-year to a lifetime time horizon. Across the three models, overall quality adjusted life expectancy ranged between 2.83 and 3.01 QALYs under a 10-year time horizon and from 5.3 to 5.68 QALYs at a lifetime time horizon.
LYs and QALYs: immune-response Markov model
At a 10-year time horizon, estimates of life expectancy with nivolumab (3.78 LYs) under model 4 were comparable with the corresponding estimate in models 1–3 (3.9 LYs). However, at subsequent time horizons, life expectancy was estimated to be lower than in models 1–3, markedly so over the lifetime (5.35 vs 7.1 LYs). As life expectancy with dacarbazine did not differ substantially from that estimated in models 1–3 at any time horizon, the incremental LY gains with nivolumab were lower in model 4 (eg, 3.54 LYs over the lifetime compared with 5.13 LYs in models 1–3). QALYs showed a similar pattern, the incremental gain being estimated at 3.03 QALYs over the lifetime for nivolumab compared with 4.43 QALYs under model 3. Model 4 therefore provided a more conservative estimate of the long-term effect of nivolumab in comparison with models 1–3.
Assumptions and limitations
Interpretation of these findings should take into consideration a number of assumptions relied on by the Markov model which were not applicable to the PSM approaches. In particular, the transition probabilities on which the model is based were calculated as averages over the period for which BOR observations were available and assumed to be constant over this time period. Under the simpler formulation of health states, estimates of time progression-free or with progression are drawn directly from the OS and PFS curves. As a result, the Markov model may offer a set of health states which give a clinically more appropriate description of disease evolution and treatment response but, in this case, failed to represent the trajectory of progression as accurately as the simpler models.
The analysis reported here could be refined with longer follow-up and a closer alignment between the trial data and the concepts which the definitions of immune response are intended to capture. Alternatively, a multistate model with event history analysis which takes account of the timing of events could be used to estimate transition probabilities on a continuous time basis. This would overcome the limitations of the Markov model’s discrete time approach but presupposes access to patient-level data which may not always be available. In addition, the approach can be problematic given limited patient numbers.
Contrasting results from applying a PSM, Markov model, and a continuous time multistate model to a common dataset have been reported by Williams et al.Citation41 Their example is not, however, directly comparable as some of the differences in QALY results reported here will be a result of the wider range of utilities facilitated by the more granular descriptions of health states. It should also be noted that the pros and cons of different approaches may depend on the precise therapeutic regimen investigated; further research is needed to explore the applicability of the models presented here in drugs with different mechanisms of action.
Discussion
Selection of health states
The three-state PSM distinguishing between PP, PsP, and death mirrors the outcomes of PFS and OS reported in clinical trials and is frequently used as the basis for estimating the cost-effectiveness of cancer therapies. Many researchers are contending with the issue of converting these data (to assess additional benefit of a new therapy to the existing therapies in place) into information which can be considered alongside the costs of new therapies (particularly drug prices) in health care decision making. Decisions about the use of new drugs are frequently based on the cost per QALY, although other ways of combining survival and quality of life have been proposed in the context of cancer treatment.Citation1,Citation6 In the case of I-O therapy, all models have limitations given patient outcomes characterized by atypical patterns of survival and disease dynamics.
Observed patterns of response in I-O suggest that the conventional three-state model is likely to provide an unduly restrictive representation of the disease course and therapeutic mechanism of action. The issue has been addressed in this study by adding new health states intended to capture I-O treatment response, initially with two extensions to the basic PSM. The first introduces a new PP state while the second supplements this with a new PsP state. The final model defines a set of health states specifically targeted at concepts of immune response, with movements between states allowed according to a set of transition probabilities (Markov model).
Health states that are specific to I-O, namely immune response and post-immune progression, have clinical validity, and allow modeling of the “resting” patient with the potential for sustained benefit (improved survival and quality of life) and reduced costs. I-O-specific states can be accessed only through a transformative health state (immune response) which is not applicable to conventional therapies. An illustration is the evidence that treatment-free survival is possible with some patients who have received ipilimumab.Citation15 The emergence of new evidence regarding responses to I-O therapy will influence the desired number and categorization of health states in the theoretical model to maintain clinical validity. In practice, there may be a trade-off between the value of the additional data they provide, and the degree of uncertainty introduced by data limitations or the assumptions required to support them.
The current study illustrates not only the gains but also the potential pitfalls in introducing increased sophistication into the model’s health states. The two extensions of the PSM provide a better overview of QALYs for those responding and not responding to treatment (giving increased QALY gains with I-O therapy due to the time spent in PP with response) and produced estimates of OS and PFS comparable with the basic PSM and trial data.
The developments represented by the Markov model are that it explicitly captures patients moving from one state to another in a way which is not possible with the PSM-based approaches, and that it provides further granularity of health state descriptions. However, the finding that its estimates of 1- and 2-year PFS were not in line with the PSM-based models and with the underlying data has revealed the limitations of the standard Markov approach which, in this case, was outperformed by the simpler variants of the PSM. Nevertheless, the Markov modeling approach has the potential to be more informative in the future with improvements in the understanding of I-O and in data sources. The implications for additional data collection and appropriate reporting if the potential for such models is to be fully exploited are worthy of further exploration.
Selection of model structure
Drawing on the literature citedCitation26 and discussion at a workshop of the Scientific Steering Committee (Vienna, October 2016) which oversaw this work, a high-level algorithm to guide the selection of the appropriate cost-effectiveness model structure when evaluating I-O therapy has been proposed ().
Figure 5 Proposed model selection algorithm.
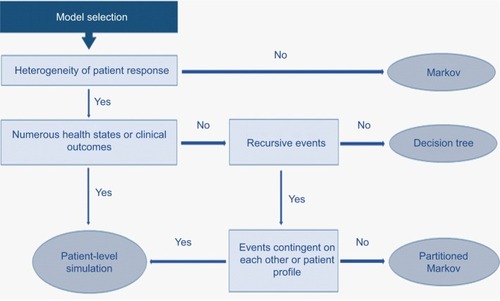
The selection of model structure should be based on a number of drivers of structural fit with the data. Population heterogeneity and predictability/heterogeneity of response to treatment (a factor particularly emphasized in ) need to be considered alongside complexity of the health states encountered (which will be greater in I-O than with other forms of therapy) and the contingency of events on prior patient events or treatment pathways.
In practice, the selection of the most appropriate model structure to estimate the cost-effectiveness of I-O therapies will tend, in most cases, to center on a choice between a patient-level simulation and a partitioned Markov in terms of goodness of structural fit. The level of complexity of the model will need to be informed not only by theoretical models of disease processes, in the same way that the choice of survival function when modeling PFS and OS will ideally benefit from a clinical understanding of disease processes, but also by empirical testing. As has previously been observed, the choice between a simpler and more complex model should depend on a consideration of both; a decision to opt for a simplified model “is an empirical issue, the answer to which is unknown without undertaking a more complex model.”Citation26
Ultimately, a model should be judged on its ability to mirror accurately the short- and long-term clinical outcomes observed in trials and real-world data sources. Choice of model should be informed both by the amount and value of the information generated to support appropriate decision making and by the level of uncertainty within the outputs. Sensitivity to assumptions can help to identify data that need to be collected (rather than influencing choice of structure).
Conclusion
Extending the standard three-state model to a four- or five-state structure (separating PP or both PP and PsP into two) can better reflect patients’ experience of disease during I-O therapy and potentially provide more transparent accounting of the source of treatment benefits. Going further to add specific I-O-relevant health states (independent of the underlying model framework) can be a useful tool to establish better coherence with clinical data and may deliver important information from a decision maker perspective. However, the compromises involved in implementing these states through a conventional Markov approach may result in a loss of accuracy in modeling the underlying data. Further research is needed to understand the appropriate number of disease states, underlying patient quality of life and resource use associated with those states, their validity across other tumor types, and the usefulness of other modeling approaches.
Acknowledgments
Bristol-Myers Squibb (BMS) funded the research. The authors are grateful to Clive Pritchard of Wickenstones Ltd for writing and editorial assistance.
Disclosure
A Juarez-Garcia, M Lees, AA Tahami Monfared, D Tyas, and Y Yuan were employed by BMS. N Begum, EJ Gibson, and I Koblbauer were employed by Wickenstones Ltd, who were funded by BMS to undertake the research. G Dranitsaris, D Liew, and P McEwan have received consultancy fees and have been reimbursed for travel expenses to attend advisory board meetings related to this research. The authors report no other conflicts of interest related to this work.
References
- GozzoLNavarriaADragoVLinking the price of cancer drug treatments to their clinical valueClin Drug Investig2016367579589
- PfisterDGThe just price of cancer drugs and the growing cost of cancer care: oncologists need to be part of the solutionJ Clin Oncol201331283487348924002517
- Experts in Chronic Myeloid LeukemiaThe price of drugs for chronic myeloid leukemia (CML) is a reflection of the unsustainable prices of cancer drugs: from the perspective of a large group of CML expertsBlood2013121224439444223620577
- MillerJDFoleyKARussellMWCurrent challenges in health economic modeling of cancer therapies: a research inquiryAm Health Drug Benefits20147315316224991399
- JönssonBWilkingNCancer vaccines and immunotherapeutics: challenges for pricing, reimbursement and market accessHum Vaccin Immunother2012891360136322922209
- GuirgisHMProposal for a novel methodology to screen and score cost versus survival for anticancer drugs in metastatic disease: could cost weigh in evaluation?J Oncol Pract20128422423023180986
- EllisLMBernsteinDSVoestEEAmerican Society of Clinical Oncology perspective: raising the bar for clinical trials by defining clinically meaningful outcomesJ Clin Oncol201432121277128024638016
- ChernyNISullivanRDafniUA standardised, generic, validated approach to stratify the magnitude of clinical benefit that can be anticipated from anti-cancer therapies: the European Society for Medical Oncology Magnitude of Clinical Benefit Scale (ESMO-MCBS)Ann Oncol20152681547157326026162
- MinacoriRBonastreJLuezaBMarguetSLevyPHow to model survival in cost-effectiveness analysis? Differences between Markov and partitioned survival analysis modelsValue Health2015187A704
- de LorenzoFWaitSKaracaBBrittenCvan den BulckeMEuropean Expert Group on Immuno-OncologyGreater patient access to immuno-oncology therapies—what can policymakers do?Ecancermedicalscience2015914
- ChenT-TStatistical issues and challenges in immuno-oncologyJ Immunother Cancer201311824829754
- SchadendorfDHodiFSRobertCPooled analysis of long-term survival data from phase II and phase III trials of ipilimumab in unresectable or metastatic melanomaJ Clin Oncol201533171889189425667295
- GibsonEKoblbauerIBegumNModelling the survival outcomes of immuno-oncology drugs in economic evaluations: a systematic approach to data analysis and extrapolationPharmacoeconomics201735121257127028866758
- RobertCLongGVBradyBNivolumab in previously untreated melanoma without BRAF mutationN Engl J Med2015372432033025399552
- McDermottDLebbéCHodiFSDurable benefit and the potential for long-term survival with immunotherapy in advanced melanomaCancer Treat Rev20144091056106425060490
- BorghaeiHPaz-AresLHornLNivolumab versus docetaxel in advanced nonsquamous non-small-cell lung cancerN Engl J Med2015373171627163926412456
- LarkinJChiarion-SileniVGonzalezRCombined nivolumab and ipilimumab or monotherapy in untreated melanomaN Engl J Med20153731233426027431
- McDermottDFDrakeCGSznolMSurvival, durable response, and long-term safety in patients with previously treated advanced renal cell carcinoma receiving nivolumabJ Clin Oncol201533182013202025800770
- LongGVAtkinsonVAsciertoPAEffect of nivolumab on health-related quality of life in patients with treatment-naïve advanced melanoma: results from the phase III CheckMate 066 studyAnn Oncol201627101940194627405322
- BohenskyMPasupathiKGorelikAKimHHarrisonJPLiewDA cost effectiveness analysis of nivolumab compared to ipilimumab for the treatment of Braf wild-type advanced melanoma in AustraliaValue Health2015187A340
- JensenISZacherleEBlanchetteCMZhangJYinWEvaluating cost benefits of combination therapies for advanced melanomaDrugs Context2016521229727540409
- WangJChmielowskiBPellissierJXuRStevinsonKLiuFXCost-effectiveness of pembrolizumab versus ipilimumab in ipilimumab-naive patients with advanced melanoma in the United StatesJ Manag Care Spec Pharm201723218419428125365
- SculpherMFenwickEClaxtonKAssessing quality in decision analytic cost-effectiveness models. A suggested framework and example of applicationPharmacoeconomics200017546147710977388
- PhilipsZGinnellyLSculpherMReview of guidelines for good practice in decision-analytic modelling in health technology assessmentHealth Technol Assess2004836iiiivixxi1158
- CaroJJBriggsAHSiebertUKuntzKMModeling good research practices – overview: a report of the ISPOR-SMDM Modeling Good Research Practices Task Force-1Value Health201215679680322999128
- BartonPBryanSRobinsonSModelling in the economic evaluation of health care: selecting the appropriate approachJ Health Serv Res Policy20049211011815099459
- BrennanAChickSEDaviesRA taxonomy of model structures for economic evaluation of health technologiesHealth Econ200615121295131016941543
- BriggsADMWolstenholmeJBlakelyTScarboroughPChoosing an epidemiological model structure for the economic evaluation of noncommunicable disease public health interventionsPopul Health Metr2016141727152092
- NICESingle technology appraisal. Pomalidomide with dexamethasone for treating relapsed and refractory multiple myeloma after at least two regimens including lenalidomide and bortezomib (review of TA338) [ID985]; committee papersLondonNational Institute for Health and Care Excellence2016 Available from: https://www.nice.org.uk/guidance/ta427/documents/committee-papersAccessed September 24, 2017
- NICE Single technology appraisalNivolumab for treated or metastatic renal cell carcinomaLondonNational Institute for Health and Care Excellence2016 Available from: https://www.nice.org.uk/guidance/ta417/documents/committee-papers-2Accessed September 24, 2017
- NICE Committee papers single technology appraisalNivolumab for treating advanced (unresectable or metastatic) melanoma [ID845]LondonNational Institute for Health and Care Excellence2016 Available from: https://www.nice.org.uk/guidance/ta417/documents/committee-papers-4Accessed January 08, 2017
- NICE Single technology appraisalPembrolizumab for treatment of PD-L1 positive non-small cell lung cancer after platinum-based chemotherapy [ID840]LondonNational Institute for Health and Care Excellence2016 Available from: https://www.nice.org.uk/guidance/ta428/documents/committee-papersAccessed January 08, 2017
- EisenhauerEATherassePBogaertsJNew response evaluation criteria in solid tumours: revised RECIST guideline (version 1.1)Eur J Cancer200945222824719097774
- AsmarRYangJCarvajalRDClinical utility of nivolumab in the treatment of advanced melanomaTher Clin Risk Manag20161231332527013881
- BMSOpdivo (nivolumab): advanced melanoma (unresectable or metastatic)2016 Available from: http://www.opdivo.co.uk/hcp/advanced-melanoma/first-line/progression-free-survivalAccessed November 23, 2016
- WolchokJDHoosAO’DaySGuidelines for the evaluation of immune therapy activity in solid tumors: immune-related response criteriaClin Cancer Res200915237412742019934295
- LatimerNNICE DSU Technical Support Document 14 Survival analysis for economic evaluations alongside clinical trials – extrapolation with patient-level dataSheffieldUniversity of Sheffield2013 Available from: http://nicedsu.org.uk/wp-content/uploads/2016/03/NICE-DSU-TSD-Survival-analysis.updated-March-2013.v2.pdfAccessed March 23, 2017
- NICEEverolimus with exemestane for treating advanced breast cancer after endocrine therapy (Cancer Drugs Fund reconsideration of TA295)LondonNational Institute for Health and Care Excellence2016 Available from: https://www.nice.org.uk/guidance/ta421/resources/everolimus-with-exemestane-for-treating-advanced-breast-cancer-after-endocrine-therapy-pdf-82604658653125Accessed December 08, 2017
- PalyVColbyCGilloteauIExuzidesABriggsAPredictors of utility over time among patients with treatment-naïve advanced melanoma from the phase 3 CheckMate 066 trialValue Health2015187A474
- BeusterienKMSzaboSMKotapatiSSocietal preference values for advanced melanoma health states in the United Kingdom and AustraliaBr J Cancer2009101338738919603025
- WilliamsCLewseyJDMackayDFBriggsAHEstimation of survival probabilities for use in cost-effectiveness analyses: a comparison of a multi-state modeling survival analysis approach with partitioned survival and Markov decision-analytic modelingMed Decis Making201737442743927698003