
Abstract
Purpose
To estimate the cost-effectiveness of Nefecon in addition to the best supportive care (BSC) vs BSC in a hypothetical cohort of commercially insured adult patients with primary immunoglobulin A nephropathy (IgAN) from a United States (US) societal perspective.
Methods
A lifetime horizon, semi-Markov model was developed that consisted of nine health states: chronic kidney disease (CKD) stage 1, 2, 3a, 3b, 4, end-stage renal disease (ESRD) with dialysis, ESRD without dialysis, post-kidney transplant, and death. Health state occupancy was estimated from individual patient-level data from the Phase 3 randomized controlled trial NefIgArd Part A (NCT03643965). Additional scenarios evaluated the impact of varying the time horizon, discounting, costs included, rounds of treatment, and the method used to calculate transition probabilities.
Results
In the deterministic base case analysis over a lifetime horizon, Nefecon plus BSC (hereafter Nefecon) had an incremental cost of $3,810 vs BSC. Nefecon resulted in a mean survival gain of 0.247 quality-adjusted life years (QALYs), 0.195 life years (LYs), and 0.244 equal value life years (evLYs) vs BSC alone – this resulted in incremental cost-effectiveness ratios (ICERs) of $15,428 per QALY, $19,502 per LY, and $15,611 per evLY gained. Probabilistic sensitivity analyses estimated that with willingness to pay thresholds of $100,000, $150,000, and $250,000 per QALY gained, Nefecon would be cost-effective over BSC in 66.70%, 75.02%, and 86.82% of cases, respectively. In the scenario analysis, Nefecon remained cost-effective with 4 rounds of treatment.
Conclusion
Nefecon was associated with LY and QALY gains vs BSC, with an incremental cost of $3,810. Based on these values, with a willingness to pay threshold of $100,000 per QALY gained, Nefecon was found to be a cost-effective treatment for US adults with primary IgAN.
Introduction
Primary immunoglobulin A nephropathy (IgAN) is a rare, progressive autoimmune disease that leads to fibrosis and chronic inflammation in the kidneys.Citation1,Citation2 IgAN is the most common type of primary glomerulonephritis globally, with an estimated worldwide incidence of 2.5 per 100,000 individuals per year.Citation3 A meta-analysis based on published United States (US) studies estimated an annual incidence of 1.29 per 100,000 people.Citation4 It occurs with the highest frequency in East Asians and Caucasians and is relatively rare in individuals of African ancestry.Citation5 IgAN is characterized by the formation and amplification of pathogenic immunoglobulin A (IgA) immune complexes that deposit within the glomeruli of the kidney,Citation2,Citation6,Citation7 and results in signs and symptoms including proteinuria (protein excreted in the urine), hematuria (blood in the urine), and hypertension.Citation1,Citation2 According to the current accepted model, the pathogenesis of IgAN involves four key factors (hits).Citation8 Patients with IgAN generally have elevated circulating levels of galactose-deficient IgA1 antibodies (Gd-IgA1), which are a subset of IgA1 molecules with O-linked glycans deficient in galactose (hit 1).Citation1,Citation9–11 The majority of Gd-IgA1 implicated in IgAN are produced by mucosal B-cells present in the terminal ileum, including the gut-associated lymphoid tissue, which contains Peyer’s patches.Citation11 The production of IgA or IgG autoantibodies specific to Gd-IgA1 (hit 2) leads to the formation of pathogenic immune complexes of Gd-IgA1 with these IgA or IgG autoantibodies (hit 3), and the subsequent accumulation of immune complexes and their deposition in the kidney induces irreversible kidney injury (hit 4).Citation1,Citation11 The disease typically presents in early adulthood and requires a kidney biopsy for definitive diagnosis – as such, it can exist subclinically until renal damage has already occurred.Citation1,Citation12
Over time, IgAN causes progressive loss of kidney function and can lead to end-stage renal disease (ESRD),Citation13 necessitating dialysis or transplantation and presenting a risk of premature death.Citation9,Citation14–16 It is difficult to predict when patients with IgAN will progress to ESRD. Data from a range of studies have shown that approximately half of patients with IgAN progressed to ESRD within 20 years;Citation16–18 in two studies reported progression rates were 23% within 3.9 yearsCitation16 and 53% within 19 years.Citation18 Progression of IgAN disease is accompanied by reduced quality of life, increased symptomatic burden, and rising healthcare costs, particularly in the later stages of chronic kidney disease (CKD) and ESRD.Citation19,Citation20 It is estimated that approximately one-third of patients with IgAN will experience recurrence after kidney transplantation, which corroborates an extrarenal origin of the disease.Citation1,Citation21–24
IgAN has been managed by supportive care as there are no approved therapies that modify the disease or that delay its progression or improve long-term renal outcomes.Citation1,Citation10 Since available management options are limited, there is a focus on the downstream signs and symptoms of disease rather than treating the underlying pathophysiology.Citation1 Optimized supportive care is highlighted as the primary approach to the management of patients with IgAN, including blood pressure management, renin–angiotensin system (RAS) blockade with maximally tolerated dose of angiotensin-converting enzyme inhibitors (ACEi) or angiotensin II receptor blockers (ARB) and lifestyle modification.Citation25 According to the 2021 Kidney Disease Improving Global Outcomes (KDIGO) clinical practice guidelines, patients at high risk of progressive CKD despite maximal supportive care, are recommended to participate in a clinical trial.Citation25 Systemic glucocorticoids (prednisone, prednisolone, and methylprednisolone) are suggested but are not recommended in patients at high risk of disease progression due to safety concerns of treatment-emergent toxicities and a lack of established clinical benefit.Citation25
TARPEYO® (budesonide) delayed-release capsules 4mg (hereafter referred to by the development name of Nefecon) is a novel oral formulation that is designed to deliver budesonide to an area of the distal ileum including Peyer’s patches where mucosal B-cells are located. It is hypothesized to modulate numbers and activity of mucosal B cells that produce Gd-IgA1 antibodies through anti-inflammatory and immunosuppressive effects.Citation26,Citation27 Nefecon has been approved by the US Food and Drug Administration (FDA) under the trade name TARPEYO® and under Accelerated Approval for the reduction of proteinuria in adults with primary IgAN at risk of rapid disease progression, generally defined as a urine-to-creatinine ratio (UPCR) ≥1.5 g/g.Citation28
The efficacy and safety of Nefecon was evaluated in Part A of the NefIgArd clinical trial (ClinicalTrials.gov Identifier NCT03643965), a multicenter, randomized, double-blind, placebo-controlled study evaluating the efficacy and safety of Nefecon (16 mg per day) in patients with biopsy-proven primary IgAN with an estimated glomerular filtration rate (eGFR) ≥35 mL/min per 1.73 m2 and ≤90 mL/min per 1.73 m2 and proteinuria (defined as either ≥1 g/day or UPCR ≥0.8 g/g), who were on a stable dose of maximally tolerated RAS blockage therapy using ACEis or ARBs.Citation29 The primary endpoint for Part A was a change in 24-hour UPCR after 9 months of treatment. There was a statistically significant reduction of 27% in UPCR among patients treated with Nefecon plus RASi compared to those receiving RASi plus placebo (ie, RASi alone) (p = 0.0003). Moreover, there was a benefit in eGFR preservation with Nefecon plus RASi corresponding to a 3.87 mL/min per 1.73 m2 difference vs RASi alone (p = 0.0014) at 9 months.Citation29 Most adverse events that occurred with greater incidence with Nefecon plus RASi compared to RASi alone were mild or moderate in severity and included hypertension, peripheral edema, muscle spasms, and acne.Citation29 There were no severe infections requiring hospitalization or deaths.
The objective of this analysis is to estimate the cost-effectiveness of introducing Nefecon for the treatment of commercially insured adult patients with primary IgAN in the US. A lifetime horizon, semi-Markov decision analytic model was developed to evaluate a hypothetical cohort of adult patients initiating either Nefecon in addition to RASi (ie, BSC) or BSC alone and utilized patient-level data from NefIgArd to inform efficacy inputs. Probabilistic sensitivity analysis (PSA) was conducted to account for parameter uncertainty and quantify the confidence of the economic endpoints. In addition, a variety of scenario analyses were run to examine the impact of varying model assumptions such as time horizon, modeled population, number of treatment rounds, and the method used to calculate transition probabilities.
Materials and Methods
Population
The model population was based on the population evaluated in the NefIgArd study,Citation29 which considered adult patients with primary IgAN, with baseline eGFR ≥35 mL/min per 1.73 m2 (CKD stages 1, 2, and 3), and undergoing RASi therapy. A starting age of 43 years was chosen for the model based on the mean age among the patient population in NefIgArd.Citation29 The NeflgArd study, Phase A of which has been completed and Phase B of which is ongoing, is a phase 3 trial conducted at 112 sites in Europe (Belarus, Belgium, the Czech Republic, Finland, France, Germany, Greece, Italy, Poland, Sweden, Turkey, Spain, and the United Kingdom); North America (Canada and the United States); South America (Argentina); and Asia Pacific (Australia, Taiwan, South Korea, and China) in accordance with the principles of the Declaration of Helsinki and the International Council for Harmonisation Good Clinical Practice guidelines. All participants provided written informed consent prior to enrollment. The trial protocol and informed consent form were submitted and approved by the duly constituted ethics committee or institutional review board at each center. For a majority of the US sites, IRB approval was granted by Advarra, 6940 Columbia Gateway Drive, Suite 110, Columbia, MD 21046.
Treatment Comparators
As Nefecon is the first and only FDA-approved treatment to reduce proteinuria in adults with IgAN at risk of rapid disease progression,Citation1,Citation25 BSC alone was considered the only relevant comparator for the analysis. BSC consists of blood pressure management, maximally tolerated doses of ACEi and/or ARBs (also known as RASi therapy), lifestyle modification, and cardiovascular risk management.Citation25
Perspective, Time Horizon, Cycle Length, and Discount Rates
The analysis was conducted from a US societal perspective. A lifetime horizon beginning at the time of treatment initiation was used in the base case model. Time horizons of 10- and 30-years were evaluated as additional scenario analyses. A cycle length of 1-month was used in the model. Discount rates of 3% per year for benefits and costs were applied in the base case as per the Institute for Clinical and Economic Review (ICER).Citation30 Additional scenario analyses evaluated outcomes under no discounting of benefits, no discounting of costs, and a scenario where neither costs nor benefits were discounted.
Conceptual Framework and Model Structure
A semi-Markov model structure was utilized to compare the health outcomes and associated costs of Nefecon plus BSC or BSC alone for the treatment of patients with primary IgAN. For simplicity, Nefecon plus BSC will be referred to as Nefecon throughout this analysis. The model structure consisted of the following nine health states: CKD stage 1, CKD stage 2, CKD stage 3a, CKD stage 3b, CKD stage 4, ESRD with or without dialysis, post-kidney transplant, and death ().
Figure 1 Semi-Markov model structure.
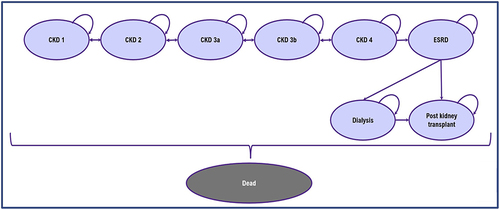
In the base case analysis, patients in the Nefecon arm could receive one round of treatment with up to four rounds of treatment tested through scenario analyses. Each treatment round included 9.25 months on treatment subsequently followed by 14.75 months off-treatment, in accordance with the NefIgArd trial (9 months on treatment plus a 2 week tapering period at half the dose, eg, 8mg).Citation29 In the model, patients could remain in the same health state or transition to another health state after each cycle. Half-cycle correction was applied to costs and benefits to account for the movement of patients at any point during a cycle. Patients could experience mortality from any of the health states.
In the base case analysis, transition probabilities between CKD and ESRD states for both the Nefecon and BSC arms were estimated using logistic regressions on the individual patient-level data from the NefIgArd trial.Citation31 For the regressions, eGFR values were mapped to CKD states at baseline and after 9 months of treatment. Patients were considered to have “transitioned” if they were in a different CKD state after 9 months treatment, compared to their baseline state. The likelihood of transiting was evaluated by treatment arm and by baseline CKD state. Transition probabilities to the post-transplant state were based on a study by Kent et al, 2015.Citation32 The probabilities of death from any state were dynamic over time and were estimated from standard life tables and standardized mortality ratios by the health state using data from Hastings et al, 2018.Citation16 The nine Markov health states considered are described further in Supplementary Table 1.
Model Inputs
Model inputs for the cost-effectiveness analysis are presented in Supplementary Table 2.
Distribution of Patients at Baseline
The distribution of patients between CKD stages at diagnosis of IgAN, and on entering the model, was sourced from the distribution of NefIgArd trial participants at baseline, and is presented in Supplementary Table 3.Citation29 Consistent with the trial population, it was assumed that no patient entered the model in the CKD stage 4, ESRD, or post-transplant health state.
Transition Probabilities
Transition probabilities that define the rate at which patients move between the CKD and ESRD health states in the model are presented in Supplementary Table 4. Probabilities were calculated from the output of logistic regression performed in R version 4.1.1Citation33 on individual patient-level data from NefIgArd (Part A).Citation31 The regression output provides the log odds ratio for each coefficient (CKD stage at baseline and treatment) from which probabilities were estimated according to the equation:
Where, are log odds ratios for each group compared to the reference group, β0 is the log odds of the reference group (intercept), and β1-k are the coefficients of interest. The reference group was assumed to be the CKD stage 3b placebo group at baseline.
In the base case analysis, the on-treatment transition probabilities were applied to patients in the Nefecon arm until the end of their final round of treatment. Following this period, off-treatment (placebo group) transition probabilities were used. Off-treatment transition probabilities were applied to the BSC arm throughout the model horizon.
Probabilities of transitioning from the ESRD states to the post-transplant state were calculated from the final CKD stage of patients (percentage) at the end of the study period as reported by Kent et al, 2015.Citation32 This reported percentage equated to the probability, p, of a patient starting in an ESRD stage at baseline to being in the transplant stage at the end of the study period. The study period was converted into time, t (cycles) via multiplying the number of years by the number of model cycles in one year. From these values, an event rate per cycle, r, was calculated using the equation:
The probability of transition from a respective ESRD state to the post-transplant state per cycle, where t = 1, was then calculated using the following equation to provide the values used in the model (presented in Supplementary Table 5).
For the CKD and ESRD health states, the probability of death was based on life table data and the standardized mortality ratio (SMR) of the respective health state. The SMRs of the CKD and ESRD health states were estimated using data from Hastings et al, 2018.Citation16 For the post-transplant state, the probability of death was calculated based on life table data and an SMR after renal transplant as reported by Ortiz et al, 2019.Citation34
For patients who transition into the ESRD health state, the proportion of those requiring dialysis (ESRD with dialysis) was sourced from a study by Hastings et al, 2018Citation16,(Supplementary Table 6). This study investigated the outcomes of progression to ESRD and life expectancy in 251 adult patients from the southeastern US with IgAN over a 30-year period.
Adverse Events
The frequencies of adverse events (AEs) were sourced from treatment-emergent AEs in the safety analysis set of NefIgArd (Part A) over the duration of follow-up (days of treatment period and days of follow-up period).Citation29 AEs were recorded as occurring in ≥4% of patients in either treatment arm. The frequency of each AE experienced by the safety analysis set in the trial was used to represent the probability, P, of each AE at time, t (duration of follow-up in days) to calculate an event rate, r using formula (2). The frequency (probability) of each AE per cycle was calculated using EquationEquation 3(3) , where t was the number of days per cycle and is presented in Supplementary Table 7. The frequency of each AE per cycle for both the Nefecon and BSC arms were applied with the associated disutility scores and costs to calculate the total QALYs lost and cost associated with AEs per cycle.
Cost Inputs
The following cost categories were included in the model: 1) treatment and administration of Nefecon, 2) AE costs, 3) dialysis and post-transplant costs, 4) mortality costs, and 5) indirect costs. Costs obtained from sources published prior to the model year were inflation-adjusted to current (2021) US dollar (USD) values based on the reported annual inflation rate of 2.53% (US Bureau of Labor Statistics 2019).Citation35
Treatment and Administration
The recommended dosage for Nefecon is 16 mg administered orally once daily (four capsules at a unit strength of 4 mg).Citation28 Patients treated with Nefecon in the model received 16 mg once daily for 9 months followed by 8 mg once daily for 2 weeks (the analysis converted this to 9.25 months of 16 mg once daily for ease of calculation), and the dose intensity was assumed to be 100% for all patients. The cost per unit of Nefecon used in the model was $118 USD.Citation36 One hundred and twenty units were required per patient, per cycle, therefore the total cost of treatment, per cycle with Nefecon was estimated to be $14,160 USD. As Nefecon is an orally administered therapy, it was assumed to bear no administration cost.
Adverse Event Costs
AE costs (Supplementary Table 7) were sourced from the Healthcare Cost and Utilization Project (HCUPnet) values for AEs requiring inpatient care, and CPT® physician visit values, for AEs not requiring inpatient care (ie, outpatient care).Citation37 The frequencies of AEs were sourced from the safety analysis set of the NefIgArd trial.Citation29 The proportion of AEs requiring inpatient and outpatient care were estimated from the proportion of treatment-emergent AEs assessed as severe in each arm of the NefIgArd trial.Citation29
Dialysis and Post-Transplant Costs
Dialysis costs were weighted by the proportions receiving hemodialysis and peritoneal dialysis per year, with the former weighted as occurring in 90% of cases.Citation38 The annual inflated Medicare costs of hemodialysis and peritoneal dialysis were $105,600 and $89,226, respectively.Citation39 The annual inflated commercial costs of hemodialysis and peritoneal dialysis were $276,295 and $233,453 respectively.Citation40 Medicare costs were used for people 65 years and over. For people under 65, commercial costs were used for a maximum of 33 months after which Medicare costs were used.Citation40
For patients transitioning to the post-transplant state, the total transplant cost was applied from a 2020 estimate of the average billed charges per transplant in the US as reported by Millman, 2020.Citation41 Transplant cost items include pre-transplant costs, procurement costs, hospital, and physician costs during transplant admission, post-transplant discharge costs, and outpatient immunosuppressants as well as other medication costs. The total inflated cost of a transplant used in the model was $453,703. Transplant costs were incurred by patients transitioning from an ESRD state to the post-transplant state for any given cycle.
Post-transplant cost items were applied to the total number of patients in the post-transplant state and included the cost of the post-transplant health state and total cost of post-transplant complications. The total post-transplant complication cost included the cost of re-transplantationCitation41 and dialysis costs per cycle,Citation39 adjusted for the frequency of transplant failure (0.3%).Citation39
The respective treatment costs are shown in Supplementary Table 8.
Mortality Costs
The inflated mortality cost ($17,057) was based on a United Kingdom (UK) study by Kerr et al, 2017Citation42 who reported the cost of hospital care for the three-month period before death for people with CKD. The reported cost in GBP was converted to USDCitation43 and adjusted based on the mean per capita hospital expenditure ratio for end-of-life care between the UK and the US as reported by Bekelman et al, 2016.Citation44
Indirect Costs
Indirect costs were incorporated into the model in the form of productivity loss costs. These costs were estimated from the mean percentage of work hours missed reported by van Haalen et al, 2020,Citation45 the percentage of working patients in the modelCitation46 and the average weekly wage in the US of $984 USD.Citation47 Productivity loss costs were applied to patients in the CKD stages 3, 4, and 5, and ESRD health states (Supplementary Table 9).
Health-Related Quality of Life Inputs
The model incorporated health state utilities and disutilities of AEs.
Health State Utilities
Quality-adjusted life years (QALYs) were calculated as the sum of the utility-weighted time in each health state. The most robust external publication providing relevant utility data identified was the health utility study by Gorodetskaya et al, 2005, which assessed the relationship between eGFR and changes in health-related quality of life and utility in patients with CKD.Citation48 Utility scores were elicited using a time trade-off (TTO) questionnaire and are presented in Supplementary Table 10.
Disutilities of AEs
AE-related disutilities were included in the model. To derive QALYs lost per cycle, the cycle prevalence of each AE was combined with the disutility and assumed duration of each specific AE (Supplementary Table 11). Treatment-emergent AE prevalence values were obtained from the NefIgArd trial.Citation29
Economic Endpoints
Three economic endpoints included in the analysis were the incremental cost-effectiveness ratios (ICERs) of cost per life-year (LY), QALY, and equal value life year (evLY). The methods to calculate the ICERs are similar where the incremental cost of therapy is divided by the incremental benefit.
Probabilistic Analysis
Probabilistic sensitivity analysis was performed to explore the uncertainty of all model parameters and their associated impact on cost-effectiveness results. ICER uncertainty within the model was evaluated via recalculation of mean costs and QALYs over 5,000 iterations. Clinical probabilities were assigned a beta distribution and were calculated using a binomial SE based upon the number of participants in the clinical data. Utilities and probabilities were assigned a beta distribution, costs were assigned a gamma distribution, and a standard error (SE) of 10% of the base-case value was assumed when error estimates were not available from relevant data sources.
Scenario Analyses
Additional scenarios were explored to evaluate how base case findings were impacted when model parameters and inputs were modified. The list of scenarios evaluated is presented in .
Table 1 Description of the Scenarios Evaluated
Results
Incremental Costs and Outcomes
The base case deterministic analysis results as well as the probabilistic results comparing Nefecon with BSC utilized inputs presented in Supplementary Table 2. In the deterministic analysis, over a lifetime horizon, treatment with Nefecon resulted in 15.506 LYs, 13.426 QALYs, and 13.423 evLYs per patient, with a total cost of $1,209,075 USD (). In the Nefecon arm, 59% of LYs consisted of CKD stage 1–3b, whereas with BSC only 52% of LYs consisted of CKD stage 1–3b considering a lifetime horizon. Nefecon treatment for patients with primary IgAN resulted in 0.195 incremental LYs, 0.247 incremental QALYs, and 0.244 incremental evLYs, with an incremental cost of $3,810 over BSC. Nefecon had an ICER of $15,428 per QALY and $19,502 per LY vs BSC. Moreover, Nefecon resulted in an ICER of $15,611 per evLY against BSC. Thus, Nefecon had both a greater benefit and higher cost than BSC in the base case analysis ().
Table 2 Summary of Nefecon Benefits (Over a Lifetime Horizon)
Table 3 Calculated ICERs for Nefecon vs BSC (Over a Lifetime Horizon)
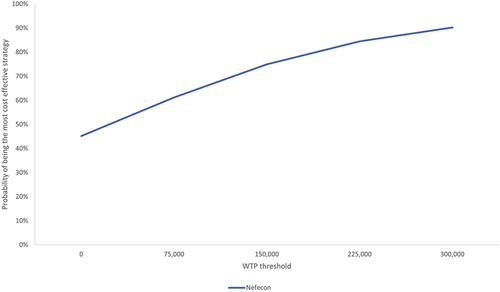
In the probabilistic analysis, over a lifetime horizon, treatment with Nefecon resulted in 15.605 LYs, 13.530 QALYs, and 13.527 evLYs per patient, with a total cost of $1,204,857 USD (). Nefecon treatment for patients with primary IgAN resulted in 0.196 incremental LYs, 0.251 incremental QALYs, and 0.247 incremental evLYs, with an incremental cost of $4,395 over BSC. Nefecon had an ICER of $17,538 per QALY, $22,452 per LY, and $17,760 per evLY against BSC. Consistent with the deterministic analysis, Nefecon had both a greater benefit and higher cost than BSC (). In over 5,000 Monte Carlo iterations, 55% of ICERs landed in quadrant 1 of the cost-effectiveness plane (incremental), 45% in quadrant 2 (dominant), 0% in quadrant 3 (decremental), and 0% in quadrant 4 (dominated) (). The net benefit approach showed that beyond a threshold of $75,000 per QALY gained, Nefecon was more likely to be cost-effective than BSC ().
Figure 2 PSA cost-effectiveness plane (Nefecon vs BSC).
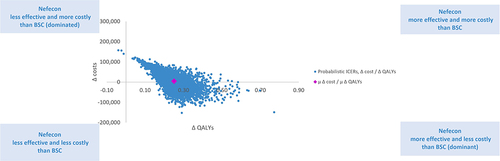
Figure 3 Cost-effectiveness acceptability curve.
Scenario Analyses
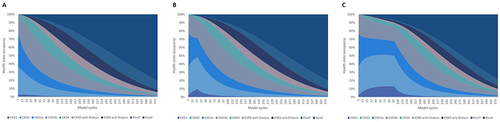
Details of the scenario analyses and results are presented in . The scenario analyses found that Nefecon is most cost-effective for people with a lower kidney function (CKD stage 3b and 3a), as progression is delayed earlier in the disease pathway. In addition, it revealed that Nefecon remains cost-effective after four treatment rounds. presents the health state occupancy over the model time horizon for the treatment options of BSC, Nefecon, as well as the scenario where patients receive four rounds of Nefecon treatment. As one might expect, additional rounds of treatment with Nefecon increased the difference in health state occupancy between the treatment arms.
Table 4 Results of Scenario Analyses (Deterministic)
Figure 4 Health state occupancy (deterministic results). (A) Best supportive care. (B) Nefecon (one round of treatment). (C) Nefecon (four rounds of treatment).
Two additional scenarios were conducted where the efficacy of Nefecon was converted into clinical outcomes using a published meta-regression by Thompson et al, 2019 (of the relationship between the treatment effect on proteinuria reduction and the treatment effect on clinical outcomes).Citation49 These scenarios were used to validate the base case model results and robustness of the modelling methods. In these two scenarios, transition probabilities between health states for the Nefecon arm were calculated by applying risk ratios (RR) of the treatment effect on clinical outcome, to the transition probabilities for the BSC arm. The RRs for each CKD state were derived from a literature-based hazard ratio (HR). The HR was calculated by converting the treatment effect on proteinuria, at the time point of interest (9 months/12 months), to an associated HR using the published meta-regression.Citation49 Using the HR derived from the treatment effect from NeflgArd (part A) measured at 9 months resulted in a dominant ICER and therefore improved the cost-effectiveness of Nefecon. The scenario using the preliminary NeflgArd 12-month treatment effect further improved the cost-effectiveness of Nefecon – in other words, Nefecon remained dominant over BSC.
The exclusion of the routine care costs, rounds of treatment, hazard ratio from Thompson (12 months) were the top three scenarios that had the highest impact on costs, resulting in net cost increases of $101,882, $76,843 and -$28,602, respectively. Their ICERs (cost/QALY) were $412,514, $83,460, and -$89,869, respectively.
Validation
At the time of completion of this model, there was no cost-effectiveness analysis for this indication. Therefore, a targeted review was conducted which identified three Health Technology Assessments (ie, two from ICER and one from CADTH), one NICE clinical guideline, and three peer-reviewed published studies (ie, one SLR, two models).Citation19,Citation50–55 Five out of the six cost-effectiveness analyses that were examined used a Markov model (excluding the SLR above). Among these, four analyses used health states in the model structure and three used CKD stages or progression (ie, level of eGFR). These findings informed the current model framework. LY estimates for the BSC arm (ie, 15.3 years) which were generated from this model are aligned with the median survival time in IgAN patients (ie, 18.1 years) reported in Hastings et al, 2018 which serve to validate this model framework.Citation16
Discussion
This analysis examined the cost-effectiveness of Nefecon in addition to BSC (RASi therapy) compared to BSC alone in commercially insured adult patients with primary IgAN from a US societal perspective. Nefecon, marketed in the United States as TARPEYO®, is the first FDA-approved agent to reduce proteinuria in adult patients with primary IgAN who are at risk of rapid disease progression.Citation28 Nefecon is hypothesized to act on the gut-kidney axis through anti-inflammatory and immunosuppressive effectsCitation11 by delivering budesonide to the ileum, where Gd-IgA1 antibody-producing B cells implicated in primary IgAN pathogenesis are concentrated.Citation28,Citation56 Efficacy and safety data for the model were sourced from Part A of the ongoing randomized, double-blind, multicenter, phase 3 trial NefIgArd, which showed a 27% reduction from the baseline in UPCR at 9 months, along with a 3.87 mL/min per 1.73 m2 difference in eGFR in favor of Nefecon 16 mg/day plus RASi compared to RASi alone.Citation29
In the cost-effectiveness analysis, the deterministic (probabilistic) incremental costs for the Nefecon treatment approach were estimated at $3810 ($4395) USD vs BSC alone over a lifetime horizon. Nefecon was associated with a mean survival gain of 0.195 (0.196) LYs, 0.247 (0.251) QALYs, and 0.244 (0.247) evLYs compared with BSC. The resulting ICERs were $19,502 ($17,538) per LY, $15,428 ($22,452) per QALY, and $15,611 ($17,760) per evLY. At a willingness to pay threshold of $150,000, Nefecon was cost-effective in 75.02% of model iterations.
Scenario analyses generally showed consistency with the base case findings. Nefecon treatment was cost-effective after one round of treatment (base case) and remained cost-effective with four rounds over a lifetime horizon. The cost-effectiveness of Nefecon in the model is likely explained by the proportionally greater amount of time spent in earlier (less severe) health states vs later health states (ie, CKD 4, ESRD, and post-kidney transplant) for patients treated with Nefecon plus BSC vs BSC alone. In the model, additional rounds of treatment with Nefecon increased the difference in health state occupancy between the two treatment arms, as progression was further delayed (see ).
Limitations
The analysis has several limitations to note. Individual patient-level data were used to derive the transition probabilities between health states in the model. The base case model assumed one round of treatment with Nefecon consisting of 9.25 consecutive months on-treatment, followed by 14.75 months off-treatment. The modeled scenario represents a plausible treatment strategy with Nefecon; however, in reality, patients may receive additional rounds of treatment.
The base model assumed that the transition probabilities between health states for Nefecon were consistent until the end of the treatment round. After this, the transition probabilities for Nefecon reverted to placebo-derived estimates. Additional scenarios tested the cost-effectiveness of up to four rounds of treatment where the transition probabilities for Nefecon were reapplied based on the rounds of treatment being tested. Real-world utilization of Nefecon may differ which may impact transition probabilities and the ICER. Data are currently not available to determine the true efficacy of additional treatment rounds; thus, transition probabilities from the first round of treatment are applied to subsequent rounds in the scenario analyses.
The SMRs used to calculate the probability of death from CKD and ESRD health states were estimated from survival curves reported in a study by Hastings et al, 2018.Citation16 This study reported patient and kidney survival of 251 adult patients diagnosed with IgAN from the southeastern US, but population characteristics, such as age and CKD stage at diagnosis, were not matched to participants in the NefIgArd trial.
Lastly, health state utility values were sourced from the literature for a broader population of people with CKD and were not specific to people with IgAN, as no IgAN-specific utilities were identified. It is not clear whether people with CKD resulting from IgAN would have the same effect on their health-related quality of life (HRQoL) as people with CKD attributed to other causes.
Conclusion
Under reasonable assumptions reflecting the real-world societal perspective, Nefecon was cost-effective in a deterministic model with an ICER of $15,427 per QALY. The probabilistic analysis assessed an ICER of $17,538 per QALY. It estimated that with willingness to pay thresholds of $100,000, $150,000, and $250,000 per QALY gained, Nefecon would be cost-effective over BSC in 66.70%, 75.02%, and 86.82% of cases, respectively. The cost-effectiveness of Nefecon vs BSC alone may result from the proportionally greater amount of time spent in earlier, less severe health states of the disease. Additional scenario analyses generally showed consistency with the base case findings.
Disclosure
Christopher Ngai and Mit Patel were employees of Calliditas Therapeutics at the time the study was conducted. Gabriel Tremblay, Lauren Ramjee, and Nesrin Vurgun are employees of Cytel, Inc., which was a paid consultant to Calliditas Therapeutics in connection with the development of this manuscript. The authors report no other conflicts of interest in this work.
Acknowledgments
This study was funded by Calliditas Therapeutics. The abstract of this paper was presented at the ISPOR Annual 2022 Congress as a poster presentation with interim findings. The poster’s abstract was published in Volume 25, Issue 7, Supplement “Poster Abstracts” in Value in Health: https://doi.org/10.1016/j.jval.2022.04.688.
References
- Lafayette RA, Kelepouris E. Immunoglobulin A nephropathy: advances in understanding of pathogenesis and treatment. Am J Nephrol. 2018;47(suppl1):43–52. doi:10.1159/000481636
- Wyatt RJ, Julian BA. IgA nephropathy. N Engl J Med. 2013;368(25):2402–2414. doi:10.1056/NEJMra1206793
- McGrogan A, Franssen CF, de Vries CS. The incidence of primary glomerulonephritis worldwide: a systematic review of the literature. Nephrol Dial Transplant. 2011;26(2):414–430. doi:10.1093/ndt/gfq665
- Kwon CS, Daniele P, Forsythe A, Ngai C. A systematic literatureA review of the epidemiology, health-related quality of life impact, and economic burden of immunoglobulin a nephropathy. J Health Econ Outcomes Res. 2021;8(2):35–44. doi:10.36469/001c.26129
- Sim JJ, Batech M, Hever A, et al. Distribution of biopsy-proven presumed primary glomerulonephropathies in 2000–2011 among a racially and ethnically diverse US population. Am J Kidney Dis. 2016;68(4):533–544. doi:10.1053/j.ajkd.2016.03.416
- Moldoveanu Z, Wyatt RJ, Lee JY, et al. Patients with IgA nephropathy have increased serum galactose-deficient IgA1 levels. Kidney Int. 2007;71(11):1148–1154. doi:10.1038/sj.ki.5002185
- Floege J. Fatal attraction: immunoglobulin A and the glomerular mesangium. J Am Soc Nephrol. 2019;30(7):1139–1141. doi:10.1681/ASN.2019040373
- Canetta PA, Kiryluk K, Appel GB. Glomerular diseases: emerging tests and therapies for IgA nephropathy. CJASN. 2014;9(3):617–625. doi:10.2215/CJN.07260713
- Kiryluk K, Novak J. The genetics and immunobiology of IgA nephropathy. J Clin Invest. 2014;124(6):2325–2332. doi:10.1172/jci74475
- Reid S, Cawthon PM, Craig JC, Samuels JA, Molony DA, Strippoli GF. Non-immunosuppressive treatment for IgA nephropathy. Cochrane Database Syst Rev. 2011. doi:10.1002/14651858.CD003962.pub2
- Barratt J, Rovin BH, Cattran D, Trimarchi H, Zhang H. Why target the gut to treat IgA nephropathy? KI Reports. 2020;5(10):1620–1624. doi:10.1016/j.ekir.2020.08.009
- Yeo SC, Goh SM, Barratt J. Is immunoglobulin A nephropathy different in different ethnic populations? Nephrology. 2019;24(9):885–895. doi:10.1111/nep.13592
- Duan ZY, Cai GY, Chen YZ, et al. Aging promotes progression of IgA nephropathy: a systematic review and meta-analysis. Am J Nephrol. 2013;38(3):241–252. doi:10.1159/000354646
- Schena FP. A retrospective analysis of the natural history of primary IgA nephropathy worldwide. Am J Med. 1990;89(2):209–215. doi:10.1016/0002-9343(90)90300-3
- Knoop T, Vikse BE, Svarstad E, Leh S, Reisæter AV, Bjørneklett R. Mortality in patients with IgA nephropathy. Am J Kidney Dis. 2013;62(5):883–890. doi:10.1053/j.ajkd.2013.04.019
- Hastings MC, Bursac Z, Julian BA, et al. Life expectancy for patients from the Southeastern United States With IgA nephropathy. Kidney Int Rep. 2018;3(1):99–104. doi:10.1016/j.ekir.2017.08.008
- Arroyo AH, Bomback AS, Butler B, et al. Predictors of outcome for severe IgA nephropathy in a multi-ethnic U.S. cohort. CN. 2015;84:145–155. doi:10.5414/CN108556
- Rauen T, Wied S, Fitzner C, et al. After ten years of follow-up, no difference between supportive care plus immunosuppression and supportive care alone in IgA nephropathy. Kidney Int. 2020;98(4):1044–1052. doi:10.1016/j.kint.2020.04.046
- Hiragi S, Tamura H, Goto R, Kuroda T. The effect of model selection on cost-effectiveness research: a comparison of kidney function-based microsimulation and disease grade-based microsimulation in chronic kidney disease modeling. BMC Med Inform Decis Mak. 2018;18(1):94. doi:10.1186/s12911-018-0678-7
- Libório AB, Santos JPL, Minete NFA, et al. Proteinuria is associated with quality of life and depression in adults with primary glomerulopathy and preserved renal function. PLoS One. 2012;7(5):e37763. doi:10.1371/journal.pone.0037763
- Infante B, Rossini M, Di Lorenzo A, et al. Recurrence of immunoglobulin A nephropathy after kidney transplantation: a narrative review of the incidence, risk factors, pathophysiology and management of immunosuppressive therapy. Clin Kidney J. 2020;13(5):758–767. doi:10.1093/ckj/sfaa060
- Allen PJ, Chadban SJ, Craig JC, et al. Recurrent glomerulonephritis after kidney transplantation: risk factors and allograft outcomes. Kidney Int. 2017;92(2):461–469. doi:10.1016/j.kint.2017.03.015
- Ponticelli C, Glassock RJ. Posttransplant recurrence of primary glomerulonephritis. Clin J Am Soc Nephrol. 2010;5(12):2363–2372. doi:10.2215/CJN.06720810
- Ponticelli C, Traversi L, Banfi G. Renal transplantation in patients with IgA mesangial glomerulonephritis. Pediatr Transplant. 2004;8(4):334–338. doi:10.1111/j.1399-3046.2004.00177.x
- Rovin BH, Adler SG, Barratt J, et al. KDIGO 2021 clinical practice guideline for the management of glomerular diseases. Kidney Int. 2021;100(4):S1–S276. doi:10.1016/j.kint.2021.05.021
- Fellstrom BC, Barratt J, Cook H, et al. Targeted-release budesonide versus placebo in patients with IgA nephropathy (NEFIGAN): a double-blind, randomised, placebo-controlled phase 2b trial. Lancet. 2017;389(10084):2117–2127. doi:10.1016/S0140-6736(17)30550-0
- Watts P, Smith A. TARGIT technology: coated starch capsules for site-specific drug delivery into the lower gastrointestinal tract. Expert Opin Drug Deliv. 2005;2(1):159–167. doi:10.1517/17425247.2.1.159
- Calliditas Therapeutics AB. TARPEYO (Budesonide) US prescribing information; 2021. Available from: https://www.accessdata.fda.gov/drugsatfda_docs/label/2021/215935s000lbl.pdf. Accessed March 16, 2023.
- Barratt J, Lafayette R, Kristensen J, et al. Results from part A of the multi-center, double-blind, randomized, placebo-controlled NefIgArd trial evaluated targeted-release formulation of budesonide for the treatment of primary immunoglobulin A nephropathy. Kidney Int. 2023;103. doi:10.1016/j.kint.2022.09.017
- ICER’s Reference Case for Economic Evaluations. Principles and rationale. Institute for Clinical and Economic Review; 2020. https://icer.org/wp-content/uploads/2020/10/ICER_Reference_Case_013120.pdf. Accessed June 25, 2021.
- Calliditas Therapeutics AB. Data on file: clinical study report – a randomized, double-blind, placebo-controlled study to evaluate efficacy and safety of nefecon in patients with primary IgA nephropathy at risk of progressing to end-stage renal disease (NefIgArd) (data cutoff date of 05 October 2020 for part a analysis) – version 1.0; 2021.
- Kent S, Schlackow I, Lozano-Kühne J, et al. What is the impact of chronic kidney disease stage and cardiovascular disease on the annual cost of hospital care in moderate-to-severe kidney disease? BMC Nephrol. 2015;16(1):65. doi:10.1186/s12882-015-0054-0
- R Core Team. R: a language and environment for statistical computing; 2013. Available from: http://www.R-project.org/. Accessed March 16, 2023.
- Ortiz F, Harjutsalo V, Helanterä I, Lempinen M, Forsblom C, Groop PH. Long-term mortality after kidney transplantation in a nationwide cohort of patients with type 1 diabetes in Finland. Diabetes Care. 2019;42(1):55–61. doi:10.2337/dc18-1029
- CPI inflation calculator; 2021. Available from: https://www.bls.gov/data/inflation_calculator.htm. Accessed June 25, 2021.
- Calliditas Therapeutics AB. Data on file: price of TARPEYO©; 2021.
- HCUPnet. HCUPnet; 2015. Available from: https://hcupnet.ahrq.gov/. Accessed April 15, 2021.
- Statistics The Kidney Project. The kidney project; 2021. Available from: https://pharm.ucsf.edu/kidney/need/statistics. Accessed June 25, 2021.
- Annual Data Report. USRDS; 2021. Available from: https://adr.usrds.org/2020/end-stage-renal-disease/9-healthcare-expenditures-for-persons-with-esrd. Accessed June 25, 2021.
- OPTUM. Kidney resource services – network access; 2017. Available from: https://www.optum.com/content/dam/optum3/optum/en/resources/white-papers/kidney-resources-services-network-access.pdf. Accessed March 16, 2023.
- Bentley TS, Ortner NJ. Milliman research report: 2020 U.S. Organ and Tissue Transplants: Cost estimates, discussion, and emerging issues. Available from: https://www.milliman.com/-/media/milliman/pdfs/articles/2020-us-organ-tissue-transplants.ashx. Accessed March 16, 2023.
- Kerr M, Matthews B, Medcalf JF. End-of-life care for people with chronic kidney disease: cause of death, place of death and hospital costs. Nephrology Dialysis Transplantation | Oxford Academic; 2017. Available from: https://academic.oup.com/ndt/article/32/9/1504/3059442. Accessed March 16, 2023.
- Historical rates tables - USD | xe; 2021. Available from: https://www.xe.com/currencytables/?from=USD. Accessed June 25, 2021.
- Bekelman JE, Halpern SD, Blankart CR, et al. Comparison of site of death, health care utilization, and hospital expenditures for patients dying with cancer in 7 developed Countries. JAMA. 2016;315(3):272–283. doi:10.1001/jama.2015.18603
- van Haalen H, Jackson J, Spinowitz B, Milligan G, Moon R. Impact of chronic kidney disease and anemia on health-related quality of life and work productivity: analysis of multinational real-world data. BMC Nephrol. 2020;21(1):88. doi:10.1186/s12882-020-01746-4
- Statista. U.S. employment rate by age 2020; 2021. Available from: https://www.statista.com/statistics/217899/us-employment-rate-by-age/. Accessed June 25, 2021.
- Bureau of Labor Statistics. Usual weekly earnings of wage and salary workers first quarter; 2021. Available from: https://www.bls.gov/news.release/pdf/wkyeng.pdf. Accessed November 16, 2021.
- Gorodetskaya I, Zenios S, Mcculloch CE, et al. Health-related quality of life and estimates of utility in chronic kidney disease. Kidney Int. 2005;68(6):2801–2808. doi:10.1111/j.1523-1755.2005.00752.x
- Thompson A, Carroll K, Inker L, et al. Proteinuria reduction as a surrogate end point in trials of IgA nephropathy. Clin J Am Soc Nephrol. 2019;14(3):469–481. doi:10.2215/CJN.08600718
- Mustafa R, Bloudek L, Fox G, et al. Treatments for anemia in chronic kidney disease: effectiveness and value; evidence report. Institute Clin Eco Rev. 2021;9:5.
- Lin E, Chertow GM, Yan B, Malcolm E, Goldhaber-Fiebert JD. Cost-effectiveness of multidisciplinary care in mild to moderate chronic kidney disease in the United States: a modeling study. PLoS Med. 2018;15(3):e1002532. doi:10.1371/journal.pmed.1002532
- Sugrue DM, Ward T, Rai S, McEwan P, van Haalen HGM. Economic modelling of chronic kidney disease: a systematic literature review to inform conceptual model design. Pharmaco Eco. 2019;37(12):1451–1468. doi:10.1007/s40273-019-00835-z
- Tonelli M, Klarenbach S, Wiebe N, Shrive F, Hemmelgarn B, Manns B. Stimulating agents for anemia of chronic kidney disease: systematic review and economic evaluation [technology report number 106]. Canadian Agency Drugs Technol Health. 2008;2008:15.
- National Guideline Centre. RRT and conservative management. Cost-effectiveness analysis: HDF versus high flux HD. NICE. 2018;2008:105.
- Tice J, Mandrik O, Thokala P, et al. Voclosporin and belimumab for lupus nephritis: effectiveness and value; evidence report. Institute Clin Eco Rev. 2021;20:1105.
- Bhachu JS, Scionti K, Muto M, Molyneux K, Barratt J. Targeted release-budesonide (NEFECON) modifies circulating IgA-IgG immune complex levels and levels of poorly O-Galactosylated IgA in IgAN. Kidney Dis. 2018;4:121–122.
- Thompson A, Carroll K, Inker LA, et al. Proteinuria reduction as a surrogate end point in trials of IgA nephropathy. CJASN. 2019;14(3):469–481. doi:10.2215/cjn.08600718