

Abstract
Background
Proportion of days covered (PDC), a commonly used adherence metric, does not provide information about the longitudinal course of adherence to treatment over time. Group-based trajectory model (GBTM) is an alternative method that overcomes this limitation.
Methods
The statistical principles of GBTM and PDC were applied to assess adherence during a 12-month follow-up in psoriasis patients starting treatment with a biologic. The optimal GBTM model was determined on the basis of the balance between each model’s Bayesian information criterion and the percentage of patients in the smallest group in each model. Variables potentially predictive of adherence were evaluated.
Results
In all, 3,249 patients were included in the analysis. Four GBTM adherence groups were suggested by the optimal model, and patients were categorized as demonstrating continuously high adherence, high-then-low adherence, moderate-then-low adherence, or consistently moderate adherence during follow-up. For comparison, four PDC groups were constructed: PDC Group 4 (PDC ≥75%), PDC Group 3 (25%≤ PDC <50%), PDC Group 2 (PDC <25%), and PDC Group 1 (50%≤ PDC <75%). Our findings suggest that the majority of patients (97.9%) from PDC Group 2 demonstrated moderate-then-low adherence, whereas 96.4% of patients from PDC Group 4 showed continuously high adherence. The remaining PDC-based categorizations did not capture patients with uniform adherence behavior based on GBTM. In PDC Group 3, 25.3%, 17.2%, and 57.5% of patients exhibited GBTM-defined consistently moderate adherence, moderate-then-low adherence, or high-then-low adherence, respectively. In PDC Group 1, 70.8%, 23.6%, and 5.7% of patients had consistently moderate adherence, high-then-low adherence, and continuously high adherence, respectively. Additional analyses suggested GBTM-based categorization was best predicted by patient age, sex, certain comorbidities, and particular drug use.
Conclusion
GBTM is a more appropriate way to model dynamic behaviors and offers researchers an alternative to more traditional drug adherence measurements.
Supplementary material
Figure S1 Calculation of within-group variance.
Notes: Step 1: Within each group, calculate variance at each time point k. Step 2: Now, we have 52 observations for each trajectory group and 52 observations for each PDC group. Then apply 2-sample Student’s t-test for Trajectory Group i versus PDC Group i. Before 2-sample Student’s t-test, F-test for testing equal variance is performed. Select 2-sample Student’s t-test with equal variance or 2-sample Student’s t-test with unequal variance based on the result of the F-test. Under the assumption of equal variances, the pooled estimate of the common standard error is calculated. Under the assumption of unequal variances (the Behrens–Fisher problem), the unpooled standard error is computed and degrees of freedom are calculated by using Satterthwaite’s approximation.
Abbreviation: PDC, proportion of days covered.
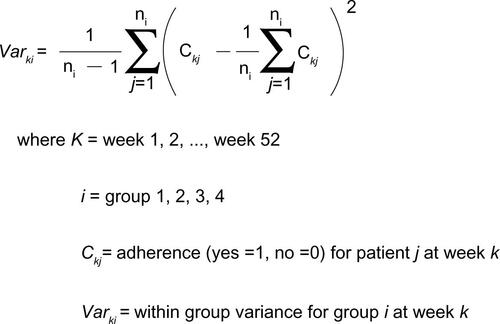
Figure S2 Comparison of “within group” variance from GBTM and from PDC measure.
Note: Difference is PDC – GBTM.
Abbreviations: GBTM, group-based trajectory model; PDC, proportion of days covered.
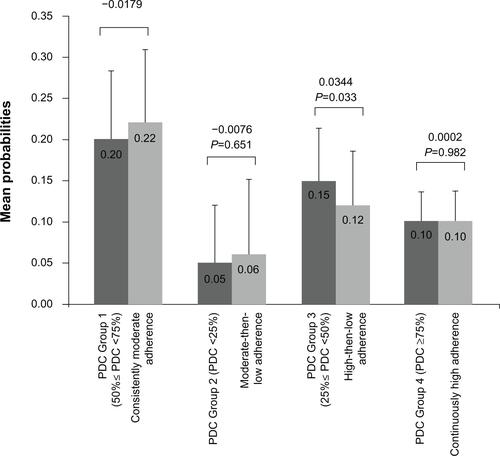
Table S1 Patient comorbidities
Disclosure
This study was financially supported by Novartis Pharmaceuticals Corporation. Yunfeng Li, Kristijan H Kahler, Haijun Tian, Susan Gabriel, and Steve Arcona are employees of Novartis Pharmaceuticals Corporation. Huanxue Zhou is a senior analyst at KMK Consulting, Inc., and works as a consultant for Novartis Pharmaceuticals Corporation. Beilei Cai was a Health Economics and Outcome Research (HEOR) Fellow from University of Utah and participated in this research as a part of her HEOR Fellowship at Novartis Pharmaceuticals Corporation. Written and editorial support for the preparation of this manuscript was provided by Write All, Inc., who received funding for services from Novartis Pharmaceuticals Corporation. All of the authors have read and approved the content of the entire manuscript, and meet the authorship criteria provided by ICMJE.