
Abstract
Objective
The definition of frailty still lacks quantitative biomarkers. This study aimed to investigate the relationship between nutrition-related biomarkers and frailty in hospitalized older patients.
Materials and methods
This is a cross-sectional study including 380 hospitalized older patients. The patients were categorized as nonfrail (n=140), prefrail (n=81), and frail (n=159) by the criteria of frailty phenotype. The nutritional status was assessed using the mini nutritional assessment-short form (MNA-SF), levels of serum transferrin (TNF), prealbumin (PA), total protein (TP), albumin (ALB), retinol-binding protein (RBP), and hemoglobin (Hb).
Results
The grip strength, levels of serum TFN, TP, ALB, Hb, and MNA-SF scores all decreased significantly in the order of nonfrail, prefrail, and frail groups (P<0.01). Older ages, more fall incidents, and higher polypharmacy ratio were observed in the frail and prefrail groups than in the nonfrail group (P<0.05). Univariate logistic regression analysis showed that frailty was positively related to age, polypharmacy, fall history, nutritional status, levels of TFN, PA, TP, ALB, RBP, and Hb, but was negatively related to grip strength. Ordinal logistic regression analysis showed that older patients who were well nourished, with higher levels of TFN, TP, and ALB were less likely to develop into frailty.
Conclusion
Hospitalized older patients with better nutritional status and higher levels of TFN, TP, and ALB were less likely to develop into frailty. These nutrition-related biomarkers may be used for the evaluation of nutritional status and frailty in older patients.
Introduction
Frailty is a geriatric syndrome and is commonly defined as a clinically recognizable state in older adults. It is associated with increased vulnerability that is resulted from aging-associated declines in physiologic reserve and function across multiple organs and systems.Citation1–Citation5 Frailty is highly prevalent with increasing age and gives rise to high risk for adverse health outcomes, including falls, hospitalization, and mortality.
The concept and definition of frailty is still evolving. One of the approaches to frailty is the frailty phenotype,Citation3 which contains unintentional weight loss, exhaustion, weakness, slowness, and low physical activity. It is estimated that 10%–27% of the population over 65 years is frail by the definition of a combination of any three phenotypes.Citation6 Another approach defines frailty as a stage of age-related deficit accumulation and quantify the frail state using a “frail index”, which is the ratio of present deficits to the ones evaluated.Citation7 Both approaches to frailty have been extensively used and adapted in animal studies and clinical trials. Due to the lack of subcellular mechanisms and effective biomarkers, a consensus has not been reached in the concept of frailty.
Malnutrition is very common in hospitalized older patients with a prevalence up to 50%.Citation8,Citation9 Poor nutritional status has been shown to be associated with adverse clinical outcomes in older patients, such as decreased physical functions and increased mortality.Citation10,Citation11 In recent years, the relationship between frailty and malnutrition in community-dwelling older people has been demonstrated.Citation12–Citation15 However, this relationship in hospitalized older patients has not been investigated.
Our study aimed to compare the nutritional status and physical functions between nonfrail, prefrail, and frail hospitalized older patients and identify possible biomarkers for the evaluation of nutritional status and frailty.
Materials and methods
Study design
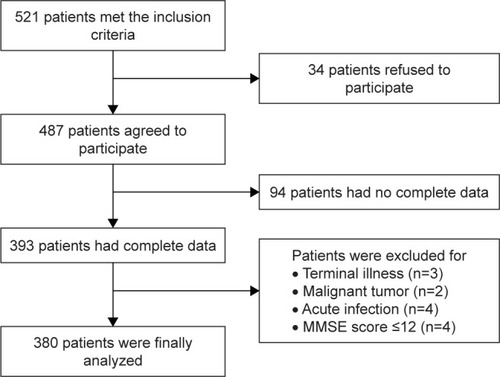
This is a cross-sectional study analyzing the clinical data of hospitalized older patients treated at the geriatric ward of Zhejiang Hospital between January 2017 and June 2018. The inclusion criteria were as follow: age ≥65 years, ability to understand and communicate in Chinese, ability to walk without assistance except walking aids, and hearing and vision sufficient for compliance with assessment. The exclusion criteria were as follow: acute infection, malignant tumor, cerebellum diseases, acute cerebrovascular diseases, delirium, terminal illness, or severe cognitive impairment (Mini-Mental State Examination [MMSE] <12). A total of 380 patients were included in the final analysis (). Our study was conducted in accordance with the Declaration of Helsinki and was approved by the Research Ethics Committee of Zhejiang Hospital. Written informed consent was obtained from each participant.
Figure 1 Flowchart of the patient inclusion.
Patient assessment
A comprehensive geriatric assessment (CGA) and frailty assessment were given to each qualified patient by a geriatric nurse and a geriatrician in our ward within 3 days after admission. The main content of CGA includes a general health questionnaire, assessment of activities of daily living (ADL),Citation16 instrumental ADL (IADL),Citation17 MMSE,Citation18 mini nutritional assessment-short form (MNA-SF),Citation19 and Tinetti performance-oriented mobility assessment (POMA).Citation20 Grip strength, fall history in the past year, and polypharmacy were recorded. Serum levels of transferrin (TFN), prealbumin (PA), total protein (TP), albumin (ALB), retinol-binding protein (RBP), and hemoglobin (Hb) were measured and recorded. Sociodemographic data including age, gender, educational level, body weight, and height were collected.
Assessment of frailty status
The Fried criterion, also known as the frailty phenotype, was used to assess the frailty status. Frailty phenotype with the five items is the most extensively used and tested criteria for its validity. These criteria are mentioned below.
Unintentional weight loss over 4.5 kg or 5% of body weight during the last year.
Decrease in the grip strength measured by Jamar dynamometer. The patient is sitting in the chair with the shoulders adducted, the elbows flexed to 90°, and the forearms in neutral position. Three measurements are made with 1-minute intervals, and the mean value of the three measurements is calculated. All values are adjusted for gender and body mass index (BMI). The criteria for weakness in women are the strength ≤17 kg for BMI of ≤23, ≤17.3 kg for BMI between 23.1 and 26, ≤18 kg for BMI between 26.1 and 29, and ≤21 kg for BMI >29. For men, the adjusted values are ≤29 kg for BMI of ≤24, ≤30 kg for BMI between 24.1 and 26, 30 kg for BMI between 26.1 and 28, and ≤32 kg for BMI >28.
Self-reported exhaustion. Self-reported feeling that everything is an effort or that one could not get “going” >2 times a week.
Slow walking speed. It is also adjusted for gender and the height of the patient regardless of whether a walking aid is used or not. For men with a height ≤173 cm, ≥7 seconds of walking through a distance of 4.57 m and for men with a height >173 cm, ≥6 seconds are assumed as slow speed. For women, slow speed is ≥7 seconds for those with a height ≤159 cm and ≥6 seconds for those with a height >159 cm (distance is same in all cases).
Low physical activity level. The criteria are <383 kcal/week for men and <270 kcal/week for women. All participants were diagnosed according to the frailty phenotype. One point for each item: 0 = not frail; 1–2 = prefrail; ≥3 = frail.
Assessment of nutritional status
The MNA-SF was used for the assessment of nutritional status, which has been validated for malnutrition screening in frail older people.Citation21 The MNA-SF includes six items: 1) weight loss in the last 3 months: >3 kg = 0, unknown = 1, 1–3 kg = 2, no = 3; 2) BMI: <19 = 0, 19–21 = 1, 21–23 = 2, >23 = 3; 3) psychological stress or acute disease: no = 0, yes = 2; 4) mobility: long-term bedridden = 0, capability but unwillingness of activities = 1, outdoor activities = 2; 5) neuropsychological problems: severe dementia or depression = 0, mild dementia or depression = 1, no = 2; 6) food intake: significant decrease in food intake = 0, mild decrease in food intake = 1, no = 2. The maximum total score is 14 points. A total score of 12–14 points indicate well nourishment, 8–11 points indicate risk of malnutrition, and 0–7 points indicate malnourishment.
Data collection
Sociodemographic data including age, gender, educational level, weight, and height were collected. Information about the frailty status and medication was collected by reviewing the medical records. Polypharmacy was defined as not less than five kinds of oral prescription drugs.Citation22 The ADL, IADL, and POMA were used to assess functional status. The cognitive status was evaluated using the MMSE. The MNA-SF and levels of serum TFN, PA, TP, ALB, RBP, and Hb were used to assess the nutritional status. Venous blood samples were collected in the early morning from the fasting patients and tested in a laboratory of Zhejiang Hospital. Some categorical variables, such as gender, educational level, polypharmacy, fall history, frailty status, and nutritional status, were reassigned. Continuous variables such as TFN, PA, TP, ALB, RBP, and Hb were reassigned into three grades with a cutoff from the lowest value to the percentile 25, the percentile 25 to the percentile 75, and the percentile 75 to the highest value (Table S1).
Statistical analysis
The normally distributed continuous data were presented as mean and SDs, and the nonnormally distributed continuous data were presented as medians and IQR. Categorical variables were presented as percentages or constituent ratios. When three groups were considered, the one-way ANOVA test (for normally distributed continuous data), the Pearson’s chi-squared test (for categorical data), and the Kruskal–Wallis test (for nonnormally distributed continuous data) were used for the comparison. When two groups were considered, the least significant difference (LSD) t-test (for normally distributed continuous data), the chi-squared test (for categorical data), and the Mann–Whitney U-test (for nonnormally distributed continuous data) were used for the comparison. As a secondary analysis, binary classification of frailty (nonfrail vs prefrail/frail) was treated as the dependent variable, and other assessments were treated as the continuous variables. The relationship between frailty and risk factors was analyzed using the univariate logistic regression analysis. Ordinal logistic regression analysis was used for further analysis of the relationship between frailty status and nutritional status as well as nutrition-related biomarkers, adjusting age, gender, BMI, polypharmacy, fall history, and grip strength. ORs were reported for significant associations. All statistical analyses were performed using the SPSS 22.0 software (IBM Corporation, Armonk, NY, USA). All significance tests were two-tailed, and statistical significance was assumed as P<0.05.
Results
Our patients included 140 nonfrail patients (36.8%), 81 prefrail patients (21.3%), and 159 frail patients (41.9%). The grip strength, levels of serum TFN, TP, ALB, Hb, and scores of MNA-SF, ADL, IADL, MMSE, POMA decreased significantly in the order of nonfrail, prefrail, and frail groups (P<0.01). Patients in the prefrail and frail groups were significantly older, more likely to have falls in the past year and had significantly higher polypharmacy rate in comparison with the nonfrail patients (P<0.05, ).
Table 1 Comparison of patients’ characteristics based on frailty status
The risk factors that may be associated with frailty were analyzed using the univariate logistic regression analysis. The results showed that the frailty status was positively related to age, polypharmacy, fall history, nutritional status, levels of TFN, PA, TP, ALB, RBP, and Hb, but was negatively related to grip strength (). Ordinal logistic regression analysis showed that older patients who were well nourished and had higher levels of TFN, TP, and ALB were less likely to develop into frailty ().
Table 2 Risk factors associated with frailty
Table 3 Relationship between frailty status and risk factors
Discussion
Our study demonstrated that older hospitalized patients with better nutritional status and higher serum levels of TFN, TP, and ALB were less likely to develop into frailty. In the order of nonfrail, prefrail, and frail groups, the patients were older, with decreased grip strength, scores of ADL, IADL, MMSE, POMA, MNA-SF, higher rates of polypharmacy, and more likely to have falls in the past year. Our results were consistent with previous findings.Citation14,Citation23,Citation24 However, we found no significant difference in the educational level between groups of different frailty status, which was not consistent with previous findings.Citation23,Citation24 The possible reason underlying this discrepancy may be that the classification criteria of educational level in our study were different from that in the previous studies. In addition, educational level was not a direct risk factor of frailty.
The frailty status was categorized into nonfrailty, pre-frailty, and frailty. Each risk factor that might be associated with frailty was analyzed using the univariate logistic regression analysis. Our study found that frailty status was positively related to age, polypharmacy, fall history, nutritional status, serum levels of TFN, PA, TP, ALB, RBP, and Hb, but was negatively related to grip strength. The ordinal logistic regression analysis showed that older patients who were well nourished and had higher serum levels of TFN, TP, and ALB were less likely to develop into frailty with adjustment of age, gender, BMI, polypharmacy, fall history, and grip strength. Previous studies have shown that there was a close relationship between nutritional status and frailty.Citation14,Citation15,Citation25,Citation26 Soysal et alCitation27 has demonstrated that the MNA can be used to detect frailty with a sensitivity of 66.9% and a specificity of 85.4%, suggesting a very close relationship between the nutritional status and frailty.
Protein–energy homeostasis is a major determinant of healthy aging. It has been shown that lower protein intake was associated with a higher frailty prevalence.Citation28–Citation31 Consistently, our study found that significantly higher serum levels of nutrition-related proteins were observed in the nonfrail patients compared to the prefrail and frail patients. In addition, ordinal logistic regression analysis also showed that patients with higher serum levels of TFN, TP, and ALB were less likely to develop into frailty. Although the association between serum levels of PA, RBP, Hb, and frailty was not found in our study, significant differences in these biomarkers did exist between the three groups. Deficiency of other important nutritional determinants, such as vitamin B12, is also found to be associated with frailty.Citation32
Our study has limitations. First, our study is a cross-sectional study and does not support causality conclusions. Second, generalization of our results should be cautious because the participants were from one hospital rather than multiple centers. Third, there are overlapping items between the frailty phenotype and MNA-SF.
Conclusion
Older hospitalized patients who were well nourished and had higher serum levels of TFN, TP, and ALB were less likely to develop into frailty. These nutrition-related biomarkers might be used for screening frailty in older patients.
Acknowledgments
Xiufang Hong was supported by funds from the Zhejiang Province Association of Traditional Chinese Medicine (2016ZB012, 2018ZA005) and the Science and Technology Department of Zhejiang Province (2018KY198). Liyu Xu was supported by a fund from the Science and Technology Department of Zhejiang Province (2017KY177).
Disclosure
The authors report no conflicts of interest in this work.
Supplementary material
Table S1 Reassignment of the variables
References
- FriedLPHadleyECWalstonJDFrom bedside to bench: research agenda for frailtySci Aging Knowledge Environ2005200531pe2416079413
- LipsitzLADynamics of stability: the physiologic basis of functional health and frailtyJ Gerontol A Biol Sci Med Sci2002573B115B12511867648
- FriedLPTangenCMWalstonJFrailty in older adults: evidence for a phenotypeJ Gerontol A Biol Sci Med Sci2001563M146M15711253156
- BortzWMThe physics of frailtyJ Am Geriatr Soc1993419100410088409170
- LipsitzLAGoldbergerALLoss of “complexity” and aging. Potential applications of fractals and chaos theory to senescenceJAMA199226713180618091482430
- Santos-EggimannBCuénoudPSpagnoliJJunodJPrevalence of frailty in middle-aged and older community-dwelling Europeans living in 10 countriesJ Gerontol A Biol Sci Med Sci200964667568119276189
- MitnitskiABMogilnerAJRockwoodKAccumulation of deficits as a proxy measure of agingScientificWorldJournal2001132333612806071
- Gómez RamosMJGonzález ValverdeFMSánchez AlvarezCNutritional status of an hospitalised aged populationNutr Hosp200520428629216045131
- GuigozYThe Mini Nutritional Assessment (MNA) review of the literature – what does it tell us?J Nutr Health Aging200610646648517183419
- GentileSLacroixODurandACMalnutrition: a highly predictive risk factor of short-term mortality in elderly presenting to the emergency departmentJ Nutr Health Aging201317429029423538647
- LimSLOngKCChanYHLokeWCFergusonMDanielsLMalnutrition and its impact on cost of hospitalization, length of stay, readmission and 3-year mortalityClin Nutr201231334535022122869
- LugerEHaiderSKapanASchindlerKLackingerCDornerTEAssociation between nutritional status and quality of life in (Pre) frail community-dwelling older personsJ Frailty Aging20165314114829239581
- LaurCVMcNichollTValaitisRKellerHHMalnutrition or frailty? Overlap and evidence gaps in the diagnosis and treatment of frailty and malnutritionAppl Physiol Nutr Metab201742544945828322060
- KimJLeeYWonCWLeeKEChonDNutritional status and frailty in community-dwelling older Korean adults: the Korean frailty and aging cohort studyJ Nutr Health Aging201822777477830080218
- ChyeLWeiKNyuntMSZGaoQWeeSLNgTPStrong relationship between malnutrition and cognitive frailty in the singapore longitudinal ageing studies (SLAS-1 and SLAS-2)J Prev Alzheimers Dis20185214214829616708
- MahoneyFIBarthelDWFunctional evaluation: the Barthel indexMd State Med J1965146165
- LawtonMPBrodyEMAssessment of older people: self-maintaining and instrumental activities of daily livingGerontologist1969931791865349366
- LoboAEzquerraJGómez BurgadaFSalaJMSeva DíazACognocitive mini-test (a simple practical test to detect intellectual changes in medical patients)Actas Luso Esp Neurol Psiquiatr Cienc Afines197973189202474231
- RubensteinLZHarkerJOSalvàAGuigozYVellasBScreening for undernutrition in geriatric practice: developing the short-form mini-nutritional assessment (MNA-SF)J Gerontol A Biol Sci Med Sci2001566M366M37211382797
- TinettiMEBakerDIMcAvayGA multifactorial intervention to reduce the risk of falling among elderly people living in the communityN Engl J Med1994331138218278078528
- LilamandMKelaiditiECesariMValidation of the mini nutritional assessment-short form in a population of frail elders without disability. Analysis of the toulouse frailty platform population in 2013J Nutr Health Aging201519557057425923488
- ViktilKKBlixHSMogerTAReikvamAPolypharmacy as commonly defined is an indicator of limited value in the assessment of drug-related problemsBr J Clin Pharmacol200763218719516939529
- DokuzlarOSoysalPIsikATAssociation between serum vitamin B12 level and frailty in older adultsNorth Clin Istanb201741222828752139
- EyigorSKutsalYGDuranEFrailty prevalence and related factors in the older adult-FrailTURK ProjectAge (Dordr)2015373979125948502
- de JongNChinAPawMJde GrootLCde GraafCKokFJvan StaverenWAFunctional biochemical and nutrient indices in frail elderly people are partly affected by dietary supplements but not by exerciseJ Nutr1999129112028203610539780
- SleeABirchDStokoeDThe relationship between malnutrition risk and clinical outcomes in a cohort of frail older hospital patientsClin Nutr ESPEN201615576228531785
- SoysalPIsikATArikFKalanUEyvazAVeroneseNValidity of the mini-nutritional assessment scale for evaluating frailty status in older adultsJ Am Med Dir Assoc Epub2018924
- BartaliBFrongilloEABandinelliSLow nutrient intake is an essential component of frailty in older personsJ Gerontol A Biol Sci Med Sci200661658959316799141
- RahiBColombetZGonzalez-Colaço HarmandMHigher protein but not energy intake is associated with a lower prevalence of frailty among community-dwelling older adults in the French three-city cohortJ Am Med Dir Assoc2016177672.e7672.e11
- KobayashiSSugaHSasakiSThree-generation Study of Women on Diets and Health Study GroupDiet with a combination of high protein and high total antioxidant capacity is strongly associated with low prevalence of frailty among old Japanese women: a multicenter cross-sectional studyNutr J20171612928499379
- Porter StarrKNPieperCFOrenduffMCImproved function with enhanced protein intake per meal: a pilot study of weight reduction in frail, obese older adultsJ Gerontol A Biol Sci Med Sci201671101369137526786203
- Ates BulutESoysalPAydinAEDokuzlarOKocyigitSEIsikATVitamin B12 deficiency might be related to sarcopenia in older adultsExp Gerontol20179513614028549839