
Abstract
Background
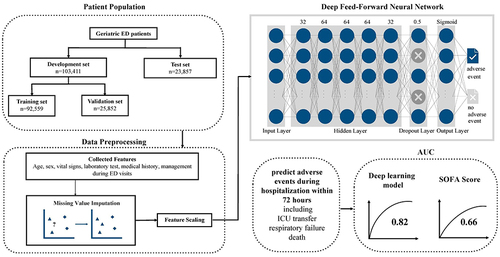
The global aging population presents a significant challenge, with older adults experiencing declining physical and cognitive abilities and increased vulnerability to chronic diseases and adverse health outcomes. This study aims to develop an interpretable deep learning (DL) model to predict adverse events in geriatric patients within 72 hours of hospitalization.
Methods
The study used retrospective data (2017–2020) from a major medical center in Taiwan. It included non-trauma geriatric patients who visited the emergency department and were admitted to the general ward. Data preprocessing involved collecting prognostic factors like vital signs, lab results, medical history, and clinical management. A deep feedforward neural network was developed, and performance was evaluated using accuracy, sensitivity, specificity, positive predictive value (PPV), and area under the receiver operating characteristic curve (AUC). Model interpretation utilized the Shapley Additive Explanation (SHAP) technique.
Results
The analysis included 127,268 patients, with 2.6% experiencing imminent intensive care unit transfer, respiratory failure, or death during hospitalization. The DL model achieved AUCs of 0.86 and 0.84 in the validation and test sets, respectively, outperforming the Sequential Organ Failure Assessment (SOFA) score. Sensitivity and specificity values ranged from 0.79 to 0.81. The SHAP technique provided insights into feature importance and interactions.
Conclusion
The developed DL model demonstrated high accuracy in predicting serious adverse events in geriatric patients within 72 hours of hospitalization. It outperformed the SOFA score and provided valuable insights into the model’s decision-making process.
Graphical Abstract
Introduction
The aging of the population presents a significant global challenge recognized by many countries. According to the United Nations, the proportion of people aged 65 and older is projected to increase from 9% in 2021 to 16% by 2050. This demographic shift will mark the first time in history that the number of older adults exceeds that of children under the age of 5.Citation1 As individuals age, their physical and cognitive abilities decline, rendering them more susceptible to chronic diseases and adverse health outcomes. Chronic diseases are particularly prevalent in older adults, leading to a gradual decline in physical function, quality of life, and an increased risk of complications and mortality.Citation2 Managing chronic conditions necessitates ongoing medical care and support, resulting in substantial care burdens and expenses. For example, in the United States, Medicare spending on individuals aged 65 and older reached $702 billion in 2019, constituting 21% of total national health expenditures.Citation3
The Charlson Comorbidity Index (CCI), Acute Physiology and Chronic Health Evaluation (APACHE) II, and Sequential Organ Failure Assessment (SOFA) score are commonly used to predict mortality risk in hospitalized patients. CCI is a widely used comorbidity index that assigns weights to medical conditions based on their association with mortality, while APACHE II evaluates patients’ acute and chronic health status using physiological variables and comorbidities.Citation4,Citation5 SOFA score assesses the extent of organ dysfunction in critically ill patients.Citation6,Citation7 However, none of these scores are specifically designed for older adults and do not account for the unique physiological changes and comorbidities associated with aging. Although these scores have been shown to be reliable predictors of mortality risk in various patient populations, they do not consider age-related physiological changes, which may affect the accuracy of mortality predictions in older adults. Due to the wide range of age-related physiological changes and the presence of comorbidities in individuals, the sensitivity of single-point vital sign measurements in detecting disease processes is reduced.Citation8,Citation9 Therefore, while these scores are useful in predicting mortality risk in hospitalized patients, they may not be as accurate in predicting mortality risk in older adults.
Artificial intelligence (AI) has become a powerful tool in various areas of healthcare, including clinical diagnosis, treatment recommendations, and predicting health outcomes and mortality. For instance, AI models have been used to predict outcomes in trauma patients,Citation10 neurological outcomes of out-of-hospital cardiac arrest patients,Citation11 mortality after ST-segment elevation myocardial infarction.Citation12 Research has shown the efficacy of deep learning (DL) algorithms in detecting infectious diseases and predicting prognosis in critical medical conditions, such as the detection of monkeypox from skin lesion images,Citation13,Citation14 and the prediction of prognosis for COVID-19 using clinical markers.Citation15 In terms of early in-hospital mortality prediction, Awad et al demonstrated the prediction of early hospital mortality of intensive care unit patients using an ensemble learning approach.Citation16 Furthermore, Cheng et al discovered that by analyzing dynamic vital sign data, machine learning (ML) models such as convolutional neural networks (CNNs), long short-term memory, and random forest can predict mortality in septic patients within 6–48 hours of admission.Citation17
Many existing models are tailored to patients who require urgent critical care, and they may not be suitable for those admitted to general wards. It is crucial to acknowledge that patients who experience adverse events during their hospital stay, despite not being initially admitted to the intensive care unit, can cause significant distress and burden for families and medical professionals. Hence, it is vital to identify individuals who may be at risk of deteriorating during their hospitalization to mitigate potential negative outcomes. Additionally, while some studies have included older patients in their analysis, few studies have specifically focused on this population. As older adults are more likely to experience adverse health outcomes and have different physiological characteristics than younger patients, there is a growing need for ML models tailored to this population.
Given that existing mortality prediction scores, such as CCI, APACHE II, and SOFA, lack specificity for older adults, overlooking age-related physiological changes and comorbidities, which reduces the accuracy of mortality predictions in this population, and that current AI models are predominantly designed for urgent critical care patients, neglecting the unique needs of older adults admitted to general wards, there is a significant research gap in developing tailored predictive models for this demographic. Therefore, this study aims to develop an interpretable DL model that can predict serious adverse events including imminent intensive care unit (ICU) transfer, respiratory failure, or death during hospitalization within 72 hours for geriatric patients.
Method
Study Setting and Population
This study was a retrospective analysis carried out at a major medical center in Taiwan, during the period spanning 1 January 2017 to 31 December 2020. The medical center is considered one of the largest in the region, with an annual volume of over 12,000 emergency department (ED) visits and 3500 ward beds. The study obtained approval from the institutional review board of Chang Gung Memorial Hospital (IRB: 202100691B0 and 202201500B0) and adhered to the Code of Ethics of the World Medical Association (Declaration of Helsinki).
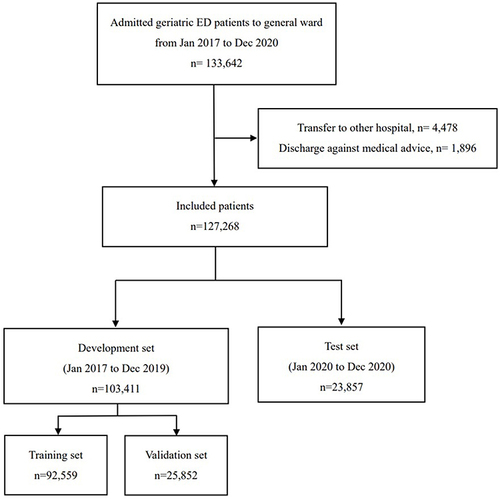
The study recruited non-trauma patients who were 65 years or older and visited the emergency department during the study period, and subsequently admitted to the general ward. Patients who were discharged against medical advice or transferred to other hospitals were excluded from the analysis. To ensure that the model’s usefulness in real-world situations, all patients were divided into development and test sets based on the index dates of their emergency department visits. Data with index dates up to December 31, 2019, were used for model development, while data with index dates after that date were set aside for testing. The flowchart was deciphered in .
Figure 1 Patient inclusion flow chart and the development of the deep learning model.
Data Preprocessing
Various factors associated with prognosis in previous research were gathered.Citation16,Citation18 These included age, sex, vital signs, laboratory test results, medical history, and management during ED visits. Vital signs such as heart rate (HR), systolic blood pressure (SBP), diastolic blood pressure (DBP), body temperature (BT), and Glasgow coma scale score (GCS) were recorded at both ED triage and hospital admission. Additionally, the shock index (SI) was calculated.Citation19 Laboratory data, including complete blood count, differential white blood cell count, and C-reactive protein level, were also collected. Other biochemical tests like renal and liver function and electrolyte levels were included. Patients past medical history, such as hypertension, diabetes mellitus, malignancy, coronary artery disease, liver cirrhosis, and chronic kidney disease, were also collected. The data on the clinical management during ED, including the administration of fluid challenge, oxygen therapy, and inotropic agents, were also documented as they could provide insights into the patient’s condition severity. If the measurement was taken during ED triage, “_a” will be added at the end; if the measurement was taken when the patient left the emergency department to ward admission, “_e” will be added at the end. For example, for systolic blood pressure, SBP_a refers to the measurement taken during ED triage, while SBP_e refers to the measurement taken when the patient left the emergency department to ward admission. The outcome was the occurrence of serious adverse events while hospitalized within 72 hours, including cardiac arrests, mechanical ventilation, and intensive care unit ICU transfers.
To handle missing values, we utilized the MissForest algorithm, which is a nonparametric approach specifically designed for imputing missing values in mixed-type data.Citation20 This Method can impute both continuous and categorical data, while also accounting for complex interactions and nonlinear relationships. A notable advantage of the MissForest algorithm is its ability to provide an out-of-bag imputation error estimate, which allows for the evaluation of imputation performance. By using this approach, we were able to obtain accurate imputation results that improved data quality and reduced the impact of missing values on subsequent analyses.
When training a model, differences in the scales of input variables can create challenges in developing the network, especially in the case of neural networks. This is because large input values (eg, SBP) may lead to the learning of large weight values in comparison to small input values (eg, percentage of band neutrophils) or categorical values (eg, hypertension), potentially affecting model performance. We applied a feature scaling process to all selected features prior to their input into the deep learning (DL) model. To standardize this process, we employed a method that subtracts the mean and divides by the standard deviation of each data point’s feature value.
Model Development and Test
The present study involved the development of a deep feedforward neural network to predict the occurrence of adverse events among the patients included in the analysis. In order to address the issue of data imbalance, class weights were set based on the population size of positive and negative patients during the training process. The data in the development set were divided in a 3:1 ratio into the training and validation sets. After preparing the input data, grid search was utilized to determine the optimal hyperparameter values. Various hyperparameters were fine-tuned to achieve optimal performance. Subsequently, a feed-forward neural network model was constructed, comprising four hidden layers. Initially, a dense layer with 32 neurons and rectified linear unit (ReLU) activation function was added, with the input dimension determined by the number of features in the training data. Three additional dense layers were then added, each consisting of 64 neurons and ReLU activation function. Following the last hidden layer, a dropout layer with a dropout rate of 0.5 was included, aiming to prevent overfitting by randomly dropping a fraction of input units during training. Lastly, a dense layer with 1 neuron and sigmoid activation function was appended for binary classification. The AdamW algorithm was selected as the optimizer, initializing with a learning rate of 0.0002. Training employed the binary cross-entropy loss function, spanning 500 epochs with a batch size of 256. The best weight configuration, minimizing loss in the validation set across all epochs, was retained.
The model’s performance was evaluated by assessing its accuracy, sensitivity, specificity, positive predictive value (PPV), and area under the receiver operating characteristic curve (AUC). Additionally, the model’s performance was compared to that of the conventional scoring system, the SOFA score, based on AUC. The SOFA score is a reliable tool for predicting the outcome of critically ill patients. It evaluates the patient’s organ function based on scores assigned for six different systems: respiratory, coagulation, hepatic, cardiovascular, renal, and neurologic. A higher SOFA score indicates a greater risk of mortality.Citation7
Model Explanation
Shapley Additive Explanation (SHAP) is an interpretable ML technique that explains the Contributions of each feature in a model’s prediction. It is based on Shapley values, which is a concept from cooperative game theory. SHAP provides a unified measure of feature importance that is based on a model’s learned behavior and its structure. It allows for the evaluation of each feature’s contribution to the model’s prediction, resulting in a better understanding of the model’s decision-making process. SHAP also enables the identification of interactions between features, and how these interactions affect the model’s output.
SHAP has significant benefits for ML, including increasing the transparency of black-box models and improving the interpretability of results. This can lead to more accurate and informed decision-making, increased trust in the model, and better communication with stakeholders. SHAP can also help in feature engineering and selection, reducing the number of features required for model performance, and improving computational efficiency.Citation21,Citation22
Statistical Analysis
When presenting continuous data that followed a normal distribution, the mean and standard deviation (SD) were used, while for non-normally distributed continuous data, the median with the 25th and 75th percentiles were reported. To compare the distribution of continuous variables, statistical tests such as the independent t-test or Mann–Whitney test were utilized. The chi-square test for independence was used to compare categorical variables. Statistical significance was defined as having a two-sided p-value of less than 0.001. Model development and all statistical analyses were performed using Python 3.9 and TensorFlow 2.1 on the Google Colab platform.
Result
Analysis of the Enrolled Patients
This study involved 127,268 patients, with 103,411 and 23,857 patients allocated to the development and test sets, respectively. In the development set, the patients had a mean age of 78.5 ± 7.87 years, while in the test set, the patients had a similar mean age of 78.5 ± 7.97 years. Among all patients, 3337 (2.6%) experienced adverse events while hospitalized, including 302 (0.2%) cardiac arrests, 2945 (2.3%) cases of mechanical ventilation, and 3100 (2.4%) ICU transfers. Demographic and outcome data for both development and test sets can be found in .
Table 1 Characteristics of Patients in Development and Test Data Set
Further investigation was conducted to explore the clinical features that were linked to unfavorable Results. The data revealed that advanced age was linked to unfavorable results, with patients who suffered adverse events having an average age of 79.5 ± 7.95 years compared to 78.4 ± 7.88 years for those who did not (p<0.001). Among the vital signs, all except DBP_a were associated with unfavorable results. Patients who experienced adverse effects showed tachycardia, higher shock index (SI), and lower GCS scores at both triage and hospital admission (see ).
Table 2 Clinical Features Associated with Adverse Event During Admission
In addition, higher levels of white blood cell (WBC) count (10.4 ± 8.5 vs 12.1 ± 10.0, p<0.001), higher band neutrophil (0.42 ± 1.86 vs 0.87 ± 2.88, p<0.001), lower hemoglobin (Hb) levels (11.3 ± 2.3 vs 11.1 ± 2.4, p<0.001), higher blood sugar (164.8 ± 84.5 vs 176.4 ± 92.7.9, p<0.001), higher aspartate aminotransferase (AST) levels (32.0 ± 125.9 vs 39.7 ± 201.6, p=0.029), higher creatinine levels (1.81 ± 1.88 vs 1.96 ± 1.94, p<0.001), higher C-reactive protein (CRP) levels (61.6 ± 64.8 vs 79.0 ± 79.6, p<0.001), and lower albumin levels (4.2 ± 0.42 vs 4.1 ± 0.48, p<0.001) were associated with unfavorable results.
Furthermore, the particular treatments that were administered during ED management, such as oxygen support (52,107 (42.0%) vs 2262 (67.8%), p<0.001), fluid challenge (16,014 (12.9%) vs 718 (21.5%), p<0.001), and inotropic agent use (1905 (1.5) vs 176 (5.3), p<0.001), were all related to unfavorable results since they reflect the clinical severity. Additional findings collected during the study are shown in .
Model Performance
Initially, the predictive capability of the model was evaluated by assessing its AUC in the validation and test sets, and comparing it to that of the commonly used statistical model, the SOFA score (as depicted in ). The AUCs for predicting serious adverse outcomes in the validation and test sets were 0.86 and 0.84, respectively, although the performance marginally declined in the test set. In contrast, the SOFA score exhibited inferior predictive performance, with an AUC of 0.66 in the test set when compared to the DL model.
Figure 2 The Receiver Operating Characteristic (ROC) curve of model prediction.
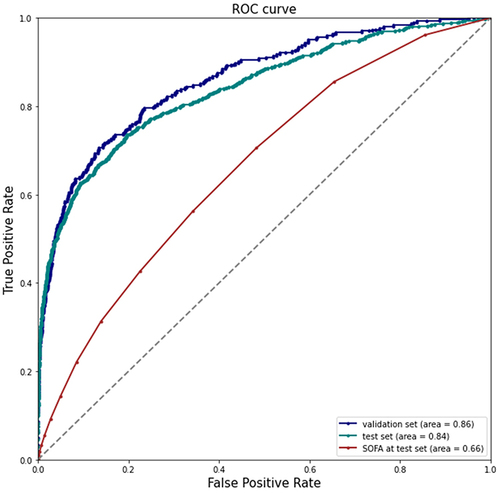
During the validation phase, the DL model exhibited sensitivity and specificity values of 0.81 each, with its PPV recorded at 0.25. Moving on to the test phase, the model maintained a sensitivity of 0.79 and specificity of 0.80, while experiencing a slight decrease in PPV to 0.22.
Model Interpretation by SHAP Value
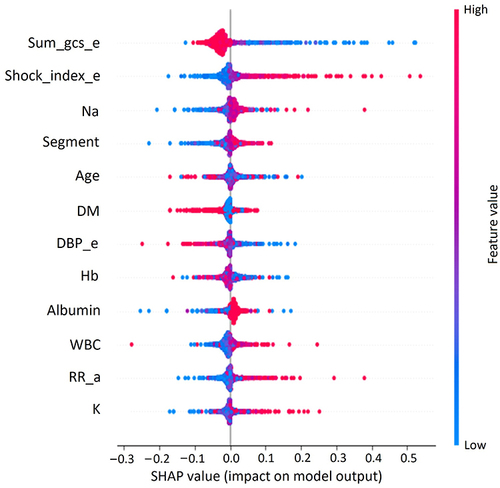
To interpret the model, the SHAP value was employed to extract weights from the last layer of the neural network and determine the significance of the features in making predictions. The list of the 10 most important features, ranked in descending order, were: GCS_e, SI_e, sodium (Na), segment, age, DM, DBP_e, Hb, Albumin, RR_a, and potassium (K) (). Apart from determining the ranking of feature importance, the correlation between each feature and its effect on the model output was also interpreted. Each dot in represents a data point from the test set, where the color of the dot corresponds to its value. The shades of red indicate higher values, while the shades of blue indicate lower values. The model predicted a higher likelihood of adverse events in cases with lower GCS_e scores, as well as higher SI_e, higher Na level, and so on.
Figure 3 Global Explanation of feature importance by SHapley Additive exPlanations (SHAP) value. Sum_gcs_e: The sum of the Glasgow Coma Scale scores when the patient left the emergency department to ward admission. Shock_index_e: Shock index (dividing the heart rate by the systolic blood pressure) when the patient left the emergency department to ward admission.
Discussion
The current study introduces an interpretable neural network model specifically designed for predicting the occurrence of in-hospital adverse events within 72 hours of admission to the ward among geriatric patients. The DL model demonstrates a high level of precision, achieving an AUC of 0.86 in the validation set and 0.82 in the test set. These impressive results highlight the model’s effectiveness in accurately forecasting adverse events during the crucial initial period of a geriatric patient’s hospitalization.
Many prior studies have utilized ML algorithms to predict adverse outcomes and in-hospital mortality. However, the majority of these studies have primarily concentrated on geriatric patients who were already admitted to the ICU. Using the extreme gradient boosting (XGBoost) model, Liu’s study demonstrated an AUC ranging from 0.83 to 0.85 for mortality prediction in older patients with multiple organ dysfunction syndrome who were admitted to ICU.Citation23 Ke et al discovered that the XGBoost framework provides good in-hospital mortality prediction for septic older patients with an AUROC of 0.871. The XGBoost model outperformed the other models, including light gradient boosting machine (LGBM), decision tree (DT), K Nearest Neighbor, logistic regression (LR), and random forest (RF) algorithms.Citation24 However, Ke’s study included only septic patients with a length of stay in the ICU longer than 24 hours, and the primary endpoint was in-hospital mortality. It is worth noting that ICU patients typically receive the highest level of care, and the potential for providing immediate clinical assistance in such cases may be limited. Very few studies focus on predicting the adverse event risk for the geriatric population in general wards. Silva et al demonstrated that the LR classifier achieved the best performance in predicting in-hospital mortality risk, with an AUC metric of 0.81, specifically for older individuals with community-acquired pneumonia.Citation25 Our research diverges from previous studies as we specifically target the prediction of adverse effects within a 3-day timeframe for older patients in general hospital wards. This broader approach enables us to provide timely alerts to healthcare professionals and extend the applicability of our predictions to a wider range of hospitalized older individuals. Our research allows clinical physicians to recognize deteriorating patients earlier, necessitating their transfer to the intensive care unit for proactive care. It also provides clinical healthcare providers with more time to explain subsequent changes in the patient’s condition to the family and discuss treatment directions.
We have identified several clinical indicators that are associated with an elevated risk of adverse events among geriatric patients within the first 72 hours of hospitalization. The top two key features that held the utmost importance were GCS_e and SI_e. Research conducted previously has indicated that the presence of metabolic encephalopathy in critically ill individuals holds significant prognostic implications. In the influential study conducted by Sprung et al, it was found that septic patients with impaired mental status exhibited a mortality rate of 49%, whereas those without neurological symptoms had a rate of 26%.Citation26 Eidelman et al concluded that the severity of neurological symptoms resulting from encephalopathy in ICU patients, as measured by the GCS, was closely associated with prognosis. The study revealed a mortality rate of up to 63% among patients who presented with GCS scores ranging from 3 to 8.Citation27 The SI, as indicated by previous research, exhibits associations with various physiological parameters such as cardiac index, stroke volume, left ventricular stroke index, mean arterial pressure, and acute circulatory failure. Its usefulness as a valuable tool in the ED lies in its ability to promptly identify critical illness and aid in determining appropriate patient management strategies.Citation28,Citation29 The SI provides clinicians with a rapid and reliable means to assess hemodynamic status and detect potential circulatory compromise. Its application extends beyond diagnosis, as it also shows promise in predicting patient outcomes, guiding treatment decisions, and enhance patient outcomes through timely intervention and resource allocation. Our study findings align with previous research, further substantiating the significant impact of both GCS and SI as crucial factors influencing the occurrence of adverse events.
Traditional early warning scores are recognized as playing a vital role in monitoring inpatient deterioration and enabling healthcare professionals to intervene promptly to reduce inpatient mortality rates and complications. However, a study conducted by Bedoya evaluated the impact of automated alerts using the National Early Warning Score (NEWS) in general wards among 85,322 patients (42,402 pre-NEWS implementation and 42,920 post-NEWS implementation). The results indicated that the primary outcome, which was the rate of ICU transfer or mortality, did not change significantly after the implementation of the NEWS automated alert system.Citation30 On the other hand, Escobar et al’s study demonstrated a significant reduction in inpatient mortality through the implementation of a deterioration alert system derived from statistical analysis.Citation31 However, this system required additional nursing staff to remotely monitor and manually review the records of identified high-risk patients. Such reliance on extra personnel may pose challenges, especially for hospitals lacking the resources or capacity to allocate dedicated staff for patient dashboard monitoring. In contrast, Bassin’s research indicated that implementing ML models in one hospital in Australia was associated with improved patient outcomes, including reduced all-cause mortality, ICU admissions, or medical emergency team activations.Citation32 Similarly, our proposed DL model offers a solution by providing real-time predictions and a user-friendly interface, thereby eliminating the need for advanced programming skills among healthcare professionals. This system has the potential to significantly enhance the management and care of elderly patients residing in general wards, while also serving as a valuable gatekeeping system. It enables clinicians to identify patients who may require additional care and attention.
It is important to acknowledge the limitations of this study and suggest areas for future research. Firstly, this study exclusively conducted internal validation and did not perform external validation. Nevertheless, it’s worth noting that the training set and test set in this study comprise different sets of patients. Second, missing values and imbalanced positive-negative sets posed significant challenges during the development and validation of the predictive model due to the nature of real-world medical data. Although these issues were properly addressed during data pre-processing, further improvements in data quality could be achieved by exploring more advanced techniques for data cleaning. Additionally, the study’s retrospective design and limited sample population from Taiwan may limit the generalizability of its findings beyond this specific context. As the study focused only on a specific population with local practices and healthcare systems, the results may not be directly applicable to other ethnic groups or regions with different healthcare practices. Future research should prioritize conducting external validation to assess the generalizability and robustness of the predictive model across diverse patient populations and healthcare settings. Studies involving larger and more diverse populations, encompassing various ethnic groups and healthcare systems, would contribute to a deeper understanding of the predictive capabilities of the model across different contexts. Additionally, conducting prospective studies would allow for the validation of the predictive model in real-time clinical settings, offering valuable insights into its practical utility and effectiveness in guiding clinical decision-making.
Conclusion
Our proposed deep learning model can effectively predict in-hospital serious adverse events among geriatric patients with satisfactory reliability. The model has the potential to serve as a valuable gatekeeping system, enabling clinicians to identify patients who may require additional care and attention before being admitted to a general ward. Additionally, the use of SHAP value explanations can aid clinicians in understanding the model’s predictions and increase their confidence in the system.
Ethics Approval and Consent to Participate
This study was approved by the Institutional Review Board of the Chang Gung Medical Foundation (IRB number: 202100691B0 and 202201500B0). Given that the patient data utilized in the analysis was anonymized and de-identified, the ethics committee granted a waiver for informed consent.
Author Contributions
Chi-Yung Cheng and Chao-Jui Li are co‐corresponding authors. All authors made a significant contribution to the work reported, whether that is in the conception, study design, execution, acquisition of data, analysis and interpretation, or in all these areas; took part in drafting, revising or critically reviewing the article; gave final approval of the version to be published; have agreed on the journal to which the article has been submitted; and agree to be accountable for all aspects of the work.
Disclosure
The authors declare that they have no competing interests.
Acknowledgments
We appreciated the Biostatistics Center, Kaohsiung Chang Gung Memorial Hospital for statistics work.
Data Sharing Statement
The datasets used and/or analyzed during the current study are available from the corresponding author upon reasonable request.
Additional information
Funding
References
- United Nations, Department of Economic and Social Affairs, Population Division. World Population Ageing 2020 Highlights. New York: United Nations; 2021.
- Fulop T, Larbi A, Witkowski JM, et al. Aging, frailty and age-related diseases. Biogerontology. 2010;11:547–563. doi:10.1007/s10522-010-9287-2
- Centers for Medicare & Medicaid Services. National health expenditure data; 2021. Available from: https://www.cms.gov/Research-Statistics-Data-and-Systems/Statistics-Trends-and-Reports/NationalHealthExpendData/NationalHealthAccountsHistorical. Accessed June 4, 2024.
- Charlson ME, Pompei P, Ales KL, MacKenzie CR. A new method of classifying prognostic comorbidity in longitudinal studies: development and validation. J Chronic Dis. 1987;40:373–383. doi:10.1016/0021-9681(87)90171-8
- Knaus WA, Draper EA, Wagner DP, Zimmerman JE. APACHE II: a severity of disease classification system. Crit Care Med. 1985;13:818–829. PMID: 3928249.
- Vincent JL, Moreno R, Takala J, et al. The SOFA (Sepsis-related Organ Failure Assessment) score to describe organ dysfunction/failure. On behalf of the Working Group on Sepsis-Related Problems of the European Society of Intensive Care Medicine. Intensive Care Med. 1996;22:707–710. doi:10.1007/BF01709751
- Vincent JL, Moreno R, Takala J, et al. Serial evaluation of the SOFA score to predict outcome in critically ill patients. JAMA. 2001;286(14):1754–1758. doi:10.1001/jama.286.14.1754
- Chester JG, Rudolph JL. Vital signs in older patients: age-related changes. J Am Med Dir Assoc. 2011;12:337–343. doi:10.1016/j.jamda.2010.04.009
- Cheng HH, Chen FC, Change MW, et al. Difference between elderly and non-elderly patients in using serum lactate level to predict mortality caused by sepsis in the emergency department. Medicine. 2018;97(e0209). doi:10.1097/MD.0000000000010209
- Liu NT, Salinas J. Machine Learning for Predicting Outcomes in Trauma. Shock. 2017;48:504–510. doi:10.1097/SHK.0000000000000898
- Cheng CY, Chiu IM, Zeng WH, et al. Machine Learning Models For Survival And Neurological Outcome Prediction Of Out-Of-Hospital Cardiac Arrest Patients. Biomed Res. Int. 2021:9590131. doi:10.1155/2021/9590131
- Cheng CY, Chiu IM, Lin CHR, et al. Stepwise regression machine learning models for in-hospital mortality prediction in patients after ST-segment slevation myocardial infarction (STEMI). In: Proceedings of the 2022 IEEE/ACIS 23rd International Conference on Software Engineering, Artificial Intelligence, Networking and Parallel/Distributed Computing (SNPD); 2022:14–18. DOI: 10.1109/SNPD54884.2022.10051815.
- Nayak T, Chadaga K, Sampathila N, et al. Deep learning based detection of monkeypox virus using skin lesion images. Med Nov Technol Dev. 2023;18:100243. doi:10.1016/j.medntd.2023.100243
- Nayak T, Chadaga K, Sampathila N, et al. Detection of Monkeypox from skin lesion images using deep learning networks and explainable artificial intelligence. Appl Math Sci Eng. 2023;31. doi:10.1080/27690911.2023.2225698
- Chadaga K, Prabhu S, Sampathila N, et al. Explainable artificial intelligence approaches for COVID-19 prognosis prediction using clinical markers. Sci Rep. 2024;14:1783. doi:10.1038/s41598-024-52428-2
- Awad A, Bader-El-Den M, McNicholas J, Briggs J. Early hospital mortality prediction of intensive care unit patients using an ensemble learning approach. Int J Med Inform. 2017;108:185–195. doi:10.1016/j.ijmedinf.2017.10.002
- Cheng CY, Kung CT, Chen FC, et al. Machine learning models for predicting in-hospital mortality in patient with sepsis: analysis of vital sign dynamics. Front Med. 2022;9:964667. doi:10.3389/fmed.2022.964667
- McCoy A, Das R. Reducing patient mortality, length of stay and readmissions through machine learning-based sepsis prediction in the emergency department, intensive care unit and hospital floor units. BMJ Open Qual. 2017;6:e000158. doi:10.1136/bmjoq-2017-000158
- Rady MY, Smithline HA, Blake H, Nowak R, Rivers E. A comparison of the shock index and conventional vital signs to identify acute, critical illness in the emergency department. Ann Emerg Med. 1994;24:685–690. doi:10.1016/s0196-0644(94)70279-9
- Stekhoven DJ, Buhlmann P. MissForest--non-parametric missing value imputation for mixed-type data. Bioinformatics. 2012;28:112–118. doi:10.1093/bioinformatics/btr597
- Lundberg SM, Lee SI. A unified approach to interpreting model predictions. Adv Neural Inf Process Syst. 2017;4765–4774. doi:10.48550/arXiv.1705.07874
- Lundberg SM, Erion G, Lee SI. Consistent individualized feature attribution for tree ensembles. arXiv preprint arXiv:1802 03888. 2018. doi:10.48550/arXiv.1802.03888
- Liu X, Hu P, Mao Z, et al. Interpretable machine learning model for early prediction of mortality in elderly patients with multiple organ dysfunction syndrome (MODS): a multicenter retrospective study and cross validation. ArXiv abs/2001 10977. 2020. doi:10.48550/arXiv.2001.10977
- Ke X, Zhang F, Huang G, Wang A. Interpretable machine learning to optimize early in-hospital mortality prediction for elderly patients with sepsis: a discovery study. Comput Math Methods Med. 2022;4820464. doi:10.1155/2022/4820464
- Silva V, Fernandes D, Rêgo A Predicting mortality risk among elderly inpatients with pneumonia: a machine learning approach. In Proceedings of the 24th International Conference on Enterprise Information Systems (ICEIS); 2022:344–354. DOI: 10.5220/0011043300003179.
- L. SC, N. PP, H. SC, et al. Impact of encephalopathy on mortality in the sepsis syndrome. Crit Care Med. 1990;18:801–806. doi:10.1097/00003246-199008000-00001
- Eidelman LA, Putterman D, Putterman C, Sprung CL. The spectrum of septic encephalopathy: definitions, etiologies, and mortalities. J Am Med Assoc. 1996;275:470–473. PMID: 8627969.
- Huang KC, Yang Y, Li CJ, et al. Shock index, pediatric age-adjusted predicts morbidity and mortality in children admitted to the intensive care unit. Front Pediatr. 2021;9:727466. doi:10.3389/fped.2021.727466
- Chung JY, Hsu CC, Chen JH, et al. Shock index predicted mortality in geriatric patients with influenza in the emergency department. Am J Emerg Med. 2019;37:391–394. doi:10.1016/j.ajem.2018.05.059
- Bedoya AD, Clement ME, Phelan M, Steorts RC, O’Brien C, Goldstein BA. Minimal impact of implemented early warning score and best practice alert for patient deterioration. Crit Care Med. 2019;47:49–55. doi:10.1097/CCM.0000000000003439
- Escobar GJ, Liu VX, Schuler A, Lawson B, Greene JD, Kipnis P. Automated identification of adults at risk for in-hospital clinical deterioration. New Engl J Med. 2020;383:1951–1960. doi:10.1056/NEJMsa2001090
- Bassin L, Raubenheimer J, Bell D. The implementation of a real time early warning system using machine learning in an Australian hospital to improve patient outcomes. Resuscitation. 2023;188:109821. doi:10.1016/j.resuscitation.2023.109821