
Abstract
Objective
The goal of the Asian Pharmacoepidemiology Network is to study the effectiveness and safety of medications commonly used in Asia using databases from individual Asian countries. An efficient infrastructure to support multinational pharmacoepidemiologic studies is critical to this effort.
Study design and setting
We converted data from the Japan Medical Data Center database, Taiwan’s National Health Insurance Research Database, Hong Kong’s Clinical Data Analysis and Reporting System, South Korea’s Ajou University School of Medicine database, and the US Medicare 5% sample to the Observational Medical Outcome Partnership common data model (CDM).
Results
We completed and documented the process for the CDM conversion. The coordinating center and participating sites reviewed the documents and refined the conversions based on the comments. The time required to convert data to the CDM varied widely across sites and included conversion to standard terminology codes and refinements of the conversion based on reviews. We mapped 97.2%, 86.7%, 92.6%, and 80.1% of domestic drug codes from the USA, Taiwan, Hong Kong, and Korea to RxNorm, respectively. The mapping rate from Japanese domestic drug codes to RxNorm (70.7%) was lower than from other countries, and we mapped remaining unmapped drugs to Anatomical Therapeutic Chemical Classification System codes. Because the native databases used international procedure coding systems for which mapping tables have been established, we were able to map >90% of diagnosis and procedure codes to standard terminology codes.
Conclusion
The CDM established the foundation and reinforced collaboration for multinational pharmacoepidemiologic studies in Asia. Mapping of terminology codes was the greatest challenge, because of differences in health systems, cultures, and coding systems.
Introduction
Multinational pharmacoepidemiologic studies provide opportunities to compare medication use and effects and to enhance collaboration across countries.Citation1 With advances in technology and informatic methods, studies using multiple databases covering a large number of patients across multiple countries have become more feasible.Citation2 Because of concerns about data privacy and related ethical issues, a distributed network approach using a common data model (CDM) is preferred. Each data site converts native databases to a common data format and performs analyses by executing common analytic programs created by a coordinating center. This approach is optimal for producing high-quality, flexible, efficient analyses while preserving data privacy.Citation2,Citation3
The Asian Pharmacoepidemiology Network (AsPEN) is the first multinational research network in Asia. It was founded in 2008 to support the conduct of multinational pharmacoepidemiologic studies in the Asia-Pacific region.Citation4 AsPEN investigators have completed several pharmacoepidemiologic studies by creating study-specific CDMs based on a common study protocol.Citation5–Citation7 However, this approach is inefficient. Therefore, the investigators collaborated with the Observational Medical Outcome Partnership (OMOP)Citation8 to initiate the Surveillance of Health Care in Asia Network (SCAN) in May 2013, which converts domestic databases in Asian countries to a global CDM to reinforce the multinational research infrastructure for future studies.Citation2
However, converting databases from Asian countries can be more challenging than converting databases from North America and Europe, because of greater differences across health care systems, cultures, and languages.Citation1 We describe the processes and quality of data extraction, transformation, and load (ETL) from participating databases to a CDM, which is the cornerstone of SCAN. We describe the unique opportunities and challenges of applying a CDM to Asian databases.
Methods
Participating countries and databases
We converted the following five health care databases to a CDM: the Japan Medical Data Center (JMDC) database, the National Health Insurance Research Database (NHIRD) from Taiwan, the Clinical Data Analysis and Reporting System (CDARS) database from Hong Kong, the Ajou University School of Medicine (AUSOM) database from South Korea, and the Medicare database from the United States.Citation2 Details of each database have been described elsewhere.Citation2 In brief, the NHIRD is a national claims’ database covering the entire population of Taiwan, from which we obtained a random sample of ~1 million subjects selected by 2005.Citation9 We included two national claims’ databases covering specific groups: the JMDC database, which covers a sample of employees and their dependents from the universal health care system in Japan, and a 5% random sample of data from the US Medicare program, which covers residents of the USA 65 years and older, younger persons with disabilities, and persons with end-stage renal disease. We included a national electronic health record, the CDARS, which covers all public hospitals and their outpatient clinics in Hong Kong. In addition, we included electronic health records from the AUSOM, which operates a tertiary teaching hospital in South Korea with 1096 patient beds and 23 operating rooms. The features of these databases are summarized in .
Table 1 Databases included in SCAN and their features
CDM
The OMOP CDM is designed to standardize format (eg, data structure) and semantics (eg, terminology codes for medical concepts and coded values) of various observational data, including health care utilization data and electronic health record data.Citation8,Citation10,Citation11 We used version 4 of the CDM, which contains 18 data tables, including a table for patient demographic characteristics and health care information, such as diagnosis, medications, and procedures. Studies of the validity of applying the CDM to observational electronic databases have been published elsewhere.Citation3,Citation8,Citation12,Citation13
Conversion of data and mapping of terminology
Each site converted its data to the CDM using published specifications.Citation8 The first step was to map all terminology codes from the domestic databases to the common terminology codes for the CDM: the RxNorm system from the US National Library of Medicine for medications;Citation14 the Systematized Nomenclature of Medicine – Clinical Terms (SNOMED-CT) from the SNOMED International for conditions and diagnoses;Citation15 and International Classification of Diseases, Ninth Revision (ICD-9) procedure codes, Current Procedural Terminology, Fourth Edition (CPT-4) codes, and Healthcare Common Procedure Coding System codes for procedures. We used Logical Observation Identifiers Names and Codes (LOINC) for observational data from the South Korean medical center.
Because most of the domestic databases used their own domestic coding systems for medications,Citation2 we mapped all domestic drug codes by using the generic name, strength, and administration dosage form of the medicinal product, with the exception of the mapping between US National Drug Codes and RxNorm, for which a mapping table was already available.Citation8,Citation14 All participating databases used ICD-9 or the International Classification of Diseases, Tenth Revision (ICD-10) for conditions. The table for mapping ICD-9 and ICD-10 codes to SNOMED-CT was created by the OMOP.Citation8,Citation14 Other terminology codes, such as patients’ demographic characteristics (eg, sex and race), were also mapped to common terminology codes (eg, HL7 Administrative Sex and CDC Race). Other terminology codes used in the CDM are described in the specifications.Citation8 The mapping tables from Observational Health Data Sciences and Informatics (OHDSI) are publicly available from the website of ATHENA standardized vocabularies at http://www.athena.ohdsi.org.
Quality assurance
The participating sites were required to record all conversion processes in ETL documents for review by the coordinating center and the sites.Citation8 The ETL documents from the five sites are included in the Supplementary materials. We analyzed the mapping rates between common terminology codes and domestic codes to assess the integrity of the data (). At least two experts from each site with both a pharmacology background and sufficient English skills for the terminology for medications reviewed the mapping manually to confirm the accuracy. In addition, we performed Observational Source Characteristics Analysis Report (OSCAR) assessments. OSCAR is a SAS program that provides structured output of descriptive statistics for all relevant tables in the converted CDM to facilitate evaluation of the quality of conversion.Citation8 The OSCARs were distributed and reviewed by the sites and the coordinating center. The details of the OSCAR assessments were publicly available.Citation8 The refinements of the conversions were based on monthly teleconferences and quality assessments; additional conference calls were also organized, if required, to identify and implement refinements and resolve issues. We locked the data after completion of the conversion and quality checks. All sites used SAS Version 9.3 (SAS Institute Inc., Cary, NC, USA) for conversion as well as the analysis.
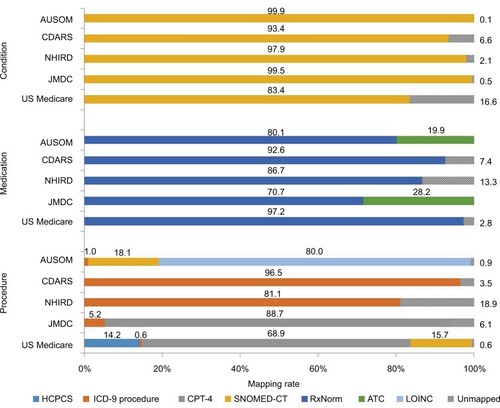
Figure 1 Rates of mapping on terminology codes.
Abbreviations: ATC, Anatomical Therapeutic Chemical; AUSOM, Ajou University School of Medicine; CDARS, Clinical Data Analysis and Reporting System; CPT-4, Current Procedural Terminology, fourth edition; HCPCS, Healthcare Common Procedure Coding System; ICD-9, International Classification of Diseases, ninth revision; JMDC, Japan Medical Data Center; LOINC, Logical Observation Identifiers Names and Codes; NHIRD, National Health Insurance Research Database; SNOMED-CT, Systematized Nomenclature of Medicine – Clinical Terms.
The study was approved by the institutional review board of each site, including the Duke University Health System (USA), the Public Health Research Foundation (Japan; # 4B0001), the National Cheng-Kung University Hospital (Taiwan; B-EX-102-003), the University of Hong Kong/Hospital Authority Hong Kong West Cluster (# UW13-504), and Ajou University (Korea; AJIRB-MED-MDB-14-078).
Results
Database conversions
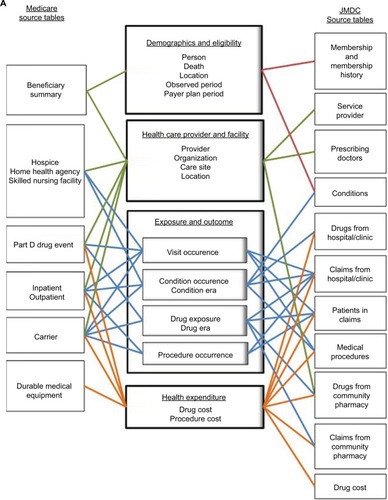
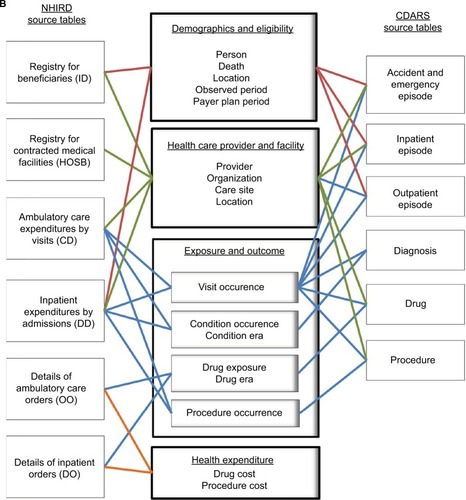
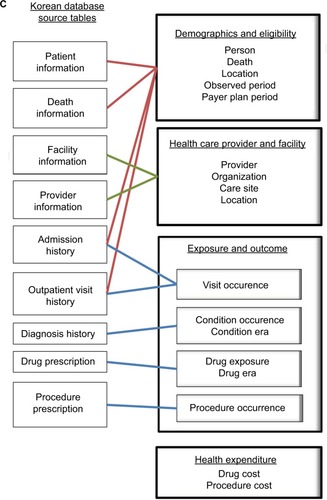
It took up to 13 months to convert the data from each site to the initial version of the CDM and ~17 months for refinements. We unlocked the data to update the conversion when code mappings were refined or updated. We recorded all of the conversion processes in the ETL documents (Supplementary materials). The coordinating center and participating sites reviewed the ETL documents and refined the conversions based on the comments. is a schematic presentation of ETL, showing which data components from the participating databases were converted to the CDM. For example, the person table in the CDM primarily contains information about patients’ demographic characteristics and was converted based on the Beneficiary Summary File of the US Medicare database, the Registry for Beneficiaries File of the NHIRD, the Membership/History File of the JMDC, and the three episode files of the CDARS (ie, Outpatient Episode, Inpatient Episode, and Accident and Emergency Episode). Taiwan and Hong Kong have single-payer national health insurance systems, and Japan has a multipayer national health insurance system that covers most of the relevant medical costs; however, the Medicare program offers diverse insurance coverage (eg, Medicare Parts A, B, and D) and medication expenses may not be covered for beneficiaries who are not enrolled in Part D. Information about eligibility categories was preserved in the payer plan periods table in the CDM ().
Figure 2 Concepts of conversion from participating databases to the common data model.
Abbreviations: Carr, carrier; CDARS, Clinical Data Analysis and Reporting System; DME, durable medical equipment; HHA, home health agency; HSP, hospice; IP, inpatient; JMDC, Japan Medical Data Center; NHIRD, National Health Insurance Research Database; OP, outpatient; PDE, part D drug event; SNF, skilled nursing facility.
Quality assurance
Conversion to the CDM did not materially affect the integrity of the data (refer to the Supplementary materials, which includes a snapshot of the interactive software that visualized the descriptive statistics by OSCAR to facilitate the review process), as the characteristics of the converted data were similar to the characteristics of the domestic databases.
The mapping rates for the condition codes were very high (). We mapped ~83.4%, 97.9%, and 93.4% of ICD-9 codes in the Medicare, NHIRD, and CDARS databases to SNOMED-CT, respectively. The mapping rates from ICD-10 in the JMDC and AUSOM databases to SNOMED-CT were 99.5% and 99.9%, respectively. The mapping rates for the medication codes were also robust; we mapped 97.2% of US, 86.7% of Taiwanese, and 80.1% of Korean domestic drug codes to RxNorm. The mapping rate from Japanese national drug codes to RxNorm was relatively lower than other countries (70.7%); we mapped the remaining medications to Anatomical Therapeutic Chemical (ATC) Classification System codes (28.2%). The mapping rate of Hong Kong’s domestic drug codes was only 55.1%. We further broke down the combination products to the ingredient level for this conversion, and the mapping improved to 92.6%. The mapping rates for demographic characteristics were 100% for all databases.
Discussion
A distributed network approach with a CDM protects data confidentiality and facilitates the standardization, efficiency, and quality of analyses across data sources from multiple Asian sites conforming to high scientific standards.Citation1,Citation2 Although several databases are currently available in Asian countries, they have different structures and formats and use different terminology codes.Citation2 As a result, the SCAN objective to convert data to a CDM is at the foundation of multinational pharmacoepidemiologic studies and reinforces the pharmacoepidemiology and pharmacovigilance system in Asian countries.Citation2 We discuss major challenges in Asian databases and possible solutions, including the format (eg, data structure) and content (eg, vocabularies) of conversion. We also discuss the opportunities provided by SCAN and the CDM for improving pharmacoepidemiology in Asian countries.
Challenges: preparations of the databases
This is a multinational collaborative study involving five institutions in Asia and the USA. Effective communication is the foundation of a successful collaboration. However, while we very much enjoyed and learned from our collaboration, effective and timely communication was also challenging because of differences in language, time, culture, research environments, and health care systems among countries. We spent a total of 30 months on the project, and substantial efforts and time were spent on understanding the nature of the involved databases, particularly the capability and population coverage of each database, and local health care system and clinical practices. In a few countries where there was a data access constraint, it was very time consuming to retrieve data from the source data warehouse before the mapping could be carried out. Data privacy was also a significant issue in Asia. The study of the databases had to be reviewed by the institutional review board from each site, and we encountered serious concerns about potential data disclosures outside the country.
Challenges: conversions to the CDM
The CDM accommodated storage of source data for analytical needs, with the exception of medical cost and expenditure data. Challenges with cost and expenditure data resulted from the diversity of health systems across countries. For example, Taiwan, Hong Kong, and Korea have single-payer systems; Japan has multiple payers in its national health insurance system; and the USA has diverse coverage in its Medicare program. These differences made conversion of tables for health expenditures complicated. Cross-national comparisons of health expenditures must also account for currency conversions and adjustments to the consumer price index. In addition, different insurance systems cover different health care items and medical products, making information about total payments relatively uninformative.Citation2 Moreover, itemized medical expenditures were not available in some databases. Many categories of health expenditures were specific to countries; for example, there is no concept of a copayment and deductible in Japan and the coinsurance and amount paid by the payer are a fixed percentage, which differs from some other countries. Conversion of cost information will require careful thought and refinement and was not ready for the SCAN analyses.
Challenges: mapping to common terminology codes
Mapping between domestic terminology codes to common terminology codes was the major challenge of the conversion effort, especially for medications. Because most databases used a domestic coding system (eg, US National Drug Codes), the formula of medications differed across countries. The domestic databases also included a large amount of free-text information in local languages, which made the process of refining the mapping for medication codes more difficult. Manual review by experts from participating countries was a time-consuming step, but it was worthwhile because the quality of conversion largely relied on good mapping. We also found it useful to execute automated mapping using generic name, strength, and administration dosage as the primary step before initiating manual processes.
We successfully mapped ~71%, 87%, and 93% of drug codes to RxNorm from Japan, Taiwan, and Hong Kong, respectively. Because the medication mapping rate was relatively lower in Japan than in other countries, we mapped Japanese national drug codes to ATC codesCitation16 to preserve information. We found that 31% of unmapped Japanese drug codes could be classified as ATC code V03 (all other therapeutic products), followed by 8% classified as code B05 (blood substitutes and perfusion solutions), 4% as code A02 (medications for acid related disorders), and 3% as code V07 (all other nontherapeutic products). Because all of Taiwan’s drug codes had been mapped to ATC codes before SCAN, this information facilitated mapping between Taiwan drug codes and RxNorm. We found that most unmapped products in Taiwan’s NHIRD were medications for cold or cough (28%) and vitamin products (25%) (Table S1 is an example of analysis of unmapped medication codes in Taiwan’s NHIRD). The major challenge for medication mapping in CDARS was for combination products. We separated combination products into individual ingredients, and the mapping improved substantially from ~55% to 93%. Evaluation of unmapped codes in the domestic databases provided information on their impacts. For example, although the unmapped rate of medication codes from Taiwan was 20%, they only existed in the NHIRD for ~13% of all drug claims in the NHIRD; the unmapped rate of medication codes from USA was 72%, but they only accounted for 2.8% of ~490 million medication claims in the Medicare data. In contrast, because we were unable to map many medication codes to the product level in Hong Kong’s CDARS and Japan’s JMDC, future analyses using the CDM may be limited to those studies that evaluate medications at the ingredient level. The vocabularies maintained by OHDSI are actively evolving, so results in this article reflect the findings from a particular version, which may have changed in subsequent versions. In particular, OHDSI recently released an RxNorm Extension vocabulary to improve the ability of non-US sources to map source drug codes to standard concepts while preserving information about ingredient, brand, strength, and formulation.
The system of Chinese herbal products differs from Western medicine – for example, the classification of single herbal products and herbal formulas and considerations about origin, morphology, active ingredients, and mechanisms of function.Citation17 There is no common terminology coding system for Chinese herbal products. We preserved information about these products from the domestic codes or text in the CDM. There is a need for a different approach to capture Chinese herbal product information completely for future studies. Although it would require a painstaking effort to develop the coding system, the ability to study the safety of Chinese herbal products is indispensable in the Asian pharmacoepidemiology and pharmacovigilance system.
Mapping for conditions and procedures
Mapping for conditions and procedures had far fewer challenges, because the participating databases used either ICD-9 codes or ICD-10 codes for conditions and international procedure coding systems for which mapping tables have been established.Citation8,Citation14 Although the mapping rate of conditions in the USA was only 83.4%, we found that the unmapped codes were predominantly invalid codes (65%) belonging to ICD-9 supplementary classifications (codes V01–V89 and E800–E999). The primary challenge of mapping procedures arose from the Taiwan NHIRD’s use of domestic procedure codes as the primary codes for reimbursement. To maintain data integrity, we undertook an extra mapping of Taiwan’s domestic procedure codes to ICD-9 procedure codes using the mapping tables provided by Taiwan’s National Health Insurance Administration,Citation9 which resulted in the coding of >300,000 records per year for procedures in the NHIRD. Although there were 18.9% unmapped codes remaining, we found that most of them were classified as excision, reconstruction, biopsy, and health education, and we felt that these would have a relatively minor impact on international studies because most of them were country-specific procedures for reimbursement. The mapping rates for procedure codes in Medicare, JMDC, and CDARS were relatively high, and most unmapped procedures were nonsurgical and noninvasive procedures such as laboratory tests, radiology or imaging, and physiological examinations. Data in the procedure domain are particularly challenging because there is no single comprehensive vocabulary that reflects all procedures administered by providers in the health care system. Thus, multiple vocabularies (including CPT-4, ICD-9/-10 PCS, LOINC, and SNOMED-CT) are required to cover the landscape. Where the vocabularies have overlapping concepts, attempts have been made to map between vocabularies in the OHDSI vocabularies. In the current stage, a researcher will need to explicitly select codes from all standard procedure terminologies.
Although it is not possible to convert data to the CDM without loss of some information, because no model covers all situations in all countries, use of the current version of the CDM for AsPEN multinational studies is feasible as long as the investigators understand the model. The OSCAR outputs reflected good consistency in characteristic statistics between domestic and converted databases. The SCAN results compared favorably to previous studies, indicating both good quality and applicability of the CDM as well as scientific reproducibility. The CDM preserved all relevant information from domestic databases in the source fields whenever fields in the source database could not be accommodated. Investigators should review the ETL documents carefully to understand what information was lost in conversion to prevent the misclassification of exposures or outcomes measured and to use the source fields if required. We believe that continuously updating the CDM and refining the conversions are critical. Locking the CDM is advisable unless refinement is required to avoid discrepancies of the versions analyzed among participants.
Opportunities for multinational pharmacoepidemiologic studies
Multinational pharmacoepidemiologic studies provide opportunities to compare medication use and effects across countries.Citation1 SCAN demonstrated the feasibility and efficiency of studying racial and ethnic differences in medical product use and effects, as the CDM could apply to most routine pharmacoepidemiologic studies by using common software or analytical programs and maintaining data privacy with transparent and scientific standards.Citation2,Citation10,Citation18,Citation19 Because some information was stored by free text or without consistent definitions in the domestic databases, conversion facilitated the standardization of terminologies before entry into the CDM through review processes to improve the quality of analyses. SCAN provides a valuable experience to inform future conversions of the remaining databases in AsPEN, such as the examples listed in , and to create better environments to evaluate the effects of medical products across Asian countries.Citation2 Moreover, because many databases from North American and European countries have been converted to the CDM,Citation3 SCAN offers the opportunity for Asian countries to join worldwide studies that include all databases converted to the CDM. This facilitates the prompt identification of issues for medical products among various populations to minimize the harms of treatment.
Through SCAN, we gained a better understanding of each site and the countries’ health systems and databases and also enhanced collaboration among countries during study communications.Citation1 We understood the cultural factors that influenced prescribing or coding behaviors. We were able to discuss the challenges encountered and to come up with better approaches to improve the quality of conversions. SCAN could also be regarded as the primary step or pilot project to encourage future participants for more collaborations.
Conclusion
Conversion of domestic databases to the CDM established a foundation for future multinational pharmacoepidemiologic studies in AsPEN, which will enable improvements in pharmacovigilance and pharmacoepidemiology systems in Asian countries. We analyzed the quality of the conversions and performed analyses to test the applicability and quality of the CDM. These results developed strong grounds for future studies. The major challenge in SCAN was the mapping of terminology codes, especially for medications, which had large variety among countries. Future work will involve enriching the CDM vocabulary with missing drug concepts to ensure full mapping of all codes. SCAN will increase collaboration among participating countries. Use of the CDM as the first global model for AsPEN offers opportunities to efficiently collaborate with data partners in North America and Europe who have also converted their databases to the CDM for the conduct of international studies through networks such as OHDSI.Citation8,Citation19 Data partners should continuously maintain the CDM, using both the latest community standards for the data schema and the most up-to-date versions of the standardized vocabularies in order to ensure that their data are of good quality.Citation8,Citation19 We anticipate that this successful experience will encourage other Asian countries to participate, enabling researchers to efficiently and comprehensively undertake pharmacoepidemiology and pharmacovigilance efforts in Asian populations.
Acknowledgments
This study was supported by a research agreement between Duke University and Janssen Research & Development, LLC, and a grant from the Ministry of Science and Technology of Taiwan (ID: 106-2320-B-006-025-MY2).
Disclosure
The authors report no conflicts of interest in this work.
References
- LaiEStangPKao YangYKubotaKWongICSetoguchiSInternational multi-database pharmacoepidemiology: potentials and pitfallsCurr Epidemiol Rep201524229238
- LaiECManKKChaiyakunaprukNDatabases in the Asia-Pacific Region: the potential for a distributed network approachEpidemiology201526681582026133022
- VossEAMakadiaRMatchoAFeasibility and utility of applications of the common data model to multiple, disparate observational health databasesJ Am Med Inform Assoc201522355356425670757
- AndersenMBergmanUChoiNKThe Asian Pharmacoepidemiology Network (AsPEN): promoting multinational collaboration for pharmacoepidemiologic research in AsiaPharmacoepidemiol Drug Saf201322770070423653370
- PrattNAndersenMBergmanUMulti-country rapid adverse drug event assessment: the Asian Pharmacoepidemiology Network (AsPEN) antipsychotic and acute hyperglycaemia studyPharmacoepidemiol Drug Saf201322991592423696036
- RougheadEEChanEWChoiNKVariation in association between thiazolidinediones and heart failure across ethnic groups: retrospective analysis of large healthcare claims databases in six countriesDrug Saf201538982383126216600
- PrattNChanEWChoiNKPrescription sequence symmetry analysis: assessing risk, temporality, and consistency for adverse drug reactions across datasets in five countriesPharmacoepidemiol Drug Saf201524885886425907076
- OHDSI [homepage on the Internet]The Observational Health Data Sciences and Informatics2017 Available from: https://www.ohdsi.org/Accessed September 23, 2017
- homepage on the Internet Tawian National Health Insurance Administration2017 Available from: http://www.nhi.gov.tw/Accessed September 23, 2017
- StangPERyanPBRacoosinJAAdvancing the science for active surveillance: rationale and design for the Observational Medical Outcomes PartnershipAnn Intern Med2010153960060621041580
- XuYZhouXSuehsBTA comparative assessment of Observational Medical Outcomes Partnership and Mini-Sentinel common data models and analytics: implications for active drug safety surveillanceDrug Saf201538874976526055920
- OverhageJMRyanPBReichCGHartzemaAGStangPEValidation of a common data model for active safety surveillance researchJ Am Med Inform Assoc2012191546022037893
- ZhouXMurugesanSBhullarHAn evaluation of the THIN database in the OMOP Common Data Model for active drug safety surveillanceDrug Saf201336211913423329543
- National Library of Medicine [homepage on the Internet]National Institutes of Health Available from: http://www.nlm.nih.gov/Accessed September 23, 2017
- SNOMED [homepage on the Internet]NOMED International Available from: https://www.snomed.org/Accessed September 23, 2017
- WHO Collaborating Center for Drug Statistics Methodology [homepage on the Internet]Anatomical Therapeutic Chemical (ATC) Classification System Available from: http://www.whocc.noAccessed August 11, 2016
- HsiehSCLaiJNLeeCFHuFCTsengWLWangJDThe prescribing of Chinese herbal products in Taiwan: a cross-sectional analysis of the national health insurance reimbursement databasePharmacoepidemiol Drug Saf200817660961918481335
- RyanPBMadiganDStangPEOverhageJMRacoosinJAHartzemaAGEmpirical assessment of methods for risk identification in healthcare data: results from the experiments of the Observational Medical Outcomes PartnershipStat Med201231304401441523015364
- HripcsakGDukeJDShahNHObservational Health Data Sciences and Informatics (OHDSI): opportunities for observational researchersStud Health Technol Inform201521657457826262116