
Abstract
Background
Missing data are often an issue in electronic medical records (EMRs) research. However, there are many ways that people deal with missing data in drug safety studies.
Aim
To compare the risk estimates resulting from different strategies for the handling of missing data in the study of venous thromboembolism (VTE) risk associated with antiosteoporotic medications (AOM).
Methods
New users of AOM (alendronic acid, other bisphosphonates, strontium ranelate, selective estrogen receptor modulators, teriparatide, or denosumab) aged ≥50 years during 1998–2014 were identified in two Spanish (the Base de datos para la Investigación Farmacoepidemiológica en Atención Primaria [BIFAP] and EpiChron cohort) and one UK (Clinical Practice Research Datalink [CPRD]) EMR. Hazard ratios (HRs) according to AOM (with alendronic acid as reference) were calculated adjusting for VTE risk factors, body mass index (that was missing in 61% of patients included in the three databases), and smoking (that was missing in 23% of patients) in the year of AOM therapy initiation. HRs and standard errors obtained using cross-sectional multiple imputation (MI) (reference method) were compared to complete case (CC) analysis – using only patients with complete data – and longitudinal MI – adding to the cross-sectional MI model the body mass index/smoking values as recorded in the year before and after therapy initiation.
Results
Overall, 422/95,057 (0.4%), 19/12,688 (0.1%), and 2,051/161,202 (1.3%) VTE cases/participants were seen in BIFAP, EpiChron, and CPRD, respectively. HRs moved from 100.00% underestimation to 40.31% overestimation in CC compared with cross-sectional MI, while longitudinal MI methods provided similar risk estimates compared with cross-sectional MI. Precision for HR improved in cross-sectional MI versus CC by up to 160.28%, while longitudinal MI improved precision (compared with cross-sectional) only minimally (up to 0.80%).
Conclusion
CC may substantially affect relative risk estimation in EMR-based drug safety studies, since missing data are not often completely at random. Little improvement was seen in these data in terms of power with the inclusion of longitudinal MI compared with cross-sectional MI. The strategy for handling missing data in drug safety studies can have a large impact on both risk estimates and precision.
Background
Electronic medical record (EMR) databases are a commonly used data source for drug safety research.Citation1 They provide exceptional value for the study of suspected unwanted effects not tested in randomized clinical trials (RCT) and for the high proportion of drug users in the community who are deemed not eligible for participation in RCTs.Citation2 Notwithstanding these benefits, the lack of full records on key variables (ie, missing data) can pose a real challenge to conducting EMR research.
Missing data are a well-recognized issue that can compromise statistical power, as “complete case (CC)” analyses will automatically exclude subjects with missing information for any of the variables included in multivariable models. More importantly, if data are missing at random (MAR), but not completely at random, analyses based on CCs may be biased,Citation3 and researchers may not be aware of this.
Likewise, including a “missing data indicator” variable in the analysis is a widely used strategy likely to introduce bias.Citation4,Citation5 Such biases can be overcome by using methods such as multiple imputation (MI), which allow individuals with incomplete data to be included in analyses.Citation3 However, MI methods are still seldom used in EMR-based post-authorization safety studies.Citation6
In this study, our aim was to compare the risk estimates observed when applying CC analysis versus MI and give the reader an intuitive understanding and practical overview of the potential issues and limitations of using CC and longitudinal MI by taking the cross-sectional MI as the reference. As a part of a cohort study on the risk of venous thromboembolism (VTE) associated with the use of different antiosteoporotic medications (AOM),Citation7 we explored the issues of missing data and compared different methods using data from three different EMR databases from Spain and the UK. Our secondary aim was to describe a step-by-step approach for setting up and conducting MIs in drug safety studies using EMR data and to list practical challenges faced during the MI process. We followed the guidelines for this process provided by previous authors.Citation3,Citation5,Citation8
Methods
Sources of data
We obtained data from primary care deidentified computerized medical records from two different EMR databases in Spain (the Base de datos para la Investigación Farmacoepide-miológica en Atención Primaria [BIFAP]Citation9 and the EpiChron CohortCitation10) and one from the UK (Clinical Practice Research Datalink [CPRD]).Citation11 These databases include information on patient age, sex, life-style factors, clinical events, drug prescriptions, specialist referrals, and laboratory test results for millions of primary care patients.
Study population and exposure cohorts
The study population was formed by all patients aged ≥50 years with at least 1 year of available recorded data and a prescription or dispensation of AOM (date for therapy initiation) during each database study period, that is, 2000–2014 (CPRD), 2001–2013 (BIFAP), and 2010–2011 (EpiChron). Patients with a prescription or dispensation of AOM recorded during the year before therapy initiation were considered as prevalent users and thus excluded from the study.
Six exposure cohorts were identified according to the first AOM prescribed as follows: 1) alendronic acid (Anatomical Therapeutic Chemical classifications M05BA04 and M05BB03); 2) other oral bisphosphonates (etidronic acid [M05BA01], ibandronic acid [M05BA06], risedronic acid [M05BA07], clodronic acid [M05BA02], and tiludronic acid [M05BA05] – the two latter available only in Spain-); 3) selective estrogen receptor modulators (bazedoxifene [G03XC01] and raloxifene [G03XC02]); 4) strontium ranelate (M05BX03); 5) denosumab (M05BX04); and 6) teriparatide (H05AA02). We considered treatment episodes of prescribing including prescription durations with <180 days gap.
Case ascertainment and follow-up
Participants from exposure cohorts were followed from the day after therapy initiation to the earliest of the following: a record of treated VTE diagnosis (cases), end of first AOM treatment episode (end of supply of the last prescription before a gap of 180 days), switching to an alternative cohort exposure, lost to follow-up, death, or end of study period. A list of Read and International Classification of Primary Care (ICPC) codes for identification of VTE diagnosis recording in CPRD and BIFAP/EpiChron, respectively, is reported elsewhere.Citation7 Read codes were developed by Dr James Read, and are standard clinical terminology in UK primary care practice.
Confounders
Factors associated with VTE risk according to The National Institute for Health and Care Excellence guidelinesCitation12 were collected as potential confounders: 1) history of VTE, cancer, peripheral arterial disease, vein insufficiency as recorded at any time before the date of therapy initiation; 2) use of hormone replacement therapy (HRT) during the year before therapy initiation; 3) fractures recorded in the 2 months before therapy initiation (used as a proxy for bed-bound patients in the target population of incident AOM drug users); and 4) body mass index (BMI) in kg/m2 (as a continuous variable) and smoking status, as recorded in the year of therapy initiation (the closest value to January 1 in case of repeated records in that same year). Smoking status was assessed as a binary variable (current smoker yes/no) where nonsmokers included both ex and never smokers. Patients with recorded status of exclusively “never smoker” at the age of ≥40 years were considered as nonsmokers even in the presence of missing data in the year of therapy initiation. This is because it is unlikely that many people aged >40 years will take up smoking later in life.Citation13 Also, the Charlson comorbidity index was calculatedCitation14 (CPRD) or an equivalent list of comorbidities included in the latter index (EpiChron/BIFAP). Alcohol abuse (“yes/no” as ICPC symptom/complaint recorded by the primary care practitioner in EpiChron/BIFAP) and use of other AOM (ie, parathyroid hormone, calcitonin, and elcatonin), calcium–vitamin D supplements, systemic corticosteroids, heparins, and oral anticoagulant drugs were also included in the analyses.
Statistical analyses
Cox regression models adjusted for all confounders listed above were applied in each EMR database separately (ie, substantive model) to quantify the risk of VTE (hazard ratios [HRs] and 95% confidence intervals [CIs]) associated with the different AOM compared with alendronic acid. Stata® program by StataCorp LP was used for statistical analysis. Regarding the MI of missing data, we followed a step-by-step strategy based on the guidance provided by Sterne et al,Citation3 White et al,Citation8 and Pedersen et alCitation5 as described below:
1. Reflecting on the nature of missing data
In the proposed scenario, two variables had missing information in the year of therapy initiation: smoking status and BMI. Most software that implements MI assumes that missing data are MAR, meaning, given the observed data, data are missing independent of unobserved data.Citation15 The assumption of the existence of such variables is relatively easy to accept in EMR-based research, as for example, women are often more likely to see their general practitioners on a regular basisCitation16 leading to a higher chance of recording of lifestyle variables such as BMI or smoking in women than in men.
We examined the presence of such variables in our data as follows:
We fitted multivariable logistic regression models to identify predictors of missingness for each individual variable (one model for BMI missingness and a separate one for smoking missingness) using the whole dataset.
We fitted logistic and linear regression models for binary variables (ie, current smoking status) and continuous variables (ie, BMI), respectively, to identify predictors of variable values based on the CCs dataset.
Automatic backward stepwise selection methods (with a p-exit<0.1 and p-entry<0.05) were used to identify key variables in all the above models. A number of variables, in addition to those included in the substantive model, were included for each database depending on the availability in the extracted analytical dataset as mentioned above. provides a list of variables that were examined as associated with missingness and the values of BMI or smoking data.
2. Specification of the imputation model
According to the MI guidelines,Citation17 the MI model should include all variables planned for the substantive model; in our case, potential confounders, exposure and outcome (including both VTE yes/no and the Nelson–Aalen estimate of the cumulative hazard rate function) as well as auxiliary variables that are associated with both missingness and variable values at the same time.Citation17 The auxiliary variables may increase the likelihood of the MAR.Citation3
3. Multiple imputation models
In this study, we applied MI using chained equations.Citation18 A total of 15 datasets were imputed for each of the MI models. We evaluated different applications of MI where we used data recorded at different times in the databases: A) cross-sectional MI model (CSMI), including predictors detected exclusively using BMI and smoking data recorded in the year of therapy initiation; B) longitudinal MI model (MI−1y), including the variables in A and the value of BMI and smoking as recorded (when available) in the year before therapy initiation year; and C) longitudinal MI (MI±1y), including the predictors in A and B, but also the values of BMI and smoking as recorded (when available) in the year after therapy initiation year.
Stata statement:
mi impute chained (logit, omit(smoking predictors)) smoking (regress, omit(BMI predictors)) bmi= substantive model and all predictors, add(number of imputations) rseed(random number)
mi impute chained (logit, omit(smoking predictors)) smoking smoking−1y smoking+1y (regress, omit(BMI predictors)) bmi bmi−1y bmi+1y = substantive model and all predictors without missing, add(number of imputations) rseed(random number)
4. Running the substantive model in the imputed datasets
The final step was fitting the proposed substantive model above to the imputed datasets. In our case, comparative risk of VTE across AOM status was estimated using Cox regression models.
Stata statement:
mi stset Time, failure(censoring==1) scale(365.25)
mi estimate:stcox i.exposure i.var1 i.var2 i.var3
Comparing different strategies for handling missing data in drug safety research
In addition to the three MI approaches, we also analyzed the data using CC analysis, in which patients without BMI and smoking status were excluded from the analysis.
In total, four strategies were compared, with CSMI being the reference standard. Baseline characteristics and incidence rates (IRs) of VTE in patients participating in CC compared with the whole study population were provided as an overall assessment of the potential bias underlying CC analysis. Then, differences in point estimates of each model compared to CSMI were calculated for each exposure cohort as (HRAlternative−HRCSMI)/HRCSMI. Improvement in precision of each model (as a function of standard error [SE] size) relative to CSMI was finally estimated for all exposure cohorts as (SEAlternative−SECSMI)/SECSMI.
Patient involvement
No patient(s) or public representatives have been involved as part of this work.
Ethics and scientific committees’ approval
The study protocol was approved by the UK Independent Scientific Advisory Committee ISAC (REF Citation14_110R), CEIC Aragón (Number CP20/2014), and BIFAP Scientific Committee (Number 02_2015).
Results
The study populations were made up of 95,057 (BIFAP), 12,688 (EpiChron), and 161,202 (CPRD) new users of AOM aged ≥50 years during 1998–2014. Among them, 422, 19, and 2,051 VTE cases during the first AOM treatment episode were detected, respectively, during a median time of follow-up between 1.04 and 1.71 years, depending on the EMR database.
Teriparatide in CPRD as well as denosumab and selective estrogen receptor modulator (SERM) in EpiChron were not assessed due to scarce numbers of exposed patients. No estimates were obtained in CC for denosumab in BIFAP and for teriparatide in EpiChron for the same reason.
shows the availability of BMI and smoking data within up to 1 year before and after year of therapy initiation. Depending on the database, between 37.4% and 40.3% of new AOM users had BMI records, and between 55.8% and 90.7% had smoking records in the year of therapy initiation. Among those patients with information, mean BMI varied from 28.65 (BIFAP) to 29.11 (EpiChron) kg/m2 and prevalence of current smokers ranged from 4.6% (EpiChron) to 23.1% (BIFAP). Among patients without information in the year of therapy initiation, few had BMI or smoking data recorded the year before (10.8% and 9.6% of total patients in BIFAP, 7.7% and 1.7% in EpiChron, and 14.7% and 3.8% in CPRD, respectively). Even fewer additional patients had BMI and smoking records only the year after therapy initiation year (3.0% and 4.8% in BIFAP, 11.0% and 2.1% in EpiChron, and 8.5% and 1.5% in CPRD, respectively).
Table 1 Distribution of patients with BMI and smoking records by calendar year-blocks up to ±1 year from year of therapy initiation.
shows the distribution of baseline characteristics in the whole study populations and in patients participating in the CC analysis, as well as the global IR of VTE during the first treatment episode of AOM. Depending on the database, between 31% and 38% of new AOM users, that is 32%–41% of total VTE cases, had complete records in the year of therapy initiation in relation to the substantive model and could, therefore, be included for the CC analysis. CC yielded a nonsignificant higher IR of VTE than for the whole study population in BIFAP and CPRD, but lower in EpiChron. The distribution of AOM cohorts was slightly different in CC versus the whole study populations, that is, SERM was slightly underrepresented in CC in BIFAP and EpiChron, as was strontium in CPRD. Restricting to CC also impacted the distribution of potential confounders, such as gender and age. For example, in BIFAP, 18% of those with complete records were between 50 and 59 years while in those with missing data 32% were between 50 and 59 years.
Table 2 Global IR of VTE during first treatment episode of AOM, and the distribution of baseline characteristics in the whole study population and in patients participating in complete case analysis
shows the variables associated with the missingness and/or the values of BMI or smoking data in the three databases, as well as those finally included in the MI model.
In BIFAP, predictors of BMI values were the calendar year, alcohol abuse, most of the diseases assessed (including aneurysm, COPD, asthma, dementia, diabetes, heart failure, liver disease, rheumatoid arthritis, peptic ulcer, renal diseases, treated VTE [outcome], a history of VTE, recent fractures, vein insufficiency or phlebitis, peripheral arterial disease, and cancer), the AOM cohort (exposure of interest), and the prescription of other antiosteoporotic drugs, calcium–vitamin D, corticosteroid drugs, heparin, and HRT. Predictors of current smoking were the calendar year, alcohol abuse, COPD, diabetes, rheumatoid arthritis, and prescription of other anti-osteoporotic drugs, calcium–vitamin D, and corticosteroid drugs. Age and sex predicted both BMI and smoking values.
In EpiChron, predictors of BMI values were the calendar year, asthma, dementia, diabetes, vein insufficiency or phlebitis, cancer, and the prescription of other antiosteoporotic drugs, calcium–vitamin D, corticosteroids, and heparin. Predictors of smoking values were alcohol abuse, COPD, diabetes, heart failure, and other antiosteoporotic drugs, age, and sex.
In CPRD, predictors of BMI and smoking status were the calendar year, the AOM cohort (exposure), a history of VTE, recent fractures, vein insufficiency or phlebitis, the use of calcium–vitamin D, corticosteroids, and anticoagulant drugs. Rheumatoid arthritis, treated VTE (outcome), and prescription of heparins and HRT were also predictors of BMI value, whereas hypnotic drugs predicted smoking status.
shows the distribution of the BMI and current smoking values as recorded in the database and as imputed in the 15 datasets for the three databases.
Change in risk estimation
reports the HR (and 95%CI) produced for each AOM versus alendronic acid in each method by database. The risk of VTE associated with other oral bisphosphonates, strontium ranelate, teriparatide, and denosumab versus alendronic acid obtained in the CSMI for CPRD and BIFAP was published in a previous article focused on the clinical interpretation of those HRs.Citation7
Table 3 HR (and 95% CI) of VTE associated with each AOM versus alendronic acid according to each method (CC, CSMI, MI−1y, and MI±1y) and database
shows HR differences produced in each method relative to CSMI (prespecified reference group) for each exposure cohort and database. Negative percentages indicate underestimation in HR with the alternative method versus CSMI. Big differences were found when comparing CC versus CSMI, where the HR moved in both directions, from 100.00% underestimation (in BIFAP, EpiChron, and strontium in CPRD) to 40.31% overestimation (for all other AOM in CPRD).
Table 4 HR differences according to each method relative to CSMI for each exposure cohort and database
Little difference was found when comparing the HR produced in longitudinal MI−1y and MI±1y versus CSMI. Estimates were higher or lower depending on exposure cohorts. Differences ranged from −5.14% to 2.26% and the highest discrepancies were found in the smallest exposure cohorts (all EpiChron exposure cohorts and denosumab in BIFAP).
Statistical power/accuracy
shows SE differences for each method relative to CSMI by AOM cohort and database. Positive percentages mean precision improvement with CSMI. Precision improved always in CSMI versus CC (up to 160.28%). Relatively low or no improvement in power (ie, SE size reduction) was observed when using longitudinal MI analysis compared with CSMI (range 0.02%–0.80%).
Table 5 Standard error differences produced in each method relative to CSMI for each AOM cohort and database
Discussion
Our purpose was to compare four methods used for handling BMI and smoking missing data as potential confounders in a clinical use case – a comparative drug safety study of the risk of VTE associated with different AOM. We compared results from CC analysis and MI based only on cross-sectional records (reference method as based on previous simulation studies), or after adding within-patient longitudinal records. The study was performed in three electronic primary care databases from the UK and Spain. Our findings can be summarized as follows.
First, we observed that missing BMI and smoking values in the three databases were not completely at random since multiple predictors were associated with the values and missingness in the three databases. For example, in BIFAP, 18% of those with complete records were between 50 and 59 years while in those with missing data 32% were between 50 and 59 years. Age was also associated with the values of BMI and smoking and, consequently, the risk of VTE associated with different AOM obtained in CC analysis is likely to be biased. Indeed, we found substantial differences in the risk estimates based on CC and CSMI. The sample sizes were also reduced in the CC analyses, which led to a significant power loss of up to 160%, compared with base-case CSMI.
Second, an extra level of imputation was added to CSMI, which took advantage of the information on BMI and smoking values recorded 1 year apart (either before or after index year) as predictors. In our study, these longitudinal MI models did not improve precision substantially when compared with CSMI-based risk estimates.
The intermittent pattern of records completeness in EMR is common. Previous authors using measurements collected at different time points in MI strategies have failed to reveal the best-performing method, suggesting further research to compare different imputation methods.Citation19,Citation20 Some further strategies used the data by time blocks and their temporal ordering.Citation13,Citation21,Citation22 A further simulation study considering correlation over time suggested an optimal use of data available, the gain relative to baseline MI being dependent on the strength of the correlations among variables collected over time.Citation13
A potential explanation for the lack of gain in precision in our study is that the large study cohorts provided enough cross-sectional information for predicting and imputing values to such an extent that records within 1 extra year were not as informative as expected. Also, few patients had values of BMI or smoking records 1 year apart, therefore, adding very little data to that available in the year of therapy initiation. Furthermore, a slight loss of precision was observed when adding longitudinal information to the analysis of study cohorts that were smallest in size and shortest in time contribution. A possible reason for this could be the availability in the time of smoking data, which was used for assuming noncurrent smoking status whenever patients had consistent registries of noncurrent smoking throughout their life. This was previously done by other authors,Citation13 entailing correlation within time blocks. This deterministic assumption was based on the fewer and therefore more uncertain records of smoking status in the EpiChron database compared with the other databases covering longer periods and wider populations.
CSMI analysis preserves power using the whole study population while accounting for variance of imputed values (Rubin’s ruleCitation23). In the current study, BMI and smoking values reached realistic distributions in the three databases after imputation based on multiple predictors (). Under those distributions and based on simulation studies,Citation13 CSMI showed accurate risk estimates after adjusting by imputed BMI and smoking values based on multiple predictors of missing and observed values on the basic principle of replacement.Citation4
We identified some practical challenges during the MI process, which are worth mentioning. First, we observed that the complexity of identification of potential variables to be included in the MI model increases with the increasing number of variables to impute, especially when mutual adjustment for all variables with missing data is preferred.
In the current study, two variables with missing data were imputed (ie, BMI and smoking) and mutually adjusted for each other in a way that we kept those value predictors that were significant in individuals who had complete records of both BMI and smoking, that is, predictors of BMI values were selected through a model adjusted by current smoking and, vice versa, predictors of current smoking were selected in a model adjusted by BMI values. However, eight different regression models for prediction examination were possible, where missingness and values of both variables acted as outcomes and potential predictors of each other. Still, an alternative would have been to select variables based on models without mutual adjustment for the other variable with missing data that probably simplifies the process.
Some limitations should be mentioned. First, the “MAR” distribution is an assumption that cannot be formally tested, and if not valid, the violation of such assumption would question the validity of CSMI as a “reference” method in our analysis. However, this is the challenge often faced by researchers in the field of drug safety research, where no reference risk estimate is available; in contrast, methodological research using simulation studiesCitation13 has demonstrated the validity of CSMI. Finally, CSMI multivariable models suggested that BMI and current smoking were actually weak confounders in the studied association between AOM and VTE. It is, therefore, plausible that the observed change in risk estimation observed in alternative (non-CSMI) methods might differ in other clinical scenarios where missingness affects stronger confounders; indeed, bigger differences among methods are expected when data are missing in strong confounders.
In summary, MI requires a preliminary evaluation of missing data and the patterns of observed values and predictors. The complexity and time requirements increase with the number of variables with missing data to impute. If the initial explorative analyses of the missing data suggest that MAR is plausible and information is available within the dataset to account for MAR, then MI is recommended. However, among MI strategies, we observed a relatively small gain in precision when using longitudinal MI versus CSMI. Still, our model was based only on longitudinal data relatively close to the baseline (±1 year), but the simulation study of longitudinal MI by Welch et alCitation13 demonstrated that for some variables with a strong correlation between values over time, the gain in precision can be substantial. In situations of small study cohorts or few cross-sectional predictors, we hypothesize that the inclusion of longitudinal records may be superior to using only cross-sectional records for MI, but further work is needed to evaluate this hypothesis. There may, however, be situations where it is impossible to perform MI as there may be insufficient data available to inform the MI model. In these cases, an option might be to exclude such an incomplete variable from the substantive model rather than exclude patients with missing data. Fortunately, MI is now supported by most common statistical software through fairly simple commands, despite being a relatively sophisticated method.
CC may result in biased estimates calculation when data are missing at random, which may be highly frequent in EMR, and our case study illustrates the superior benefits and applicability of CSMI compared with CC in a real-life drug safety study. In some cases, it may, however, be reasonable to use CC analyses, such as when working with large datasets with few missing observations, because the risk of bias is minimal and the precision is still good. Likewise, if the missingness is not associated with the outcome, a CC analysis will provide unbiased estimates.Citation24
In this study, we were able to demonstrate that the missing data were dependent on other observed variables. Hence, under the assumption that we have specified the imputation model correctly, the CSMI will provide unbiased estimates and, therefore, form the basis for the further analysis rather than the CC.
Author contributions
All authors contributed toward data analysis, drafting and critically revising the paper, gave final approval of the version to be published, and agree to be accountable for all aspects of the work.
Acknowledgments
The authors would like to acknowledge the excellent collaboration of general practitioners, pediatricians, and patients taking part in the primary care records. Partial funding for the study was from UK National Osteoporosis Society (Project Grant). EMM affirms that the manuscript is an honest, accurate, and transparent account of the study being reported; that no important aspects of the study have been omitted; and that any discrepancies from the study as planned (and, if relevant, registered) have been explained.
Supplementary materials
Figure S1 Distribution of the BMI and current smoking values as recorded in the year of therapy initiation in the database (0), and as imputed in the 15 datasets (1–15) for the three databases from top to bottom (A) BIFAP, (B) EpiChron and (C) CPRD.
Abbreviations: BIFAP, Base de datos para la Investigación Farmacoepidemiológica en Atención Primaria; BMI, body mass index; CPRD, Clinical Practice Research Datalink.
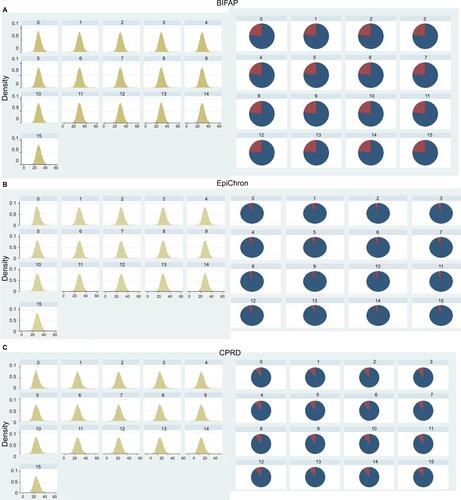
Table S1 Association of the studied factors with the missingness and value of BMI and current smoking status in the three databases, as well as those finally used for the multiple imputation of BMI and current smoking (grey columns)
Disclosure
EMM, ACL, SH, BPP, and ALG declare no financial relationships within the previous 3 years with any organizations that might have an interest in the submitted work and no other relationships or activities that could appear to have influenced the submitted work. IP supervises a PhD student who is funded by Novo Nordisk. DPA’s group have received unrestricted research grants from Servier Laboratoires, AMGEN, and UCB Pharma. The views expressed here do not necessarily represent the views of the authors’ respective companies or organizations. The authors report no other conflicts of interest in this work.
References
- The European Network of Centres for Pharmacoepidemiology and Pharmacovigilance (ENCePP)Guide on Methodological Standards in Pharmacoepidemiology (Revision 4) EMA/95098/201. Available from: http://www.encepp.eu/standards_and_guidances/documents/ENCeP-PGuideofMethStandardsinPE_Rev4.pdfAccessed June 14, 2016
- ReyesCPottegårdASchwarzPReal-life and RCT participants: alendronate users versus FITs’ trial eligibility criterionCalcif Tissue Int201699324324927099132
- SterneJACWhiteIRCarlinJBMultiple imputation for missing data in epidemiological and clinical research: potential and pitfallsBMJ2009338b239319564179
- DondersARTvan der HeijdenGJMGStijnenTMoonsKGMReview: a gentle introduction to imputation of missing valuesJ Clin Epidemiol200659101087109116980149
- PedersenABMikkelsenEMCronin-FentonDMissing data and multiple imputation in clinical epidemiological researchClin Epidemiol2017915716628352203
- ArfèAScottiLVaras-LorenzoCNon-steroidal anti-inflammatory drugs and risk of heart failure in four European countries: nested case-control studyBMJ2016354i485727682515
- Martín-MerinoEPetersenIHawleySRisk of venous thromboembolism among users of different anti-osteoporosis drugs: a population-based cohort analysis including over 200,000 participants from Spain and the UKOsteoporos Int201829246747829199359
- WhiteIRRoystonPWoodAMMultiple imputation using chained equations: issues and guidance for practiceStat Med201130437739921225900
- Agencia Española del Medicamento y Productos SanitariosBIFAP: Base de datos para la Investigación Farmacoepidemiológica en Atención Primaria [BIFAP: Database for the pharmacoepidemiological research in primary care] Available from: http://bifap.aemps.es/Accessed January 31, 2017 Spanish
- European Network of Centres for Pharmacoepidemiology and Pharmacovigilance (ENCEPP)Research centre: EpiChron Research Group on Chronic Diseases Available from: http://www.encepp.eu/encepp/viewResource.htm?id=17870Accessed June 15, 2017
- Clinical Practice Research Datalink - CPRD Available from: https://www.cprd.com/intro.aspAccessed February 28, 2017Accessed February 28, 2017
- Venous Thromboembolism: Reducing the Risk for Patients in HospitalGuidance and Guidelines NICENICE2015 Available from: https://www.nice.org.uk/guidance/cg92/chapter/1-recommendations#assessing-the-risks-of-vte-and-bleeding-2Accessed June 17, 2016
- WelchCAPetersenIBartlettJWEvaluation of two-fold fully conditional specification multiple imputation for longitudinal electronic health record dataStat Med201433213725373724782349
- KhanNFPereraRHarperSRosePWAdaptation and validation of the Charlson Index for Read/OXMIS coded databasesBMC Fam Pract201011120051110
- CarpenterJKenwardMIntroductionMultiple Imputation and Its Application1st edChichesterJohn Wiley & Sons, Ltd2013336
- WangYHuntKNazarethIFreemantleNPetersenIDo men consult less than women? An analysis of routinely collected UK general practice dataBMJ Open201338e003320
- CarpenterJKenwardMThe multiple imputation procedure and its justificationMultiple Imputation and Its Application1st edChichesterJohn Wiley & Sons, Ltd20133773
- Stata Multiple Imputation reference manual. Release 13 Available from: https://www.stata.com/manuals13/mi.pdfAccessed May 23, 2017
- GrittnerUGmelGRipattiSBloomfieldKWickiMMissing value imputation in longitudinal measures of alcohol consumptionInt J Methods Psychiatr Res2011201506121556290
- LewisNMartinezLSFreresDRSeeking cancer-related information from media and family/friends increases fruit and vegetable consumption among cancer patientsHealth Commun201227438038821932985
- NevalainenJKenwardMGVirtanenSMMissing values in longitudinal dietary data: a multiple imputation approach based on a fully conditional specificationStat Med200928293657366919757484
- WelchCBartlettJPetersenIApplication of multiple imputation using the two-fold fully conditional specification algorithm in longitudinal clinical dataStata J201414241843125420071
- RubinDInference and missing dataBiometrika1976633581592
- van BuurenSFlexible Imputation of Missing Data IllustratedBoca RatonCRC PressTaylor & Francis2012