 ?Mathematical formulae have been encoded as MathML and are displayed in this HTML version using MathJax in order to improve their display. Uncheck the box to turn MathJax off. This feature requires Javascript. Click on a formula to zoom.
Abstract
Purpose
Epidemiological studies of chronic disorders need to consider more responsive outcomes, particularly those that manifest themselves across a defined population over a shorter time period, to improve our ability to detect the causes of and intervene in the global epidemics of today. We explore the use of hospital episode statistics as a candidate for this role and estimate the strength of the association of circulatory disease-related events with physical inactivity, considered here as an undesirable health behavior.
Settings, patients, and methods
The primary research was set in a mid-sized city in central England. Aggregation was at output area level (comprising ~300 residents); 51 of which were included. A random sample of 761 adults was selected to obtain estimates of the mean level of physical activity within each area. Circulatory disease hospital events were recorded and aggregated by output area over a 2-year period. Hierarchical linear modeling was used to establish the strength of the association between area-level physical activity and circulatory disease events. Sex, age, and reporting quarter were included as additional individual-level explanatory variables.
Results
Areas reporting greater activity were less likely (event rate ratio = 0.855; 95% confidence interval [CI]: 0.78–0.94) to have a circulatory disease event, as were females (0.593; 95% CI: 0.47–0.75). Areas with older residents (1.578; 95% CI: 1.5–1.66) and later reporting quarters (1.095; 95% CI: 1.04–1.15) were more likely to report circulatory disease events.
Conclusion
This study supports the use of hospital episode statistics as an outcome measure in the epidemiology of circulatory disease and reaffirms the potential importance of physical inactivity in the disease process.
Introduction
Since the pioneering research of Morris and colleagues in the UK in the 1950s and Paffenbarger and Hale in the US in the 1970s,Citation1,Citation2 physical inactivity has become established as an important modifiable risk factor in a number of chronic diseases.Citation3–Citation5 Much of the literature has relied on coronary heart disease mortality or all-cause mortality as the primary outcome measure to establish the link. Whilst this has been undoubtedly seminal research, the end-point, mortality, requires a long wait. It is also extremely difficult to obtain good estimates of the strength of the relationship, as it is usually necessary to observe or, at least, categorize habitual physical activity over a long period. Furthermore, it is difficult to obtain reliable estimates of potential health care cost–benefits of interventions designed to increase physical activity in hospital populations.
A way around both of these challenges might be to explore the relationship between physical activity and health-related outcomes that may be more responsive, ie, manifest themselves across a defined population over a shorter time period and/or be more sensitive to variation in physical activity, and which may be valued reliably in terms of costs to the health care sector. One source of routinely collected data that may be a candidate for such a role could be hospital episode statistics. We report a pilot study carried out across a single city in the West Midlands region of the UK to test this thesis and to establish estimates of the strength of the association between physical activity and directly measured and valued health outcomes.
We focus our attention on circulatory disease events since these outcomes have well-established links with physical inactivity and at least some of the multifactorial mechanisms for benefit are known.Citation6
Methods
Small area analysis of hospital episodes
The purpose of the study was to examine whether physical activity, measured at the areal level, was associated with health care treatment episodes for circulatory disorders.
Setting
The research was set in a mid-sized city (population ~250,000) in the West Midlands region of England and the focus was on relatively deprived inner-city areas.
Study areas
The geographical unit selected to determine study areas was the lower level super output area (LSOA). This is the smallest unit for which population census data are made available in the UK. In England, there are 32,482 LSOAs, which have an average population of 1,500 and a minimum population of 1,000. Each LSOA is made up of 4–6 output areas (OA) and the latter was chosen as the level of geographical aggregation for this analysis. After ranking into deciles of deprivation (based on the English Indices of Multiple Deprivation 2004),Citation7 and excluding areas adjacent to the city boundaries and areas undergoing significant redevelopment, ten LSOAs were selected randomly from the six deciles of highest deprivation, yielding 51 OA for inclusion in the analysis.
Primary measures
Area-level physical activity
Estimates of physical activity for each output area included in the study required a random sample survey of residents from the selected areas. A random probability sample of addresses in the selected LSOAs was chosen. A sample size requirement of 600, with approximately 60 in each area, was calculated to provide adequate precision (to within 5% with 95% CI for a total target population ~15,000) for population proportion estimates. The survey was undertaken independently by the National Centre for Social Research (NatCen, London, UK). Full details of the sample and survey processes are available in our earlier publication and the technical report.Citation8,Citation9 Physical activity was estimated using the International Physical Activity Questionnaire (Long version),Citation10 which provides estimates of weekly energy expenditure (in MET minutes/week, where the MET or metabolic equivalent of an activity expresses the energy cost of the activity as multiples of the resting metabolic rate) in four activity domains: work-related, active transport, garden and domestic, and leisure. The questionnaire was administered by computer-assisted personal interview.
Circulatory disease events
Circulatory disease events (International Statistical Classification of Disease and Related Health Problems, 10th RevisionCitation11 codes I00–I99) were recorded over a 2-year period from January 1, 2006 to December 31, 2007 for each of the 51 OA.
Ethical considerations
This research was conducted according to the ethical principles laid out in the Declaration of Helsinki and was approved by the Institutional Research Ethics Committee. All participants in the physical activity survey gave informed consent to take part, following receipt of written (letter and leaflet in advance) and verbal information (at interview) describing the study. Access to anonymized information relating to hospital episodes was granted by the Information Governance Manager, Directorate of Information Management and Technology of the local Primary Care Trust following confirmation of compliance with both the Data Protection Act 1998 and the National Health Service Confidentiality Code of Practice.
Analysis strategy
Variables available
Sex, age, ethnicity, deprivation decile, and time of year (reporting quarter) were available as well as the primary diagnosis for each hospital episode considered. Thus, it was possible to test and adjust for these factors within the analyses. The mean physical activity score for each OA was also calculated to give an estimate of physical activity. In addition, the cost of each hospital episode could be valued through the associated Healthcare Resource Group code and indicative cost for the procedure, allowing estimates to be obtained of the association of physical inactivity with costs for treating hospital episodes for circulatory disorders. All costs reported here are based on unadjusted cost estimates from 2007.
Explanatory models
Circulatory disease episodes were considered to be rare events that were recorded as counts over a set period 2 years in this instance (individual patients could have more than one circulatory disease event during the recording period). Thus, the Poisson model with equal exposure was considered a reasonable model for these events. Sex, age, ethnicity, and time of year (quarter) were treated as potential individual level variables, while deprivation decile and mean physical activity for each area were considered as potential area-level variables. A hierarchical linear modeling approach, using the Poisson model with equal exposure and a logarithmic link function, was used to model these events.Citation12
To illustrate the potential link between physical inactivity and treatment costs, combined costs for circulatory disease treatments were simply plotted against area-level physical activity. Bootstrap resampling, with 1,000 repetitions, was used to check the sensitivity of this analysis to high-cost events.
Model development
For a Poisson model, the number of events recorded for individual i in neighborhood j is a function of the time interval over which exposure occurs and the event rate λij. The basic model has the form: Link function
Individual-level model
where β0j is the intercept term for neighborhood j, Xkij is the individual level factor k for participant i in neighborhood j and βkj is the regression coefficient for factor k in neighborhood j.
Area-level model: At the area level, the coefficients βkj, in Equationequation 1(1) are modeled as linear combinations of an intercept term, γk0, together with the area-level factors, Wsj, and a random effects term, ukj, as follows:
where γks is the regression coefficient for area-level factor Ws in area j and s is the number of area-level factors included in the model.
EquationEquation 2(2) allows for each individual level coefficient to be modeled either in fixed nonrandomly varying, randomly varying, or a combination of randomly and nonrandomly varying forms. Building of the multilevel model was rather complex. Our approach, for each separate potential area-level index, was to use the nonrandomly varying form of Equationequation 2
(2) (ukj set to 0) as a starting iteration. Level 2 coefficients, γks, which made significant (P < 0.05) explanatory contributions to the variation in the model were retained and further iterations were carried out by adding a randomly varying component (ukj) to test if this significantly improved the model fit. Finally, these separate level 2 models were combined into an overall best-fit multilevel linear regression model, again by retaining only those coefficients making a significant (P < 0.05) contribution to the overall model fit. All analyses were carried out using HLM-6 (Scientific Software International, Lincolnwood IL, USA) using level 1 and level 2 data files created with SPSS software (version 16; IBM, Armonk, NY, USA).
Weighting of area-level data: Weights were applied at the area level to account for population differences in each area. The weighting variable was the estimated residential population in each area, calculated from the average count per residence in each selected LSOA (total population/number of residential addresses) times the number of residences in each output area.
Transformation of variables: The distribution of physical activity scores in the small area sample was positively skewed. Thus, it was necessary to transform this variable (using the square root transformation) for use in the analysis. In addition, we wanted the primary outcomes, event rate ratios, to be provided for meaningful changes in the main factors under consideration. Age was transformed into age decades (division by 10 years) and the transformed physical activity variable was used in its standard normal form (subtract mean from each value and divide by the standard deviation [SD]). Event rate comparisons, therefore, are provided for decade changes in age and a one-standard-deviation change in physical activity.
Results
Characteristics of sample populations
The characteristics of the 761 respondents who took part in the survey to estimate area-level physical activity and the 3,115 patients aged over 16 years who had one or more hospital episode(s) during the 2-year evaluation period are shown in . The age and ethnicity distributions of the samples are similar. Ethnic diversity is low in the city as a whole so categories other than white British have been collapsed into a single category. The patient population has a larger proportion of females, which is probably because this population includes women of childbearing age, who tend naturally to require more hospital care. The distribution among deciles 4–6 (lower deprivation) differs slightly between the two samples but otherwise the two populations have broadly similar characteristics. Also shown in for comparison are the mean numbers of circulatory events for each demographic category.
Table 1 Sample characteristics and summary of circulatory disease events by demographic category
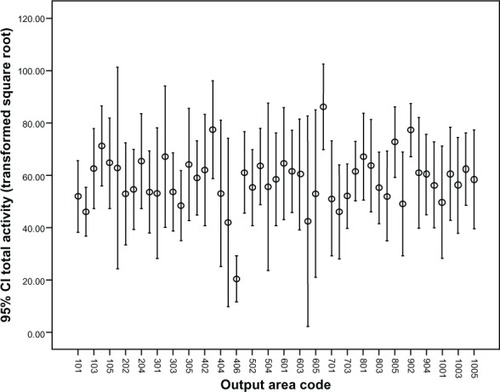
The mean physical activity for each of the 51 OA is illustrated in . Overall, the median number of years for which survey respondents had lived in their area was 16 years. Within areas, the median number of years lived in the area ranged between 4.5 and 32 years, which confirms that our sample, as intended, was drawn from established communities. The number of respondents in each area sample ranged from 5 to 26, with a mean of 15. The intercluster correlation coefficient (variance between areas/total variance within sample) for the data shown in was 0.096, which indicates that a significant proportion of the variation in physical activity was explained by differences between neighborhoods.
Figure 1 Error bar plot of square root transformed total activity by output area.
Physical inactivity and circulatory disease outcomes
Circulatory disease events by small area-level geography Ethnicity and Index of Multiple Deprivation (IMD)Citation7 decile variables were dropped from the analysis at the first iteration as they failed to explain a significant amount of the observed variation in the two outcome measures. The best-fit model for the prediction of circulatory disease events was: Level 1 model
Level 2 model
where SPA is the standard normalized square root transformed total physical activity measure. The five fixed effects and three random effects terms in the model are summarized in .
Table 2 Summary of best-fit model for prediction of circulatory disease events
Females were less likely than males (event rate ratio = 0.593) to have a circulatory disease event. Similarly, those who were more active were less likely (event rate ratio = 0.855) to have a circulatory disease event. In contrast, circulatory disease events were more likely to occur in older age (decade) and later reporting quarters (UK autumn, winter months) with event rate ratios 1.578 and 1.095, respectively.
Hospital treatment costs
Combined hospital costs of treating circulatory disease events in each output area against the mean physical activity in each area are plotted in .
Figure 2 Mean cost per head of population per area plotted against the standardized transformed mean physical activity estimated for each area.
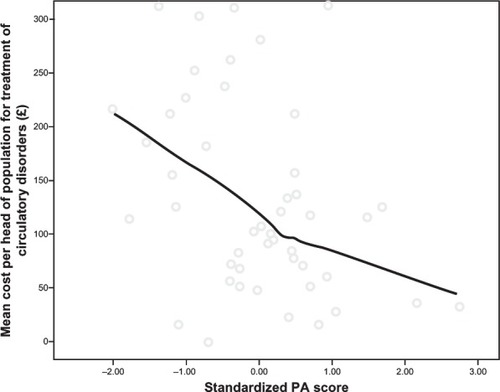
The figure shows a loess fit (a best-fit estimate from the available data using an assumed Gaussian distribution weighting and 80% of the data in each fit point)Citation14 of the cost per estimated head of population per area plotted against the standardized transformed mean physical activity estimated for each area. The least active areas had a mean cost per head of population of ~£200, approximately four times that in the most active areas. The slope of the fit was steeper at lower levels of physical activity, indicating potentially greater health care cost savings by persuading the least active to become more active.
The estimated mean cost per area could be sensitive to relatively infrequent, but high-cost circulatory disease treatment events. We tested for this sensitivity using bootstrap resampling with 1,000 repeat samples from the original set of cost data per area. The mean difference between the bootstrap means was just 0.5% of the mean overall cost per area, indicating that this source of variation was not a problem in this study.
Discussion
Physical inactivity and circulatory disease-related hospital events
The relationship between physical inactivity and cardiovascular disease mortality is well established.Citation15–Citation18 Extending the concept of an association between exposure to physical inactivity (through the area in which you live) and increase in the risk of circulatory disease events, we hypothesized that, if such a relationship existed, then we should expect to see an increase in circulatory disease-related hospital events in areas where population physical activity was low. This relationship was confirmed by the multilevel model fitted to the data and summarized in . An increase in population physical activity level of 1 SD unit on the physical activity measure used here could give rise to ~14.5% reduction in the population risk of having a circulatory disease hospital event. One SD for the transformed physical activity measure used here was 6.4 units. Transforming back to the original physical activity measure, this equates to a difference of approximately 450 MET minutes/week at the lower end of the physical activity range and about 835 MET minutes/week at the higher end. To put this into context, walking, moderate activity, and vigorous activity are classified as having MET intensities of 3.3, 4, and 8 respectively. Since the majority of the population may be considered to be sedentary or lightly active (), from a public health perspective, more would be gained if the least active could be persuaded to increase their physical activity by between 110 and 140 minutes of walking or moderate physical activity. This is in line with national guidelines, which recommend about 30 minutes of moderate physical activity on most days.
Physical inactivity and health care costs
The cost data for each output area in have been normalized by the estimated population in each area. These ranged from 177–401 with a mean of 297. The mean ages of the patient sample in each area ranged from 38–59 years with a mean of 49 years and the sex distribution also varied. We did not have reliable data on the complete age and sex distribution of the 51 OA and so were unable to perform age-and sex-adjusted cost calculations. Nor did we consider, apart from bootstrap resampling, testing the effect of high-cost items on the mean cost per output area, the cost complexity of treatment associated with the specific circulatory disease events reported. We accept that our preliminary analysis here is limited by the available data. Nonetheless, we believe it is important to flag the issue of costs and that there may be significant cost savings to health care services if greater population levels of physical activity can be achieved. This point, again, is not new, but our data, albeit using the crude first analysis reported here, gives some indication of what savings might be feasible. Hospital episode and associated cost data are collected routinely, but rarely linked to other data sets to provide more insightful analysis. We believe that it is important from an epidemiological perspective to explore this potential more fully.
The fit to the data in indicates that physical inactivity may be likely to drive up health care costs for treating circulatory disease. On the other hand, a 1 SD increase in our standardized physical activity measure suggests that a mean cost reduction of £35 per head of population (assuming a linear fit) may be achieved over 2 years. Moreover, the costs for such treatments were markedly lower in areas where population physical activity was higher, raising the possibility that a preventative approach through increasing physical activity could pay for itself.
Limitations
Whilst the findings of this study are encouraging, the following limitations need to be considered. Firstly, the data are cross-sectional in nature. Thus, it is not possible to infer a causal relationship between the physical inactivity and the outcomes used. Secondly, the physical activity measures, although collected using self-report questionnaires completed by randomly sampled individuals living in the areas of interest, are considered at a population level. Conceptually, this is important as the implication is that the living environment itself may determine behaviors that contribute detrimentally to the maintenance of good long-term health. From another perspective, changes to the environment to better support physical activity may result in reduction of the health impact of chronic diseases. Thirdly, the physical activity measures gave only a short-term (in the last week) snapshot of physical activity behavior. Thus, there is a question about how well this snapshot captures the mean physical activity and its variation across each area and over time. This will certainly affect the robustness and generalization of the findings from the small-area study, where sample sizes ranged from 5 to 26 per area. Finally, the relatively small number of area-level units included (51) limited the number of area-level variables and possible interactions that could be included simultaneously to just one or two as well as the sensitivity to detect area-level effects.
There is also the issue of confounding through other factors that may be considered risk factors for circulatory disease, but were not captured during this research. For example, high blood pressure, high cholesterol, smoking, poor diet, and obesity are all established risk factors for circulatory disease events and must have been present to some degree within the population sampled. Thus, the constructed model should be considered relatively simple at this stage due to the nature of the available data. Similarly, our interpretation of the effects of increasing population physical activity should be considered indicative only until more sophisticated data sets are assembled and analyses are performed.
Conclusion
This study supports the use of hospital episode statistics as an outcome measure in the epidemiology of chronic disease. Other than risk factors that present at general practice, these events are the earliest indicator the health care sector receives that the patient has a chronic condition. This, therefore, makes them a potentially sensitive measure for surveillance purposes or to judge the effects of public health interventions to reduce the impact of chronic disease. Furthermore, the data are routinely collected (though not currently widely used in the context proposed here) and associated treatment costs are readily available. The geographic and temporal scales over which data are aggregated are important considerations. The former needs to be small enough in order to be able to identify where the problems are coming from (just as the Broad Street pump was identified in Snow’s famous analysis of the London cholera epidemic of 1854). The latter must balance the competing requirements of being sensitive to change whilst avoiding the reliability issue associated with small sample sizes. In this analysis, increased population levels of physical activity were associated with a reduced chance of having a circulatory disease event and lower treatment costs.
Acknowledgments
The research was partially funded under the National Prevention Research Initiative, managed by the Medical Research Council, UK (MRC Grant G0501287). The opinions expressed are those of the authors and not necessarily those of the Funding Bodies.
Disclosure
The authors report no conflicts of interest in this work.
References
- MorrisJNHeadyJARafflePACoronary heart-disease and physical activity of workLancet19532651111112013110075
- PaffenbargerRSHaleWEWork activity and coronary heart mortalityN Engl J Med19752925455501128551
- Centers for Disease Control and PreventionPhysical Activity and Health: A Report of the Surgeon GeneralAtlanta, GAUS Department of Health and Human Services1996
- Chief Medical Officer’s ReportAt Least Five a Week: Evidence on the Impact of Physical Activity and its Relationship to HealthLondon, UKDepartment of Health2004
- World Health Organizationglobal strategy on Diet, Physical Activity and HealthGeneva, SwitzerlandWorld Health Organization2004
- WarburtonDERNicolCWBredinSSDHealth benefits of physical activity: the evidenceCMAJ200617480180916534088
- Neighbourhood Renewal UnitThe English Indices of Multiple Deprivation 2004 (Revised)London, UKOffice of the Deputy Prime Minister42004
- CochraneTDaveyRCGidlowCJSmall area and individual level predictors of physical activity in urban communities: a multi-level study in Stoke on Trent, EnglandInt J Environ Res Public Health2009665467719440408
- SpeightSStephansenHClemensSSocio-ecological Mapping of Physical Activity Behaviours and Health Outcomes in Deprived Inner-city Communities – Technical ReportLondon, UKNational Centre for Social Research122007
- Karolinska Institute, StockholmInternational Physical Activity Questionnaire – Long version Available from: http://www.ipaq.ki.seAccessed July 7, 2006
- World Health OrganizationInternational Statistical Classification of Diseases and Related Health Problems 10th RevisionGeneva, SwitzerlandWorld Health Organization2007
- RaudenbushSWBrykASHierarchical Linear Models: Applications and Data Analysis Methods2nd edNewbury Park, CASage Publications2002309317
- Human Energy Requirements: Report of a joint FAO/WHO/UNU expert consultationRome, ItalyFood and Agricultural Organization of the United Nations2004 Table 5.1
- ClevelandWSDevlinSJLocally weighted regression: an approach to regression analysis by local fittingJ Am Stat Assoc198883596610
- Physical Activity Guidelines CommitteePhysical Activity Guidelines Advisory Committee ReportWashington, DCDept of Health and Human Services2008
- NoconMHiemannTMuller-RiemenschneiderFAssociation of physical activity with all-cause and cardiovascular mortality: a systematic review and meta-analysisEur J Cardiovasc Prev Rehabil20081523924618525377
- SofiFCapalboACesariFPhysical activity during leisure time and primary prevention of coronary heart disease: an updated meta-analysis of cohort studiesEur J Cardiovasc Prev Rehabil20081524725718525378
- ShiromaEJLeeI-MPhysical activity and cardiovascular health: lessons learned from epidemiological studies across age, gender and race/ethnicityCirculation201012274375220713909