
 ?Mathematical formulae have been encoded as MathML and are displayed in this HTML version using MathJax in order to improve their display. Uncheck the box to turn MathJax off. This feature requires Javascript. Click on a formula to zoom.
Abstract
Background
Patients treated with radiotherapy are at risk of developing a second cancer during their lifetime, which can directly impact treatment decision-making and patient management. The aim of this study was to qualify and compare the secondary cancer risk (SCR) after intensity-modulated radiation therapy (IMRT) and volumetric-modulated arc therapy (VMAT) in nasopharyngeal carcinoma (NPC) patients.
Patients and methods
We analyzed the treatment plans of a cohort of 10 NPC patients originally treated with IMRT or VMAT. Dose distributions in these plans were used to calculate the organ equivalent dose (OED) with Schneider’s full model. Analyses were applied to the brain stem, spinal cord, oral cavity, pharynx, parotid glands, lung, mandible, healthy tissue, and planning target volume.
Results
We observed that the OED-based risks of SCR were slightly higher for the oral cavity and mandible when VMAT was used. No significant difference was found in terms of the doses to other organs, including the brain stem, parotids, pharynx, submandibular gland, lung, spinal cord, and healthy tissue. In the NPC cohort, the lungs were the organs that were most sensitive to radiation-induced cancer.
Conclusion
VMAT afforded superior results in terms of organ-at-risk-sparing compared with IMRT. Most OED-based second cancer risks for various organs were similar when VMAT and IMRT were employed, but the risks for the oral cavity and mandible were slightly higher when VMAT was used.
Introduction
Nasopharyngeal carcinoma (NPC) treatment modalities, such as intensity-modulated radiation therapy (IMRT) and volumetric-modulated arc therapy (VMAT), have been used widely to improve local control rates.Citation1 Because over 80% of NPC patients now show long-term survival after treatment, concern has grown over serious adverse treatment-related late complications, such as secondary cancers.Citation2 Secondary cancer risk (SCR) is a non-negligible late complication experienced by some NPC patients, especially younger patients, and correlates highly with the development of treatment-associated secondary tumors.Citation3,Citation4 The importance of risk estimation and careful treatment planning for NPC has been emphasized; these factors need to be investigated carefully.
Most radiation-induced cancers are clinically observed in the in-field region during the planning process.Citation5 In this region, the SCR is highest at the edge of the irradiated volume and decreases gradually with increasing distance from the edge.Citation6 The frequency of secondary malignancy in distant tissues receiving doses <0.1 Gy is low, but it is associated with the locally absorbed dose.Citation7 In-field structures receiving radiation doses within 5% of the prescribed dose (as revealed by dose–volume histogram [DVH] data) absorb radiation differently depending on the part of the organ affected.Citation8
The isodose curves of IMRT and VMAT are more similar than those of traditional techniques, although they produce more scattered, or secondary, particles that are likely to increase the risk of secondary cancers.Citation9 These techniques involve more beams and thus a larger volume of normal tissue is exposed to a low dose of radiation. Exposure of a larger volume of non-target tissue in the in-field region may have a negative impact in terms of long-term toxicity.
SCRs have been well studied and thoroughly assessed.Citation10–Citation12 When a non-uniform dose model is used to deliver medium-to-high doses of radiation, it has been suggested that risk evaluation should be included, considering biological phenomena such as cell sterilization, mutation, and repopulation.Citation13,Citation14 Schneider et al fitted data from patients with Hodgkin’s disease to develop a complete model that considered the balance between cell death and repopulation.Citation15
To our knowledge, no previous report has compared SCR values in NPC patients between VMAT and IMRT. The aim of this study was to quantify and compare SCR after IMRT and VMAT for NPC, by using the concepts of organ equivalent dose (OED), excess absolute risk (EAR), and lifetime attributable risk (LAR) for dose–response modeling.
Patients and methods
Patients
We retrospectively enrolled 10 consecutive NPC patients who were curatively treated by IMRT or VMAT. The original radiotherapy plans, for 4 patients treated by IMRT and 6 treated by VMAT, were re-planned using the other treatment mode. Thus, we created 20 plans (VMAT: IMRT=10:10) to evaluate the risks of secondary malignancies.
Their median age was 45 years (range: 35–61). The clinical stage distribution of the cohort was I–III according to the American Joint Committee on Cancer (6th edition) staging system. We selected patients of different ages at the time of treatment to investigate the age dependence of SCR.
Ethics statement
This study was approved by the Chang Gung Memorial Hospital institutional review board (IRB 201600220B0); the patient informed consent was waived by the institutional review board; and all experiments were performed in accordance with relevant international and national guidelines and regulations.
Treatment planning
The IMRT and VMAT treatment plans were created and optimized using the simultaneous integrated boost technique, having been planned originally using PinnacleCitation3 software (version 9.2; Philips Medical Systems, Andover, MA, USA). Patients were immobilized from head to shoulders using commercially available thermoplastic masks and individually customized bite blocks. Computed tomographic images (2.5-mm slice thickness) were acquired from the top of the vertex to the level of the carina with a LightSpeed RT16 instrument (GE Medical Systems, Milwaukee, WI, USA); each slice was 512×512 pixels and had dimensions of 0.9375×0.9375×2.5 mm3. In all cases, the planning target volume (PTVs) and the organs-at-risk (OARs) were planned and identified by the radiation oncologists. In line with the Radiation Therapy Oncology Group 0225 guidelines, the gross tumor volume (GTV) covered the visible primary tumor, neck nodes >1 cm in diameter, and nodes with necrotic centers.Citation16 The clinical target volume (CTV) was defined to include an isotropic margin of 1.5 cm around the GTV, and encompassed both any microscopically evident spread of disease and a prophylactic neck region. The PTV included the CTV extended by 3 mm in all dimensions, to account for patient set-up error and motion uncertainties. The prescribed doses were 69.3, 59.4, and 52.8 Gy, delivered in 33 fractions, covering the GTV, any region with microscopic disease, and a prophylactic neck region, respectively. Common OARs include the brain stem, lens, spinal cord, oral cavity, pharynx, parotid glands, mandible, and healthy tissue (total exposed volume minus PTV). Because radiation-induced secondary malignant neoplasms are generally thought to occur in the beam-bordering region, defined as the area within 8 cm of the radiation therapy (RT) field edge; this region was considered to contain healthy tissue.Citation7 In line with the RT Oncology Group 0225 protocol, the dose distribution of PTV69.3 was used to evaluate dose conformity and homogeneity in the target.Citation16 The homogeneity index (HI) was defined as follows: HI=D5/D95, where D5 and D95 represent the dose delivered to 5% and 95% of the volume, respectively. The conformity index (CI) is given by VPTV×VTV/TVPV, where VTV is the treatment volume of prescribed isodose lines, VPTV is the volume of the PTV, and TVPV is the volume of VPTV within VTV. The integral dose (Gy·L) for healthy tissue is defined as the integral of the absorbed dose extended over all voxels, excluding those within the target volume.Citation1 The SmartArc planning system (version 9.0; Philips, Fitchburg, WI, USA) was used for VMAT planning with dual 360° dynamic arcs. IMRT plans were created using a standard 7- or 8-field coplanar arrangement, followed by direct machine parameter optimization. A convolution superposition algorithm was used and heterogeneity corrections were applied. A 6 MV linear accelerator system was used (Varian Medical Systems, Palo Alto, CA, USA).
Statistical analyses
The 2-tailed Wilcoxon signed-rank test was used to compare differences between the DVH parameters of the IMRT and VMAT plans (each pair of patient-specific DVH values was compared). The level of statistical significance was set at p=0.05. SPSS software (version 22.0; SPSS Inc., Chicago, IL, USA) was used for all analyses.
Risk assessment
To calculate SCRs, DVHs were extracted from the planning system (PinnacleCitation3). We employed the OED concept when measuring non-homogeneous organ dose distributions in high-dose regions.Citation17 This method has been used in several previous studies to estimate in-field organ doses.Citation14,Citation18 We defined high-risk regions for the development of secondary malignancies as those within 8 cm of the field edge.Citation7,Citation8 This considers the effects of cell sterilization and repopulation at higher doses. The OED for carcinoma induction 1) was used to approximate the risk for the development of radiation- induced cancer within the OARs. A model of sarcoma induction 2) was employed to analyze the mandible, healthy tissue, and treatment region. By reference to the repopulation parameter, R, the dose per fraction, dF, the total dose, D, and a cell kill parameter, α, the OED can be derived as follows:Citation15
For each DVH bin number, i, in an organ, we can thus define a risk equivalent dose (RED), which allows definition of a dose–response relationship for a point dose rather than an organ dose. The sum of the RED values for all voxels, divided by the number of voxels, N, yields the OED, where V is the total organ volume. In this study, we applied Schneider’s full model in which R=0.5.
The EAR (excess cancers per 10,000 person-years [PYs]) was defined as the product of the OED and the initial slope of the dose–response curve in the low-dose region Equation(4)(4) . The initial slope was determined using the parameterization method of Preston et al by reference to the Biological Effects of Ionizing Radiation (BEIR) report; this is based on data from atomic bomb survivors.Citation19
The organ-specific model parameters γe, γa, and β (in excess cases per 10,000 PY) were taken from Schneider et al and are listed in .Citation15 Parameter β represents the initial slope of the dose–response model at a low dose, and γe and γa are age-modifying parameters (note that this β is different from the β used in the cell survival curve equation [3]). Parameters e and a represent the age at exposure and the attained age, respectively, and we considered the age (parameter e) at post-treatment to be 20 years.Citation14 S is a gender-specific factor and was set to +0.17 and −0.17 for females and males, respectively.Citation20
Table 1 Patients’ characteristics and treatment parameters
Table 2 Risk parameters for all tissues
The LAR, which represents the lifetime likelihood (%) of a second malignancy (in terms of a multiple of the baseline risk) was calculated using Equationequation (5)(5) . LAR is an effective measure of SCR, as the LAR considers both patient age at the time of treatment and the predicted lifespan:Citation13
The integration of EAR was performed over an attained age from a latent period of solid cancer induction after the exposure. L (5 years) is the latency period for solid cancer induction up to 70 years of age.Citation21 The S(a) and S(e) represent the surviving population at the time of exposure and the attained age, respectively.Citation22 The probability of survival was obtained from a life table of the Taiwanese population.Citation23
Results
Patient characteristics and treatment parameters are listed in , and risk parameters for the SCR models are shown in . IMRT and VMAT provided equally good PTV coverage and had CI and HI values close to 1 (CI: 1.20 versus 1.14; HI: 1.08 versus 1.06, for IMRT and VMAT, respectively). The dose characteristics of the 2 techniques are shown in . VMAT gave superior results to IMRT in terms of OAR sparing. For the OARs evaluated, the eyes showed the largest reduction in mean dose, by 11.93% from IMRT to VMAT. shows the SCR data; we observed that the OED-based risks of SCR were slightly higher for the oral cavity and mandible when VMAT was employed, compared with IMRT. No significant difference was found for any other organ, including the brain stem, parotids, pharynx, submandibular gland, lung, spinal cord, and healthy tissue.
Table 3 Dosimetric index
Table 4 Summary of the comparison results for PTV and OARs
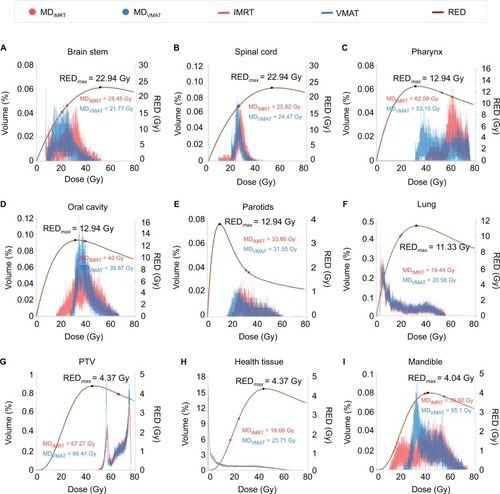
represents the relationship between the different DVH plots and RED models. We observed differences in SCR depending on the correlation between the volume exposed in the different DVHs and the regions of maximal distribution in the dose–response curves. For example, as shown in , the oral cavity in VMAT was typically exposed to larger low-dose volumes, which would likely result in a higher SCR, as reflected in the RED curve (right side of maximum dose–response in the RED curve [REDmax]). We could ascertain the SCR quickly by noting whether the larger dose volumes were on the right or left side of REDmax.
Figure 1 DVHs of OARs and REDs for IMRT and VMAT.
Notes: (A) Brain stem, (B) spinal cord, (C) pharynx, (D) oral cavity, (E) parotids, (F) lung, (G) PTV, (H) health tissue, and (I) mandible. The brown lines indicate RED curves of PTVs and OARs based on the study by Schneider et al.Citation15 The red lines are the differential DVH curves of PTVs and OARs for IMRT. The blue lines are the differential DVH curves of PTVs and OARs for VMAT. SCR can be assessed quickly according to whether larger dose volumes are located to the right or left of REDmax.
Abbreviations: DVH, dose–volume histogram; IMRT, intensity-modulated radiotherapy; MD, mean dose, Gy; OAR, organs-at-risk; PTV, planning target volume; R, repopulation parameter; RED, risk-equivalent dose, Gy; REDmax, maximum point of the RED curve; SCR, secondary cancer risk; VMAT, volumetric-modulated arc therapy.
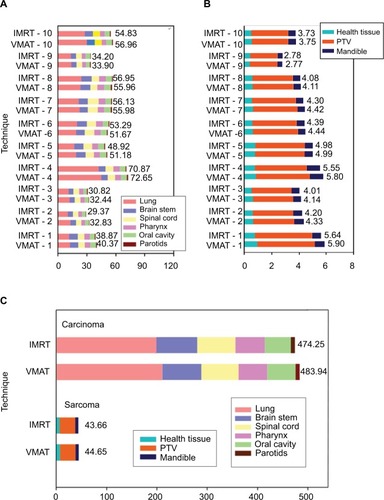
illustrates the cumulative EAR of the investigated OARs. The total cumulative risk for all organs was about 1.22–0.87 times higher in VMAT compared with IMRT (). We found that the integral monitor unit (MU) values of 10 patients were 5259 and 5428 for VMAT and IMRT, respectively (). Although VMAT delivered slightly lower MU than IMRT, the SCR was increased slightly for VMAT.
Figure 2 Cumulative EAR of cancer for all OARs, stratified by the two techniques of IMRT and VMAT.
Notes: (A) EAR of carcinoma for patients 1–10 (numbered by age: younger to older), (B) EAR of sarcoma for patients 1–10, (C) cumulative EAR of carcinoma and sarcoma for the 10 patients. The results illustrate that SCR is increased slightly with VMAT versus IMRT.
Abbreviations: EAR, excess absolute risk; IMRT, intensity-modulated radiotherapy; IMRT-1 to IMRT-10, patients 1–10; OAR, organs-at-risk; PTV, planning target volume; SCR, secondary cancer risk; VMAT, volumetric-modulated arc therapy; VMAT-1 to VMAT-10, patients 1–10.
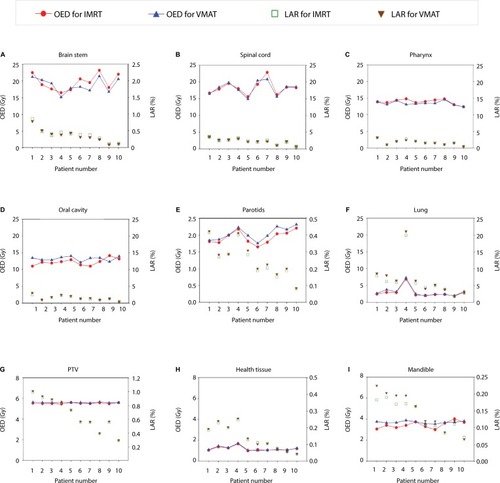
shows the LAR of cancer and OEDs for all OARs, stratified by technique. It shows that the younger the patient is at the time of radiation treatment, the higher the LAR is for future second cancer occurrence. From , the OED:LAR ratio was lowest for the lung. Thus, among OARs, the lung may have a higher SCR at the same radiation dose.
Figure 3 The LARs and OEDs for all OARs, stratified by the two techniques of IMRT and VMAT.
Notes: (A) Brain stem, (B) spinal cord, (C) pharynx, (D) oral cavity, (E) parotids, (F) lung, (G) PTV, (H) health tissue, and (I) mandible. Patients 1–10 are numbered by age (younger to older). The results show that the younger a patient is at the time of radiation treatment, the higher the LAR is for a future secondary cancer.
Abbreviations: IMRT, intensity-modulated radiotherapy; LAR, lifetime attributable risk; OAR, organs-at-risk; OED, organ equivalent doses; PTV, planning target volume; VMAT, volumetric-modulated arc therapy.
Discussion
In terms of PTV coverage and OAR sparing, whether VMAT is inferior, equivalent, or superior to IMRT depends on the complexity of the target volume and the number of VMAT arcs. Our previous study compared 4 different techniques – 7- and 18-field fixed beam IMRT, and single- and dual- modulated arc VMAT – with the SmartArc treatment planning system (Philips) for NPC patients, and showed that dual-modulated arc VMAT yielded superior dosimetric results compared with single-modulated arc VMAT and IMRT, without sacrificing delivery efficiency.Citation1,Citation24 In the current study, IMRT and VMAT provided equally good PTV coverage and similar CI and HI values, although VMAT had superior results in terms of OAR sparing. However, theoretical concerns regarding SCR analysis have been raised: whether VMAT is inferior, equivalent, or superior to IMRT depends on whether low-dose radiation is distributed to non-target healthy tissue. The higher non-target tissue doses delivered by VMAT may increase the number of secondary malignancies.Citation25
In this study, we investigated differences in the SCR associated with standard IMRT versus VMAT for NPC cases. We found SCR with VMAT was slightly higher than that with IMRT. We observed that the increased distribution of low-dose radiation seen with VMAT was the leading contributor to secondary malignancies. Although VMAT gave superior results to IMRT in terms of PTV coverage and OAR sparing, the higher SCR must be taken into consideration, which might be caused by the distribution of low-dose radiation to non-target healthy tissue. In a study by Ardenfors et al, differences in SCR between IMRT and conformal RT were assessed for head and neck cancers.Citation26 Their results showed that the risk was similar between the 2 techniques. They suggested that the dose redistribution characteristic of IMRT resulted in a redistribution of the risk of SCR among individual tissues. When conformal dose distribution is achieved, more secondary particles are likely, increasing the risk of secondary cancer.
In epidemiological studies, radiation-induced malignancy may be influenced by factors such as the radiation dose and age at initial exposure.Citation27 In this study, patients were subclassified by age (0–40 years, 4 patients; 40–50 years, 3 patients; and >50 years, 3 patients). We calculated the average SCR for each age group according to the LAR analysis. We found a 2- to 3-fold greater difference in patients aged <40 years compared with those aged >50 years. SCR is a non-negligible late complication encountered by younger patients, especially long-term survivors of NPC.
In the BEIR report, the lung had a higher β value versus all other organs, meaning that it is sensitive to radiation, especially at low doses.Citation21 In a similar report by Kim et al, hepatocellular carcinoma (HCC) treatment was associated with a high SCR in the healthy lung.Citation28 Preston et al suggested that the lung might be associated with a higher number of radiation-associated cancers versus other organs.Citation19 Taylor et al conducted a systematic literature review of breast cancer patients.Citation29 In terms of lung cancer incidence over the 10-year period following radiotherapy, they reported an excess rate ratio of 0.11 per Gy whole-lung dose. Although carcinoma can be difficult to identify, we should pay particular attention to carcinomas near a treated region given their secondary malignancy potential. In NPC cases, we should note whether the SCR is higher in the lung close to the treatment field when the scattered dose is higher.
In this study, SCR increased depending on the radiation dose received by OARs. To calculate the risk of non-homogeneous doses to organs in the high-dose region, the concept of RED was invoked to consider the dose–response of organs directly, which, by definition, is proportional to the SCR. Murray et al illustrated the relationship between DVH curves and RED with reference to Schneider’s models.Citation30 In this study, we observed increased risks in regions with non-homogeneous dose distributions. To analyze the association between RED and DVH, we superimposed RED on different DVH curves for 1 representative patient (). The dose to the oral cavity was distributed on the right side of the maximum dose–response of the RED curve (REDmax; ). Before REDmax, the rising curve slope was steeper than the slope after REDmax was attained. This was shown by the lower mean dose, but higher SCR, for VMAT versus IMRT for the oral cavity. The SCR depended on the dose–volume distribution of various locations described by the RED curve. We could estimate the SCR directly and efficiently by using the DVH differential distribution plots superimposed on the RED curve.
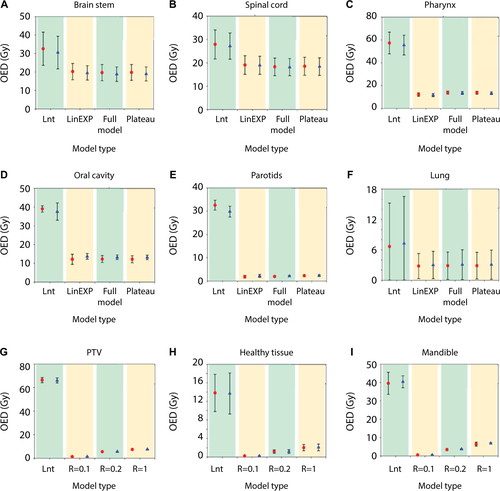
For therapeutic doses >2 Gy, the full Schneider model was used, which includes linear-exponential and plateau dose–response functions, thus taking cell killing and repopu-lation effects into consideration. In addition to using the full Schneider model to construct , we employed the same model to compare OEDs among 4 different models (Supplementary material). On comparing these models, which differed in terms of the degree of cell killing and sterilization (R), we observed larger differences for sarcomas between the non-linear models; this is because the simple models were based on linear approximations of risk, derived from atomic bomb survivor data, of radiation-induced cancers from radiotherapy.Citation31 Concerning sarcoma induction, the assumption was that the tissue cells were not dividing and only the repopulated cells could transform into tumor cells in response to radiation.Citation32 Moreover, the difference in the rate of repopulation, during the treatment period and during recovery from radiation damage, between tumor cells and normal tissue has been shown to increase the benefit of fractionated radiotherapy. Thus, SCR was higher for sarcomas of the mandible showing full repopulation than for the PTV. This is consistent with observations demonstrating that the higher SCR seen in osteosarcoma was associated with a pathological diagnosis of radiation-induced sarcoma of the head and neck.Citation12
Because of the lack of other comprehensive data, we decided to use the parameters fitted using the Schneider’s model, although this could potentially have caused an overestimation of cancer incidence due to the genetic susceptibility of Hodgkin patients to cancerCitation13. Thus, our absolute risk estimations might be too conservative. However, estimated relative risks would be less affected. In a previous report on SCR with VMAT, Abo-Madyan et al estimated the risk of developing a solid secondary cancer after 3-dimensional conformal radiotherapy, IMRT, and VMAT for breast cancer.Citation9 SCR after IMRT was lower than after VMAT in linear, linear-exponential, and plateau models. Kim et alCitation28 compared the SCR after therapeutic radiation doses delivered to HCC patients during IMRT, VMAT, and tomotherapy. They found that HCC treatment was associated with a higher SCR with VAMT versus IMRT, especially in the lung. Moteabbed et al calculated the SCRs for carcinoma and sarcoma in pediatric brain tumor patients.Citation13 The SCRs for various organs were slightly higher when VMAT rather than IMRT was employed.
Our study was limited by the small number of patients. To improve the performance of current risk models, and reduce uncertainties in model parameters, the models used currently to estimate SCR may need further refinement to allow more precise prediction of the risk of secondary cancer.
Conclusion
IMRT and VMAT afforded equally good PTV coverage with similar CI and HI values, but VMAT was superior to IMRT in terms of OAR-sparing VMAT, exhibits a highly conformal dose distribution using dual-arc therapy, in which many control points per arc are used to direct radiation to the target. However, undesired low-dose radiation may spread to non-target healthy tissue increasing the number of secondary malignancies. We found that the most OED-based SCRs were similar when VMAT and IMRT were applied. However, the SCRs for the oral cavity and mandible were slightly higher when VMAT was used. More samples are needed to improve SCR prediction.
Acknowledgments
We thank Chun-Kuan Wu for statistical technical supports. This study was supported financially, in part, by grant from the Ministry of Science and Technology (MOST) of the Executive Yuan of the Republic of China, (MOST-106– 2221-E-151-010). The abstract of this paper was presented at the 24th Asia Pacific Cancer Conference 2017, Radiation-Induced Second Malignancies Evaluation Following Radiotherapy for Nasopharyngeal Carcinoma Patients as a poster presentation with interim findings.
Supplementary material
Figure S1 OEDs of four models (two IMRT, two VMAT) differing in the degree of cell killing and sterilization (R).
Notes: (A) Brain stem, (B) spinal cord, (C) pharynx, (D) oral cavity, (E) parotids, (F) lung, (G) PTV, (H) health tissue, and (I) mandible. Red indicates IMRT and blue indicates VMAT.
Abbreviations: Full, Schneider’s full model; IMRT, intensity-modulated radiotherapy; LinEXP, linear-exponential model; Lnt, linear model; OED, organ equivalent doses; Plateau, plateau model; PTV, planning target volume; R, repopulation parameter; VMAT, volumetric-modulated arc therapy.
Author contributions
HFL supervised the project, had given valuable advices on the proceeding of this work, and designed the concept and the experiment method of the research, wrote the manuscript. JHL, PJC and HMT provided technical support on data collection and analysis. HCC and HCH supported the characterization of the samples, had provided valuable suggestions, and revised the manuscript. TFL supervised the project, had given valuable advices on the proceeding of this work, designed the concept and the experiment method of the research, and revised the manuscript. All authors contributed toward data analysis, drafting and revising the paper and agree to be accountable for all aspects of the work.
Disclosure
The authors report no conflicts of interest in this work.
References
- LeeTFChaoPJTingHMComparative analysis of SmartArc-based dual arc volumetric-modulated arc radiotherapy (VMAT) versus intensity-modulated radiotherapy (IMRT) for nasopharyngeal carcinomaJ Appl Clin Med Phys2011124358722089015
- SunXSuSChenCLong-term outcomes of intensity-modulated radiotherapy for 868 patients with nasopharyngeal carcinoma: an analysis of survival and treatment toxicitiesRadiother Oncol2014110339840324231245
- ChanJYToVSWongSTWeiWIRadiation-induced squamous cell carcinoma of the nasopharynx after radiotherapy for nasopharyngeal carcinomaHead Neck201436677277523616235
- StokkevagCHEngesethGMYtre-HaugeKSEstimated risk of radiation-induced cancer following paediatric cranio-spinal irradiation with electron, photon and proton therapyActa Oncol20145381048105725017376
- SethiRVShihHAYeapBYSecond nonocular tumors among survivors of retinoblastoma treated with contemporary photon and proton radiotherapyCancer2014120112613324122173
- DialloIHaddyNAdjadjEFrequency distribution of second solid cancer locations in relation to the irradiated volume among 115 patients treated for childhood cancerInt J Radiat Oncol Biol Phys200974387688319386434
- HarbronRWFeltbowerRGGlaserALilleyJPearceMSSecondary malignant neoplasms following radiotherapy for primary cancer in children and young adultsPediatr Hematol Oncol201431325926724087931
- HowellRMScarboroSBTaddeiPJKrishnanSKrySFNewhauserWDMethodology for determining doses to in-field, out-of-field and partially in-field organs for late effects studies in photon radiotherapyPhys Med Biol201055237009702321076193
- Abo-MadyanYAzizMHAlyMMSecond cancer risk after 3D-CRT, IMRT and VMAT for breast cancerRadiother Oncol2014110347147624444525
- Berrington de GonzalezAGilbertECurtisRSecond solid cancers after radiation therapy: a systematic review of the epidemiologic studies of the radiation dose-response relationshipInt J Radiat Oncol Biol Phys201386222423323102695
- ThiagarajanAIyerNGRadiation-induced sarcomas of the head and neckWorld J Clin Oncol20145597398125493233
- ZhuWHuFZhaoTWangCTaoQClinical characteristics of radiation-induced sarcoma of the head and neck: review of 15 cases and 323 cases in the literatureJ Oral Maxillofac Surg201674228329126275593
- MoteabbedMYockTIPaganettiHThe risk of radiation-induced second cancers in the high to medium dose region: a comparison between passive and scanned proton therapy, IMRT and VMAT for pediatric patients with brain tumorsPhys Med Biol201459122883289924828559
- PaganettiHAtharBSMoteabbedMAdamsJSchneiderUYockTIAssessment of radiation-induced second cancer risks in proton therapy and IMRT for organs inside the primary radiation fieldPhys Med Biol201257196047606122968191
- SchneiderUSumilaMRobotkaJSite-specific dose-response relationships for cancer induction from the combined Japanese A-bomb and Hodgkin cohorts for doses relevant to radiotherapyTheor Biol Med Model201182721791103
- LeeNHarrisJGardenASIntensity-modulated radiation therapy with or without chemotherapy for nasopharyngeal carcinoma: radiation therapy oncology group phase II trial 0225J Clin Oncol200927223684369019564532
- SchneiderUZwahlenDRossDKaser-HotzBEstimation of radiation-induced cancer from three-dimensional dose distributions: concept of organ equivalent doseInt J Radiat Oncol Biol Phys20056151510151515817357
- YoonMShinDHKimJCraniospinal irradiation techniques: a dosimetric comparison of proton beams with standard and advanced photon radiotherapyInt J Radiat Oncol Biol Phys201181363764620932690
- PrestonDLRonETokuokaSSolid cancer incidence in atomic bomb survivors: 1958–1998Radiat Res2007168116417722996
- SchneiderUWalshLCancer risk estimates from the combined Japa-nese A-bomb and Hodgkin cohorts for doses relevant to radiotherapyRadiat Environ Biophys200847225326318157543
- CouncilNRHealth Risks from Exposure to Low Levels of Ionizing Radiation: BEIR VII Phase 27National Academies Press2006
- KellererAMNekollaEAWalshLOn the conversion of solid cancer excess relative risk into lifetime attributable riskRadiat Environ Bio-phys2001404249257
- YueJCWangHCUsing life table techniques to model mortality rates for small populationsPaper presented at: SOA Living to 100 Symposium2017
- LeeTFTingHMChaoPJFangFMDual arc volumetric-modulated arc radiotherapy (VMAT) of nasopharyngeal carcinomas: a simultaneous integrated boost treatment plan comparison with intensity-modulated radiotherapies and single arc VMATClin Oncol (R Coll Radiol)201224319620721752615
- WolffDStielerFWelzelGVolumetric modulated arc therapy (VMAT) vs. serial tomotherapy, step-and-shoot IMRT and 3D-conformal RT for treatment of prostate cancerRadiother Oncol200993222623319765846
- ArdenforsOJosefssonDDasuAAre IMRT treatments in the head and neck region increasing the risk of secondary cancers?Acta Oncol20145381041104724983652
- WeiZXieYXuJRadiation-induced sarcoma of head and neck: 50 years of experience at a single institution in an endemic area of nasopharyngeal carcinoma in ChinaMed Oncol201229267067621259056
- KimDWChungKChungWKRisk of secondary cancers from scattered radiation during intensity-modulated radiotherapies for hepatocellular carcinomaRadiat Oncol2014910924886163
- TaylorCCorreaCDuaneFKEstimating the risks of breast cancer radiotherapy: evidence from modern radiation doses to the lungs and heart and from previous randomized trialsJ Clin Oncol201735151641164928319436
- MurrayLJThompsonCMLilleyJRadiation-induced second primary cancer risks from modern external beam radiotherapy for early prostate cancer: impact of stereotactic ablative radiotherapy (SABR), volumetric modulated arc therapy (VMAT) and flattening filter free (FFF) radiotherapyPhys Med Biol20156031237125725590229
- SchneiderUModeling the risk of secondary malignancies after radiotherapyGenes (Basel)2011241033104924710304
- SchneiderUMechanistic model of radiation-induced cancer after fractionated radiotherapy using the linear-quadratic formulaMed Phys20093641138114319472619