
Abstract
Objective
The activities of four cytochrome P3A (CYP3A) subfamily members (CYP3A4, CYP3A5, CYP3A7, and CYP3A43) are well documented in drug metabolism. However, the association between CYP3A subfamily members and hepatocellular carcinoma (HCC) remains unclear. This study investigated the prognostic value of CYP3A subfamily mRNA expression levels with HCC prognosis.
Materials and methods
Data from a total of 360 HCC patients were retrieved from The Cancer Genome Atlas database, and data from 231 HCC patients were retrieved from the Gene Expression Omnibus database. Kaplan–Meier analysis and Cox regression models were utilized to determine median survival, overall survival, and recurrence-free survival. Hazard ratios and 95% CI were calculated.
Results
Low expression of CYP3A4, CYP3A5, and CYP3A43 in the tumor tissue was associated with short median survival (crude p=0.004, 0.001, and 0.001; adjusted p=0.022, 0.005, and 0.013, respectively). Joint-effects combination analysis of CYP3A4, CYP3A5/CYP3A4, CYP3A43/CYP3A5, and CYP3A43 revealed that high expression groups of two genes (group C, group c, group 3) were associated with a reduced risk of death, as compared to low expression of two genes (group A, group a, group 1), and the adjusted p values were 0.001, 0.004, and 0.001, respectively. Joint-effects analysis of CYP3A4, CYP3A5, and CYP3A43 showed that groups III and IV had a reduced risk of death, as compared to group I (adjusted p=0.024 and 0.002, respectively).
Conclusion
CYP3A4, CYP3A5, and CYP3A43 mRNA expression levels are potential prognostic markers of HCC.
Introduction
Liver cancer is the second leading cause of cancer-related death worldwide with an estimated 782,500 new diagnoses and 745,500 deaths occurring worldwide in 2012. Of these cases, roughly 50% were reported in China alone.Citation1 In 2015, liver cancer was the fourth most commonly diagnosed cancer in Chinese men.Citation2 Hepatocellular carcinoma (HCC) is the most common type of liver cancer, accounting for about 85%–90% of cases, and has a very low 5-year survival rate of only 7%.Citation3,Citation4 Many etiological factors have been associated with HCC, including infection with hepatitis B and C viruses, cirrhosis, non-alcoholic fatty liver diseases, aflatoxin exposure, diabetes mellitus, obesity, excessive alcohol ingestion, hemochromatosis, and various other metabolic factors.Citation5 Despite the significant benefits of many curative procedures (e.g., surgical resection, liver transplantation, transarterial chemoembolization, radiofrequency ablation, percutaneous ethanol injection, transarterial radiation, microwave ablation, and systemic therapy), the long-term survival rate of HCC remains unsatisfactory.Citation6 Hence, further studies are required to identify new biomarkers to better assess survival and tumor progression in HCC.Citation6
The cytochrome P450 (CYP450) enzymes are a group of membrane-bound proteins that catalyze the oxidation of endobiotics and xenobiotics.Citation7 The CYP3A subfamily is the most important group of enzymes of the CYP450 superfamily in humans as they metabolize a variety of clinically available drugs.Citation8 The CYP3A subfamily consists of four differentially regulated members: CYP3A4, CYP3A5, CYP3A7, and CYP3A43.Citation7 Expression levels of CYP3A5, CYP3A7, and CYP3A43 are usually lower than that of CYP3A4.Citation9 CYP3A4 is the most predominantly expressed CYP in the human liver in response to the exposure to several drugs.Citation8 CYP3A7 is the major form of CYP in the fetal liver and its role has been explored in adverse drug reactions and interindividual differences in drug metabolism.Citation10 CYP3A43 is the most recently identified member of the CYP3A subfamily and is, thus, less well studied than the other three members.Citation11 Owing to its low expression levels in both the fetal and adult liver, CYP3A43 cannot be isolated by conventional protein purification approaches.Citation11
In addition, many investigations have explored the relationships between these genes and many cancers. Specifically, high expression of CYP3A4 may be associated with metastasis of Ewing’s sarcoma.Citation12 CYP3A4 expression greater than the median level was associated with increased neuroblastoma mortality, and homozygous mutants of CYP3A5 *3/*3 were associated with a 4.3-fold greater risk of neuroblastoma mortality.Citation13 CYP3A5 acts as a tumor suppressor gene in HCC via regulation of the mTORC2/Akt signaling pathway.Citation14 CYP3A7 is reportedly overexpressed in HCC,Citation15,Citation16 and genetic variants of CYP3A7*1C have been associated with adverse outcomes in chronic lymphocytic leukemia (CLL), breast cancer, and lung cancer.Citation17 Carriers of the CYP3A43 G-allele exhibited a significant 5-fold increase in mortality of early-onset prostate cancer.Citation18
Of the four members of the CYP3A subfamily, previous studies confirmed that only CYP3A5 and CYP3A7, but not CYP3A4 and CYP3A43, were associated with HCC. Therefore, the aim of the present study was to evaluate the prognostic values of the mRNA expression levels of all members of the CYP3A subfamily in HCC.
Materials and methods
Patient data collection
First, the Metabolic gEne RApid Visualizer database (http://merav.wi.mit.edu/) was accessed on October 15, 2017 to determine whether any of the four members of the CYP3A subfamily are differentially expressed between normal liver tissues and primary liver tumors.Citation19 Then, the Search Tool for the Retrieval of Interacting Genes/Proteins (STRING) database was accessed on September 10, 2017 to construct protein–protein interaction networks between CYP3A subfamily members and other proteins.Citation20
Then, the OncoLnc (http://www.oncolnc.org/; accessed October 15, 2017) and The Cancer Genome Atlas (TCGA; http://tcga-data.nci.nih.gov/tcga; accessed October 15, 2017) databases were accessed to obtain the expression levels of CYP3A4, CYP3A5, CYP3A7, and CYP3A43 at 50% cutoff values. The presented results are based, in part, on a previous study of the TCGA database.Citation21
Data from a total of 360 HCC patients, which included sex, race, age, body mass index, TNM stage, survival time, and survival status, were collected. Gene expression data were downloaded from the GSE14520 dataset of the Gene Expression Omnibus (GEO) database (https://www.ncbi.nlm.nih.gov/geo/query/acc.cgi?acc=GSE14520; accessed October 15, 2017).Citation22 The above dataset included gene expression levels that originated from the [HT_HG-U133A] Affymetrix HT Human Genome U133ACitation22 and [HT_HG-U133A_2] Affymetrix HT Human Genome U133A_2.0Citation23 arrays. To prevent batch effects, the former array, which had more patients and samples (231 patients and 455 tissues: 225 HCC tumor tissues and 220 liver tissues, respectively), was selected.
Enrichment analysis of the CYP3A subfamily
The online database Database for Annotation, Visualization, and Integrated Discovery (DAVID) ver. 6.7 (https://david-d.ncifcrf.gov/; accessed October 15, 2017)Citation24,Citation25 was employed for enrichment analysis. The database contains gene ontology (GO) functional analysis and Kyoto Encyclopedia of Genes and Genomes (KEGG) pathway analysis.Citation26 In the present study, GO analysis was performed to obtain molecular function and cellular component terms, while KEGG pathways were drawn between CYP3A and other subfamilies.
Survival analysis
The data of 360 HCC patients were retrieved from the TCGA database and two groups were formed (n=180 each) according to the 50% cutoff values. The median survival time (MST) was utilized to evaluate patient prognosis and a Cox regression model adjusted for TNM stage, age, and sex was used to identify factors significantly associated with HCC. In order to assure a rational comparison between the above two databases, the 50% cutoff was also used for the GEO database. Overall survival (OS) and recurrence-free survival (RFS) were applied to estimate patient prognosis. A Cox regression model was also adjusted for statistically significant factors, which included age, sex, alanine aminotransferase level, multinodular status, hepatitis B virus infection, main tumor size, alpha-fetoprotein (AFP), cirrhosis, and Barcelona Clinic Liver Cancer (BCLC) stage.
Joint-effects analysis of CYP3A4, CYP3A5, and CYP3A43
In the TCGA database, there were significant differences in the expression levels of only CYP3A4, CYP3A5, and CYP3A43 between tumor and non-tumor tissues. Joint-effects analysis was conducted with the following combinations: 1) CYP3A4 and CYP3A5; 2) CYP3A4 and CYP3A43; 3) CYP3A5 and CYP3A43; and 4) CYP3A4, CYP3A5, and CYP3A43.
There were three groups of CYP3A4 and CYP3A5 combinations according to the expression levels: group A (low CYP3A4 and low CYP3A5), group B (low CYP3A4/high CYP3A5 and high CYP3A4/low CYP3A5), and group C (high CYP3A4 and high CYP3A5).
Likewise, there were three groups of CYP3A4 and CYP3A43 combinations: group a (low CYP3A4 and low CYP3A43 expressions), group b (low CYP3A4/high CYP3A43 and high CYP3A4/low CYP3A43 expressions), and group c (high CYP3A4 and high CYP3A43 expressions).
There were three groups of CYP3A5 and CYP3A43 combinations: group 1 (low CYP3A5 and low CYP3A43 expressions), group 2 (low CYP3A5/high CYP3A43 and high CYP3A5/low CYP3A43 expressions), and group 3 (high CYP3A5 and high CYP3A43 expressions).
There were three groups of CYP3A4, CYP3A5, and CYP3A43 combinations: group I (low CYP3A4, low CYP3A5, and low CYP3A43); group II (high CYP3A4/low CYP3A5/low CYP3A43, low CYP3A4/high CYP3A5/low CYP3A43, and low CYP3A4/low CYP3A5/high CYP3A43); group III (high CYP3A4/high CYP3A5/low CYP3A43, high CYP3A4/low CYP3A5/high CYP3A43, and low CYP3A4/high CYP3A5/high CYP3A43); and group IV (high CYP3A4, high CYP3A5, and high CYP3A43). The Cox regression model was adjusted for statistically significant factors (i.e., TNM stage, age, and sex) in keeping with the above combinations.
In the GEO database, only CYP3A5 and CYP3A43 were statistically significant. Joint-effects analysis was conducted with the following three combinations of CYP3A5 and CYP3A43: group i (low CYP3A5 and low CYP3A43), group ii (low CYP3A5/high CYP3A43 and high CYP3A5/low CYP3A43), and group iii (high CYP3A5 and high CYP3A43).
Statistical analysis
The Pearson correlation coefficient was used to identify correlations among the CYP3A4, CYP3A5, CYP3A7, and CYP3A43 genes. Correlation plots were depicted with R ver. 3.2.0 software (https://www.r-project.org/). Interactions networks among the aforementioned four genes were constructed with Cytoscape ver. 3.5.1 software (http://www.cytoscape.org/). Interaction networks between the four proteins of interest (i.e., CYP3A4, CYP3A5, CYP3A7, and CYP3A43) and other proteins were depicted using the STRING database of known and predicted protein–protein interactions (https://string-db.org/; accessed October 15, 2017). MST and probability (p) values were calculated with Kaplan–Meier survival analysis and the log-rank test. Uni- and multivariate survival analyses were performed using the Cox hazards regression model. Scatter diagrams and survival curves were constructed with GraphPad Prism software ver. 7 (GraphPad Software, Inc., La Jolla, CA, USA). All statistical analyses were performed using SPSS software ver. 16 (SPSS Inc., Chicago, IL, USA ().
Results
Baseline patient characteristics
According to the detailed characteristics of 360 HCC patients from the TCGA database (), only TNM stage was significantly associated with MST (p<0.001). The detailed characteristics of 231 patients from the GEO database, sex, multinodular status, main tumor size, BCLC stage, cirrhosis, and AFP were related to OS (p=0.048, p=0.003, p<0.001, p<0.001, p=0.004, and p=0.001, respectively), while sex, cirrhosis status, main tumor size, and BCLC stage were associated with RFS (p=0.001, p=0.019, p=0.020, and p<0.001, respectively; ).
Table 1 Demographic and clinical characteristics of 360 HCC patients in TCGA database
Table 2 Demographic and clinical characteristics of 231 HCC patients in GEO database
Analysis of CYP3A subfamily gene expression levels in tumor and non-tumor tissues
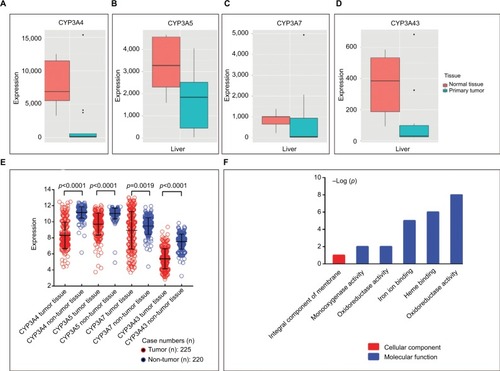
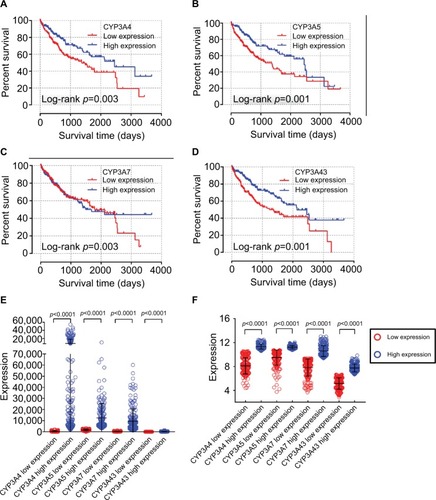
As shown by the box diagrams downloaded from an online website (, respectively), the expression levels of CYP3A4, CYP3A5, CYP3A7, and CYP3A43 were high in normal liver tissues and low in liver primary tumors. Scatter diagrams from a search of the GEO database showed that all of the above four genes generated significant results between tumor and non-tumor tissues (all p<0.0001; ).
Figure 1 Gene expression levels of CYP3A4 (A), CYP3A5 (B), CYP3A7 (C), and CYP3A43 (D) in normal liver tissue and primary liver tumors. Expression levels in the GEO database (E) and GO analysis (F) of the four genes.
Abbreviations: CYP3A, cytochrome P3A; GEO, Gene Expression Omnibus; GO, gene ontology.
Analysis of GO and KEGG pathways of the CYP3A subfamily
GO analysis of the biological functions of CYP3A4, CYP3A5, CYP3A7, and CYP3A43 returned the cellular component and the molecular function terms of “integral component of membrane”, “monooxygenase activity”, “oxidoreductase activity”, “iron ion binding”, and “heme binding” (). In the KEGG pathway analysis, DAVID determined the associations between CYP3A subfamily members and other genes.
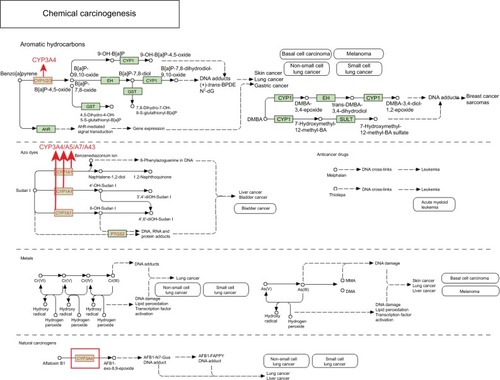
In the metabolism of aromatic hydrocarbons, benzo(a) pyrene and B(a)P-4,5-oxide are metabolized by CYP3A4 into B(a)P-7,8-oxide and B(a)P-9,10-oxide, respectively, and finally transformed into the DNA adduct (+)-trans-BPDE-N2-dG, which is a known cause of cancers of the skin, lung, and stomach. In the metabolism of azo dyes, Sudan I is metabolized by CYP3A subfamily members into the benzenediazonium ions naphthalene-1,2-diol, 4′-OH-Sudan I and 6-OH-Sudan I, and finally transformed into 8-phenylazoguanine in DNA and DNA, RNA, and protein adducts, which have been associated with the occurrence of liver and bladder cancers. In the metabolism of natural carcinogens, aflatoxin B1 is transformed by CYP3A4 into AFB1-exo-8,9-epoxide, which can be metabolized to the DNA adducts AFB1-N7-Gua and AFB1-FAPPY, which have both been associated with the occurrence of lung and liver cancers ().
Figure 2 Metabolic pathways of the CYP3A4, CYP3A5, CYP3A7, and CYP3A43 genes in chemical carcinogenesis.
Note: Copyright ©1999. KEGG. Reproduced from Ogata H, Goto S, Sato K, Fujibuchi W, Bono H, Kanehisa M. KEGG: kyoto encyclopedia of genes and genomes. Nucleic Acids Res. 1999;27(1):29–34.Citation26
Abbreviations: CYP3A, cytochrome P3A; DMBA, 2,2′-Bis(hydroxymethyl)butyric acid.
Correlation analysis and interaction analysis among CYP3A subfamily members
Pearson correlation coefficients among the four CYP3A members were calculated. In the TCGA database, CYP3A4 was negatively correlated with CYP3A7 (r=−0.12, p<0.05), but not significantly associated with CYP3A5 (r=0.07, p>0.05). The other genes were positively and significantly correlated with each other (all p<0.05; ). In the GEO database, all four genes were positively and statistically significantly correlated with the three other genes (all p<0.05; ).
Figure 3 Matrix graphs of Pearson correlations of CYP3A4, CYP3A5, CYP3A7, and CYP3A43 mRNA expression levels in TCGA database (A) and GEO database (B). Gene–gene interaction networks among the four genes of interest with other genes (C) and protein–protein interaction networks among the four proteins of interest with other proteins (D).
Abbreviations: CYP3A, cytochrome P3A; GEO, Gene Expression Omnibus; TCGA, The Cancer Genome Atlas.
Note: *p≤0.05, **p≤0.01, ***p≤0.001.
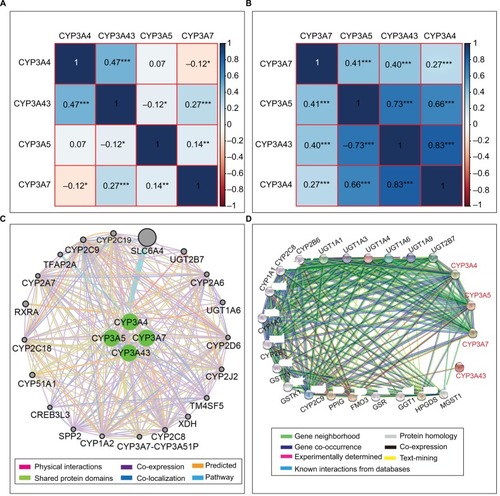
The gene–gene interactions between CYP3A subfamily members and other genes were further analyzed. Four genes were associated with other CYP subfamily members (CYP1A2, CYP2A6, CYP2A7, CYP2D6, CYP2C8, CYP2C9, CYP2C18, CYP2C19, CYP2D6, CYP2J2, CYP3A7–CYP3A51P, and CYP51A1) and other genes, including TM4SF5, XDH, SLC6A4, UGT2B7, UGT1A6, and so on (). Moreover, protein–protein interaction networks drawn by STRING showed that six CYP family member proteins (CYP1A1, CYP1A2, CYP2B6, CYP2C8, CYP2C9, and CYP2E1) were also associated with CYP3A4, CYP3A5, CYP3A7, and CYP3A43 ().
Survival analysis of CYP3A subfamily members
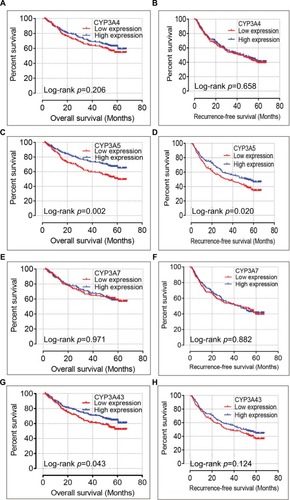
A multivariate Cox regression model adjusted for prognostic-related characteristics in the TCGA database (i.e., sex, age, and TNM stage) revealed significant relationships between MSTs and the CYP genes CYP3A4, CYP3A5, and CYP3A43 (adjusted p=0.022, hazard ratio [HR]=0.64, 95% CI=0.44–0.94; adjusted p=0.005, HR=0.58, 95% CI=0.39–0.84; and adjusted p=0.013, HR=0.61, 95% CI=0.41–0.90, respectively; ). A multivariate Cox regression model adjusted for prognostic-related characteristics in the GEO database (i.e., sex, age, hepatitis B virus, alanine aminotransferase, main tumor size, multinodular status, BCLC stage, AFP, and cirrhosis status) showed that CYP3A5 was significantly associated with OS and RFS (adjusted p=0.001, HR=0.59, 95% CI=0.42–0.81; adjusted p=0.017, HR=0.73, 95% CI=0.56–0.94 respectively; ) and CYP3A43 was significantly associated with OS (adjusted p=0.046, HR=0.73, 95% CI=0.53–0.99; ).
Table 3 Prognostic survival analysis of CYP3A4, CYP3A5, CYP3A7, and CYP3A43 in TCGA database
Table 4 Prognostic survival analysis of CYP3A4, CYP3A5, CYP3A7, and CYP3A43 genes in GEO database
Survival curves of the genes of interest in the TCGA database are presented in and survival curves of these genes in the GEO database are shown in . In addition, scatter diagrams of the expression levels of these genes in both databases are shown in .
Figure 4 Kaplan–Meier survival curves of the CYP3A4 (A), CYP3A5 (B), CYP3A7 (C), and CYP3A43 (D) genes in TCGA database. Scatter plots of CYP3A4, CYP3A5, CYP3A7, and CYP3A43 mRNA expression levels in TCGA database (E) and GEO database (F).
Figure 5 Kaplan–Meier overall survival curves of CYP3A4 (A), CYP3A5 (C), CYP3A7 (E), and CYP3A43 (G), as well as recurrence-free survival of CYP3A4 (B), CYP3A5 (D), CYP3A7 (F), and CYP3A43 (H) in GEO database.
Abbreviations: CYP3A, cytochrome P3A; GEO, Gene Expression Omnibus.
Abbreviations: CYP3A, cytochrome P3A; GEO, Gene Expression Omnibus; TCGA, The Cancer Genome Atlas.
Joint-effects analysis of CYP3A subfamily members
Analysis of CYP3A4 and CYP3A5 combinations in the TCGA database showed that group A had the poorest MST of 931 days (adjusted p=0.005) and group C had the best MST of 2456 days (adjusted p=0.001). In regard to the effects of the CYP3A4 and CYP3A43 combinations in the TCGA database, group a had the poorest MST of 931 days (adjusted p=0.011) and group b had the best MST of 2531 days (adjusted p=0.061). Surprisingly, MST was not determined for group c, which contained the most favorable patient factors, possibly due to the influence of other potential elements. Analysis of the CYP3A5 and CYP3A43 combinations in the TCGA database showed that group 1 had the poorest MST of 931 days (adjusted p=0.003) and group 3 had the best MST of 2456 days (adjusted p=0.001). Detailed joint-effects analysis results are shown in and associated survival curves are shown in .
Table 5 Joint-effects analysis of the combinations of CYP3A4 and CYP3A5, CYP3A4 and CYP3A43, and CYP3A5 and CYP3A43 in two databases
Figure 6 Survival curves of the joint-effects analysis of the combination of CYP3A4 and CYP3A5 (A), CYP3A4 and CYP3A43 (B), CYP3A5 and CYP3A43 (C), and CYP3A4, CYP3A5, and CYP3A43 (D) in TCGA database and CYP3A5 and CYP3A43 (E) in GEO database.
Abbreviations: CYP3A, cytochrome P3A; GEO, Gene Expression Omnibus; TCGA, The Cancer Genome Atlas.
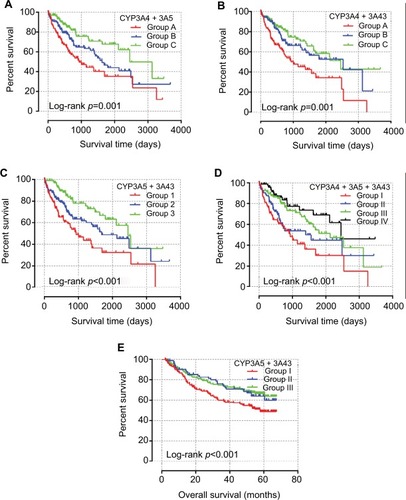
Analysis of the CYP3A4, CYP3A5, and CYP3A43 combinations in the TCGA database revealed that group I had the poorest MST of 931 days (adjusted p=0.004) and group IV had the best MST of 2456 days (adjusted p=0.002; ). Associated survival curves are shown in .
Table 6 Joint-effects analysis of the combination of CYP3A4, CYP3A5, and CYP3A43 genes in TCGA database
Analysis of the CYP3A5 and CYP3A43 combinations in the GEO database showed that group i had the poorest MST of 58 months (adjusted p=0.014). MSTs were not calculated for the other groups. Detailed joint-effects analysis results are shown in and associated survival curves are shown in .
Discussion
The present investigation of the associations between the gene expression levels of the CYP3A subfamily members in the TCGA database showed that low expression levels of CYP3A4, CYP3A5, and CYP3A43 were associated with a poor prognosis of HCC, while in the GEO database, low expression levels of CYP3A5 were associated with a poor prognosis of HCC. Joint-effects analysis of the aforementioned three genes in the TCGA database showed that groups with the poorest prognostic factors had the poorest prognosis. Thus, the expression levels of CYP3A4, CYP3A5, and CYP3A43 both alone and in combination may serve as potential biomarkers of HCC.
It is well established that the members of the CYP3A subfamily are predominantly associated with drug metabolism. It has been reported that up to 37% of drugs are metabolized by CYP3A subfamily members.Citation9 The expression levels of CYP3A5, CYP3A7, and CYP3A43 are usually lower than that of CYP3A4.Citation9 CYP3A7 expression is higher in the fetal liver than in the adult liver; whereas CYP3A43 is hardly detectable.Citation9 CYP3A4, together with CYP2C8 and CYP2C19, is involved in the metabolism of bedaquiline, a mycobacterial for the treatment of multidrug-resistant tuberculosis.Citation27 CYP3A4 and CYP3A5 have been reported in the drug metabolism of analgesics,Citation28 antidepressants and antipsychotics,Citation29 cardiovascular drugs,Citation30 and female sex steroids.Citation31
Furthermore, genetic polymorphisms of CYP3A4, CYP3A5, CYP3A7, and CYP3A43 have been identified in several clinical diseases, including cancers. The rs10235235 locus of CYP3A is reportedly associated with age at menarche and breast cancer risk.Citation32 CYP3A4 expression is related to breast cancer developmentCitation33 and an increased risk of prostate cancer,Citation34 and is a new biomarker for predicting poor prognosis of HCC.Citation35 High expression of CYP3A4 may be associated with metastasis of Ewing’s sarcoma,Citation12 and a significant association was reported between the single-nucleotide polymorphism rs2246709 of CYP3A4 and survival of patients with acute lymphoblastic leukemia.Citation36 A linkage between CYP3A4 and CYP3A5 was found to increase the risk of prostate cancer.Citation37 CYP3A5 acts as a tumor suppressor in HCC via regulation of the mTORC2/Akt signaling pathway.Citation14 Also, a mild association of CYP3A4/A5 genotypes and expression levels with neuroblastoma has been reported.Citation13 The results of a meta-analysis indicated that the CYP3A5*3 genetic polymorphism may play a significant role in the development of both acute and chronic leukemia, as well as colorectal cancer, especially among Asian and Caucasian populations.Citation38 The CYP3A5*3 genetic polymorphism may play a role in the risk of childhood acute lymphoblastic leukemia.Citation39 The single-nucleotide polymorphism rs45446698 of CYP3A7 was found to be associated with breast cancer mortality (HR=1.74, p=0.009), all-cause mortality in lung cancer patients (HR=1.43, p=0.03), and CLL (HR=1.62, p=0.03).Citation17 The CYP3A7*1C allele, which leads to adult expression of the fatal CYP3A7 gene, is likely to be a functional allele that influences the levels of circulating endogenous sex hormones and the subsequent outcomes of CLL, breast cancer, and lung cancer.Citation17 CYP3A7 was found to be overexpressed in HCC.Citation15,Citation16 An increased probability of developing prostate cancer was observed in the G allele of rs2740574 and the C allele of rs501275 of CYP3A43 in a combined ethnic group analysis.Citation40
The results of the present study demonstrated that the expression levels of CYP3A4, CYP3A5, and CYP3A43 are associated with HCC. Moreover, low expression levels of CYP3A4, CYP3A5, and CYP3A43 are linked to a poor prognosis of HCC, which is consistent with the findings of Jiang et alCitation14 who reported that CYP3A5 acts as a tumor suppressor gene in HCC via regulation of the mTORC2/Akt signaling pathway. Although CYP3A7 was not associated with HCC in the two independent datasets employed in this study, the expression levels of CYP3A7 in HCC tumor and non-tumor tissues significantly differed, which is consistent with the report by Kondoh et al,Citation15 which stated that CYP3A7 is overexpressed in HCC tissues as well. Besides, we found low expression levels of CYP3A4 and CYP3A43 in HCC tissues, as demonstrated by statistically significant p values, suggesting that both may serve as tumor suppressor genes in HCC. The expression levels of CYP3A5 and CYP3A43 were consistently significantly different in the TCGA and GEO databases, while only CYP3A4 was significantly different in the TCGA database. This phenomenon may partly be explained as the standardized expression levels of genes in the GEO database, and the adjusted p value of CYP3A4 was the nearest to the significant p cutoff value. To the best of our knowledge, this is the first report of these findings, thus further validations are warranted in other populations.
Meanwhile, in the metabolism of aromatic hydrocarbons, benzo(a)pyrene is metabolized by CYP3A4 and finally transformed into DNA adducts, which are known to induce cancers of the skin, lung, and stomach. In azo dye metabolism, Sudan I is metabolized by CYP3A subfamily members and finally into DNA, RNA, and protein adducts, which could lead to the onset of liver and bladder cancers. In the metabolism of natural carcinogens, aflatoxin B1 is transformed by CYP3A4 and the final metabolite could lead to oncogenesis of the lung and liver. The gene–gene interaction networks showed that CYP3A4 is related to CYP1A2 in predicted, co-expression, and shared protein domains aspects; CYP3A5 and CYP3A7 are related to CYP1A2 in shared protein domains aspects; and CYP3A43 is related to CYP1A2 in co-expression and shared protein domains aspects. The protein–protein interaction networks showed that CYP3A4 is linked to CYP1A2 in text-mining, already known interaction, co-expression, gene co-occurrence, and protein homology aspects, while CYP3A5 and CYP3A7 are linked to CYP1A2 in text-mining, already known interaction, gene co-occurrence, and protein homology aspects. In the metabolism of aromatic amines and amides, IQ and MeIQx are metabolized by CYP1A2 and finally transformed into DNA adducts, which have been linked to cancers of the liver, colon, lung, and breast. Given the foregoing results, we speculate that CYP3A4, CYP3A5, and CYP3A43 may be related to HCC due to the complicated relationships with substrate metabolism and gene expression, including CYP1A2 expression and enzyme activity.
However, there were some limitations to this study that should be addressed. First, larger population studies are required to increase the credibility of the present findings. Second, other potential prognosis-related factors regarding tumor evolution and prognosis, including drinking status, smoking status, cirrhosis status, Child–Pugh score, BCLC stage, tumor numbers, main tumor size, tumor capsule status, vascular invasion, AFP levels, and antiviral therapy, should be included in future analysis to better evaluate the relationships between CYP3A subfamily members and HCC prognosis. Third, further well-designed studies concentrating on functional validation are warranted with a greater number of research centers and more racially diverse countries.
To summarize, the results of the present study demonstrated that CYP3A4, CYP3A5, and CYP3A43 present potential serum biomarkers for the early diagnosis of HCC and combination analysis revealed significant interactions that could serve as better prognostic indicators of HCC. However, because of the incomplete clinical data and small sample size in this study, further studies are needed to validate these findings.
Acknowledgments
This work was supported in part by the National Nature Science Foundation of China (Nos 81560535, 81072321, 30760243, 30460143, and 30560133), 2009 Program for New Century Excellent Talents in University, Guangxi Nature Sciences Foundation (No. GuiKeGong 1104003A-7), and Guangxi Health Ministry Medicine Grant (Key-Scientific Research-Grant Z201018), and self-raised Scientific Research Fund of the Health and Family Planning Commission of Guangxi Zhuang Autonomous Region (Z2016318). The authors also acknowledge the support by the National Key Clinical Specialty Programs (General Surgery and Oncology) and the Key Laboratory of Early Prevention and Treatment for Regional High-Incidence-Tumor (Guangxi Medical University), Ministry of Education, China. The authors thank Prof Cheryl A Winkler and Stephen J O’Brien for their invaluable help to our study.
Disclosure
The authors report no conflicts of interest in this work.
References
- TorreLABrayFSiegelRLFerlayJLortet-TieulentJJemalAGlobal cancer statistics, 2012CA Cancer J Clin20156528710825651787
- ChenWZhengRBaadePDCancer statistics in China, 2015CA Cancer J Clin201666211513226808342
- TienAJChienCYChenYHLinLCChienCTFruiting bodies of antrodia cinnamomea and its active triterpenoid, antcin K, ameliorates N-Nitrosodiethylamine-Induced Hepatic Inflammation, fibrosis and carcinogenesis in ratsAm J Chin Med201745117319828081627
- HuangCFHuangCYYehMLGenetics variants and serum levels of MHC class I chain-related A in predicting hepatocellular carcinoma development in chronic hepatitis C patients post antiviral treatmentE Bio Medicine2017158189
- KgatleMMSetshediMHairwadziHNHepatoepigenetic alterations in viral and nonviral-induced hepatocellular carcinomaBiomed Res Int20162016395648528105421
- BaloghJVictorD3rdAshamEHHepatocellular carcinoma: a reviewJ Hepatocell Carcinoma20163415327785449
- EkinsSStresserDMAndrew WilliamsJIn vitro and pharmacophore insights into CYP3A enzymesTrends Pharmacol Sci200324416116612707001
- WrightonSASchuetzEGThummelKEShenDDKorzekwaKRWatkinsPBThe human CYP3A subfamily: practical considerationsDrug Metab Rev20003234339361
- ZangerUMTurpeinenMKleinKSchwabMFunctional pharmacogenetics/genomics of human cytochromes P450 involved in drug biotransformationAnal Bioanal Chem200839261093110818695978
- NeunzigIDrăganCAWidjajaMWhole-cell biotransformation assay for investigation of the human drug metabolizing enzyme CYP3A7Biochim Biophys Acta20111814116116720637317
- DalyAKSignificance of the minor cytochrome P450 3A isoformsClin Pharmacokinet2006451133116430309
- ZiaHMurrayGIVyhlidalCACYP3A isoforms in Ewing’s sarcoma tumours: an immunohistochemical study with clinical correlationInt J Exp Pathol2015962818625670065
- DarwishMHFarahRAFarhatGNAssociation of CYP3A4/5 genotypes and expression with the survival of patients with neuroblastomaMol Med Rep20151121462146825370902
- JiangFChenLYangYCCYP3A5 functions as a tumor suppressor in hepatocellular carcinoma by regulating mTORC2/Akt signalingCancer Res20157571470148125649767
- KondohNWakatsukiTRyoAIdentification and characterization of genes associated with human hepatocellular carcinogenesisCancer Res199959194990499610519413
- TsunedomiRIizukaNHamamotoYPatterns of expression of cytochrome P450 genes in progression of hepatitis C virus-associated hepatocellular carcinomaInt J Oncol200527366166716077914
- JohnsonNDe IesoPMiglioriniGCytochrome P450 allele CYP3A7*1C associates with adverse outcomes in chronic lymphocytic leukemia, breast, and lung cancerCancer Res20167661485149326964624
- SiemesCVisserLEde JongFHCytochrome P450 3A gene variation, steroid hormone serum levels and prostate cancer--The Rotterdam StudySteroids201075121024103220621111
- ShaulYYuanBThiruPMERAV: a tool for comparing gene expression across human tissues and cell typesNucleic Acids Res201644D1D560D56626626150
- SzklarczykDMorrisJCookHThe STRING database in 2017: quality-controlled protein-protein association networks, made broadly accessibleNucleic Acids Res201745D1D362D36827924014
- AnayaJOncoLnc: linking TCGA survival data to mRNAs, miRNAs, and lncRNAsPeerJ Comput Sci20162e67
- RoesslerSJiaHLBudhuAA unique metastasis gene signature enables prediction of tumor relapse in early-stage hepatocellular carcinoma patientsCancer Res20107024102021021221159642
- RoesslerSLongELBudhuAIntegrative genomic identification of genes on 8p associated with hepatocellular carcinoma progression and patient survivalGastroenterology20121424957966.e91222202459
- HuangDWShermanBTLempickiRABioinformatics enrichment tools: paths toward the comprehensive functional analysis of large gene listsNucleic Acids Res200937111319033363
- HuangDWShermanBTLempickiRASystematic and integrative analysis of large gene lists using DAVID bioinformatics resourcesNat Protoc200941445719131956
- OgataHGotoSSatoKFujibuchiWBonoHKanehisaMKEGG: kyoto encyclopedia of genes and genomesNucleic Acids Res199927129349847135
- LiuKLiFLuJBedaquiline metabolism: enzymes and novel metabolitesDrug Metab Dispos201442586386624513655
- LalovicBKharaschEHofferCRislerLLiu-ChenLShenDPharmacokinetics and pharmacodynamics of oral oxycodone in healthy human subjects: role of circulating active metabolitesClin Pharmacol Ther200679546147916678548
- ShamsMArnethBHiemkeCCYP2D6 polymorphism and clinical effect of the antidepressant venlafaxineJ Clin Pharm Ther200631549350216958828
- JiHYLeeHWKimHHRole of human cytochrome P450 3A4 in the metabolism of DA -8159, a new erectogenicXenobiotica2004341112973982
- WangBSanchezRIFranklinRBEvansDCHuskeySEThe involvement of CYP3A4 and CYP2C9 in the metabolism of 17 alpha-ethinylestradiolDrug Metab Dispos200432111209121215304426
- JohnsonNDudbridgeFOrrNGenetic variation at CYP3A is associated with age at menarche and breast cancer risk: a case-control studyBreast Cancer Res2014163R5124887515
- Floriano-SanchezERodriguezNCBandalaCCoballase-UrrutiaELopez-CruzJCYP3A4 expression in breast cancer and its association with risk factors in Mexican womenAsian Pac J Cancer Prev20141583805380924870798
- ZhouLPYaoFLuanHCYP3A4*1B polymorphism and cancer risk: a HuGE review and meta-analysisTumour Biol201334264966023179402
- AshidaROkamuraYOhshimaKCYP3A4 gene is a novel biomarker for predicting a poor prognosis in hepatocellular carcinomaCancer Genomics Proteomics201714644545329109094
- GezsiALautner-CsorbaOErdelyiDJIn interaction with gender a common CYP3A4 polymorphism may influence the survival rate of chemotherapy for childhood acute lymphoblastic leukemiaPharmacogenomics J201515324124725266680
- NovilloARomero-LorcaAGaibarMGenetic diversity of CYP3A4 and CYP3A5 polymorphisms in North African populations from Morocco and TunisiaInt J Biol Markers2015301e148e15125385241
- WangBSLiuZXuWXSunSLCYP3A5*1B polymorphism and cancer risk: a meta-analysis and meta-regressionTumour Biol20133442357236623584898
- BorstLWallerekSDalhoffKThe impact of CYP3A5*3 on risk and prognosis in childhood acute lymphoblastic leukemiaEur J Haematol201186647748321418106
- FernandezPDe BeerPMVan der MerweLHeynsCFGenetic variations in androgen metabolism genes and associations with prostate cancer in South African menS Afr Med J20101001174174521081028