
Abstract
Introduction
Programmed cell death protein 1 (PD-1), an immune checkpoint molecule, has recently been recognized as a predictive and prognostic biomarker in several malignant tumors, but its diagnostic value remains largely unknown. We aimed to investigate the differential diagnostic efficiency of PD-1 and other immune molecules and propose a panel of immune molecules combined with cancer antigen 15-3 (CA15-3) to distinguish breast cancer (BC) from benign breast disease (BBD).
Patients and methods
Ninety-one eligible BC patients and 31 BBD patients were enrolled. Pretreatment peripheral blood was collected and tested for mRNA expression of PD-1, cytotoxic T lymphocyte antigen 4, forkhead box P3, transforming growth factor beta, interleukin-10 (IL-10), IL-2 receptor alpha (IL-2Rα), and cluster of differentiation 28 by quantitative reverse transcription PCR.
Results
The diagnostic areas under curve (AUCs) of PD-1, IL-2Rα, and IL-10 for BC–BBD discrimination were 0.764, 0.758, and 0.743, respectively. The diagnostic efficiencies of these three parameters in distinguishing early-stage or advanced BC from BBD were consistent with a role in BC–BBD discrimination. A panel of PD-1 + IL-10 + IL-2Rα + CA15-3 showed the highest AUC (0.862), with a sensitivity of 0.933 and a specificity of 0.724, for BC–BBD discrimination. In addition, for early-stage BC discrimination, this panel also had the highest AUC (0.811), with a sensitivity of 0.933 and a specificity of 0.614, while for advanced BC discrimination, a panel of PD-1 + IL-10 + CA15-3 exhibited the highest AUC (0.896), with a sensitivity of 0.933 and a specificity of 0.783.
Conclusion
These data indicate that the panel containing PD-1, IL-2Rα, IL-10, and CA15-3 can effectively discriminate BC from BBD with a high efficiency. After further confirmation, it could be used to complement conventional imaging modalities, especially in discriminating early-stage BC from BBD.
Introduction
Breast cancer (BC) is the second leading cause of death worldwide and is the most frequently diagnosed cancer in females.Citation1 Early detection is critically important to optimize treatments and reduce mortality in BC patients. To date, mammography, ultrasonography, and magnetic resonance imaging are the most commonly used methods to detect BC. However, its diagnostic value is relatively limited when patients have early-stage BC and higher breast tissue density.Citation2–Citation4 Cancer antigen 15-3 (CA15-3) and carcinoembryonic antigen are common tumor markers for the detection for BC, but their usefulness is limited in advanced BC, and they have low diagnostic sensitivity and specificity in early-stage cases.Citation5 Therefore, there is a great need to develop other methods to complement the abovementioned methods for BC detection, especially in early-stage cases.
Recently, researchers have been trying to establish predictive models to discriminate BC from benign breast disease (BBD) and healthy people in terms of long non-coding RNAs, circulating cell-free DNA (cfDNA), circulating tumor cells, and various metabolites.Citation6–Citation9 MicroRNAs, including miR-199a, miR-29c, miR-424, miR-195-5p, miR-495, miR-92a, miR-133a, miR-133b, miR-29b-2, miR-155, miR-197, and miR-205, have shown potential diagnostic efficiency for BC, especially as combinations.Citation10–Citation15 In addition, the diagnostic capacity of circulating cfDNA has been demonstrated for the detection of BC.Citation16–Citation20 Lipid profiling has been investigated and its differential diagnostic value has been confirmed in distinguishing BC from BBD.Citation21,Citation22 In addition, various proteins, including developmental endothelial locus 1 protein, vascular endothelial growth factor, and matrix metalloproteinase 9, have shown diagnostic efficiency in BC.Citation23,Citation24 However, the abovementioned existing methods of detection either need high technical requirements and costs or have low sensitivity and specificity.
Immune checkpoint molecules, including programmed cell death 1 (PD-1) and cytotoxic T lymphocyte antigen 4 (CTLA-4), have important roles in the anti-tumor activities of immune cells.Citation25 Immune checkpoint blockers have been widely employed to treat various malignant tumors and have created a paradigm shift for cancer treatment.Citation26,Citation27 Meanwhile, increasing numbers of studies have shown that PD-1 and CTLA-4 are correlated with tumor response and prognosis in BC, non-small-cell lung cancer, and colorectal cancer.Citation28–Citation33 Interleukin-2 receptor alpha (IL-2Rα) is one of the IL-2 receptors and contributes to forkhead box P3 (FOXP3) expression on CD4+ T cells when combined with IL-2.Citation34,Citation35 Previous studies have suggested that levels of soluble IL-2Rα were negatively correlated with prognosis in patients with T-cell lymphoma, diffuse large B-cell lymphoma, acute lymphoblastic leukemia, and follicular B-cell non-Hodgkin lymphoma.Citation35–Citation38 IL-10, FOXP3, and transforming growth factor beta (TGF-β) were shown to be highly expressed in the peripheral blood and tissues of BC patients and negatively correlated with poor survival.Citation39–Citation48 However, the differential diagnostic efficiency of these immune molecules in BC is largely unknown. Here, we investigated the differential diagnostic value of expression of immune checkpoint molecules (PD-1 and CTLA-4), cancer-related immune molecules (FOXP3, TGF-β, IL-10, IL-2Rα, and cluster of differentiation 28 [CD28]), and CA15-3 in the blood specimens, a substantially less invasive approach compared to surgical biopsy. We also proposed a panel of immune molecules combined with CA15-3 to improve diagnostic efficiency by more effectively discriminating BC from BBD.
Patients and methods
Patient selection and sample collection
This study was approved by the ethical committee of Renmin Hospital of Wuhan University. Patients provided their written informed consent. We enrolled BC patients and BBD patients who were admitted to our hospital from November 2015 to March 2017. The inclusion criteria for BC patients were as follows: 1) pathologically confirmed early-stage BC (stage I or II) and ductal carcinoma in situ; 2) pathologically confirmed advanced BC (stage III or IV) before treatment; 3) blood collection before anti-tumor treatment, including surgery, neoadjuvant therapy, and salvage treatment; and 4) age >18 years. The exclusion criteria were as follows: 1) infection or metabolic disease; 2) hematological disease or transplant history; 3) inflammatory disease; and 4) renal or liver disease. We included patients with pathologically confirmed BBD. The exclusion criteria for BBD were the same as those for BC. Among 105 BC patients who enrolled according to the inclusion criteria, 7, 5, 1, and 1 patients were excluded according to exclusion criterion 1)–4), respectively. Among 40 patients with BBD whom we included, 5, 3, 0, and 1 patients were excluded according to exclusion criterion 1)–4), respectively. Finally, 122 blood samples were collected from 91 patients with BC and 31 patients with BBD before anti-tumor treatment and stored in ethylenediaminetetraacetic acid (EDTA) anticoagulant tubes.
Clinical data collection
The following clinical data were collected from electronic medical records in our hospital: age; pathological type; tumor grade, estrogen receptor, progesterone receptor, and human epidermal growth factor receptor 2 status; and American Joint Committee on Cancer (AJCC) stage according to the 7th edition of the AJCC cancer staging manual.Citation49 Therapies included surgery (modified radical mastectomy or breast-conserving surgery), chemotherapy (anthracyclines, paclitaxel, docetaxel, cyclophosphamide, capecitabine, and gemcitabine), targeted therapy (trastuzumab), adjuvant radiotherapy, and endocrine therapy (tamoxifen, letrozole, anastrozole, and exemestane). The non-metastatic patients did not receive the abovementioned therapies before enrollment. Among 41 metastatic patients, 22 patients received adjuvant endocrine therapy before metastasis; 19 patients were under follow-up before metastasis.
Preparation of peripheral cells
Four milliliters of fresh whole blood stored in EDTA anticoagulant tubes was mixed with 8 mL red blood cell lysis solution and inverted at room temperature for 10 minutes. Then, we centrifuged the mixture at 1,000× g for 5 minutes, removed the supernatant, and kept the cell pellet at the bottom of tube. Next, we used 1 mL red blood cell lysis solution to resuspend the cell pellet and repeated the abovementioned steps until red blood cells were fully lysed. Then, 1 mL phosphate-buffered saline was used to wash left cells in the tube. Finally, we mixed cells with 1 mL TRIzol and resuspended them and stored them at −80°C until RNA isolation.
RNA isolation
Two hundred microliters of chloroform was added to the abovementioned mixture, which was then homogenized by shaking the tube vigorously. After incubation for 3 minutes at room temperature, we centrifuged the mixture at 12,000× g for 5 minutes at 4°C. Then, we carefully removed the upper aqueous phase into a new tube and added 500 µL isopropanol for homogenization. The mixture was incubated at room temperature for 10 minutes. After that, we centrifuged the mixture at 12,000× g for 10 minutes at 4°C and removed the supernatant, leaving only the RNA pellet. The RNA was washed with 1 mL 75% ethanol and resuspended with RNase-free water.
cDNA synthesis and ququantitative reverse transcription PCR
One microliter of oligo(dT)15 was added to 1 µg RNA in a microcentrifuge tube and incubated at 70°C for 10 minutes. After that, the microcentrifuge tube was placed on ice in preparation for reverse transcription. A 20 µL reaction mixture containing 4 µL MgCl2, 2 µL reverse transcription 10× buffer, 2 µL dNTP mixture, 0.5 µL recombinant RNasin ribonuclease inhibitor, and 0.6 µL avian myeloblastosis virus reverse transcriptase was mixed with RNA, incubated at 42°C for 60 minutes, heated to 95°C for 5 minutes, and subsequently incubated on ice for 5 minutes.
An ABI Prism 7,900-HT Sequence Detection System (96-well, Thermo Fisher Scientific, Waltham, MA, USA) was used to perform quantitative reverse transcription PCR. β-Actin was used as the internal reference. Primers for immune molecules (PD-1, CTLA-4, FOXP3, TGF-β, IL-10, IL-2Rα, and CD28) and β-actin are listed in . A 20 µL reaction mixture containing 10 µL PCR mixture, 8 µL ddH2O, and 2 µL cDNA for each immune molecule was prepared for quantitative PCR, which was conducted with the following cycling conditions: 45 cycles of real-time inactivation at 95°C for 2 minutes, denaturation at 95°C for 10 seconds, and annealing at 60°C for 1 minute. The relative mRNA expression of immune molecules was normalized to β-actin expression.
Statistical analysis
Receiver operating characteristic curves were used to evaluate the differential diagnostic value of immune molecules and CA15-3 in terms of area under the curve (AUC), sensitivity (true-positive/(true-positive + false-negative)), and specificity (true-negative/(true-negative + false-positive)). We chose three immune molecules with the largest AUCs, combined with CA15-3, to improve the differential diagnostic efficiency. Binary logistic regression analysis was used to calculate the combined predictors of immune molecules and CA15-3, using Youden index value (sensitivity + specificity − 1). Mann–Whitney test was used to compare the mRNA expression of immune molecules in BC patients with that in BBD patients. All analyses were performed using SPSS version 20.0 (IBM Corporation, Armonk, NY, USA). P<0.05 was considered significant.
Results
Baseline characteristics
Ninety-one BC patients and 31 BBD patients were enrolled in this study. lists the baseline
Table 1 Clinicopathological parameters of 91 breast cancer patients
Immune molecules in BC and BBD
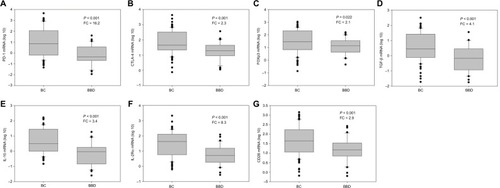
Levels of seven immune molecules, including immune checkpoint molecules (PD-1 and CTLA-4) and cancer-related immune molecules (FOXP3, TGF-β, IL-10, IL-2Rα, and CD28), were upregulated in the peripheral blood of BC patients compared with BBD patients. The relative expression of PD-1 was significantly upregulated in BC patients with a fold change of 16.2 (P<0.001, ) versus BBD patients. In addition, relative levels of CTLA-4, FOXP3, TGF-β, IL-10, IL-2Rα, and CD28 were higher in BC patients than in BBD patients, with fold changes of 2.3 (P=0.001, ), 2.1 (P=0.022, ), 4.1 (P<0.001, ), 3.4 (P<0.001, ), 8.3 (P<0.001, ), and 2.9 (P=0.001, ), respectively. Compared with early-stage BC patients, patients with advanced BC showed no significant differences in the relative expression levels of these immune molecules (P>0.05, Figure S1).
Figure 1 Relative expression levels of immune molecules in the peripheral blood of patients with BC and BBD.
Note: Levels of (A) PD-1, (B) CTLA-4, (C) FOXP3, (D) TGF-β, (E) IL-10, (F) IL-2Rα, and (G) CD28.
Abbreviations: BC, breast cancer; BBD, breast benign disease; PD-1, programmed cell death 1; CTLA-4, cytotoxic T lymphocyte antigen 4; FOXP3, forkhead box P3; TGF-β, transforming growth factor-beta; IL-10, interleukin-10; IL-2Rα, interleukin-2 receptor alpha; CD28, cluster of differentiation 28; FC, fold change.
Differential diagnostic value of immune molecules in BC
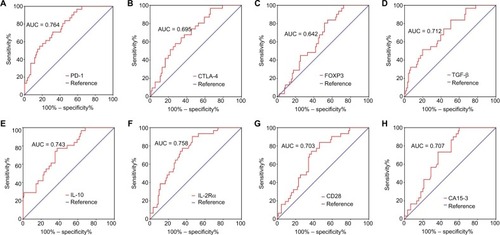
We evaluated the differential diagnostic value of each immune molecule, CA15-3, the combination of the three immune molecules with the largest AUCs, and CA15-3. In 91 BC patients, the AUCs for PD-1, IL-10, and IL-2Rα were 0.764 (95% CI: 0.674–0.855), 0.743 (95% CI: 0.646–0.840), and 0.758 (95% CI: 0.668–0.849), respectively (, ); the
Table 2 AUCs for immune molecules and in combination with CA15-3 in breast cancer
Table 3 Diagnostic sensitivity and specificity for immune molecules and in combination with CA15-3 in breast cancer
Figure 2 ROC analyses of immune molecules and CA15-3 to distinguish BC (N = 91) from BBD (N = 31).
Notes: Differential diagnostic value of (A) PD-1, (B) CTLA-4, (C) FOXP3, (D) TGF-β, (E) IL-10, (F) IL-2Rα, (G) CD28, and (H) CA15-3.
Abbreviations: ROC, receiver-operating characteristic; CA15-3, cancer antigen 15-3; BC, breast cancer; BBD, breast benign disease; PD-1, programmed cell death 1; CTLA-4, cytotoxic T lymphocyte antigen 4; FOXP3, forkhead box P3; TGF-β, transforming growth factor-beta; IL-10, interleukin-10; IL-2Rα, interleukin-2 receptor alpha; CD28, cluster of differentiation 28; AUC, area under curve.
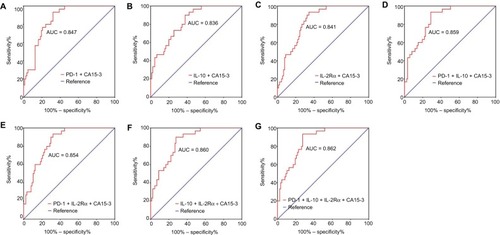
A three-parameter combination (PD-1 + IL-10 + CA15-3) showed a diagnostic AUC of 0.859 (95% CI: 0.791–0.926), sensitivity of 0.933, and specificity of 0.713 ( and , ). Another three-parameter combination (IL-10 + IL-2Rα + CA15-3) exhibited a diagnostic AUC of 0.860 (95% CI: 0.791–0.928), sensitivity of 0.900, and specificity of 0.736 ( and ; ). Finally, the AUC, sensitivity, and specificity for a four-parameter combination (PD-1 + IL-10 + IL-2Rα + CA15-3) were 0.862 (95% CI: 0.795–0.929), 0.933, and 0.724, respectively ( and ; ). Diagnostic values for other combined models are shown in and .
Figure 3 ROC analyses of panels of combining immune molecules with CA15-3 to distinguish BC (N = 91) from BBD (N = 31).
Note: Differential diagnostic value of panels of (A) PD-1 + CA15-3, (B) IL-10 + CA15-3, (C) IL-2Rα + CA15-3, (D) PD-1 + IL-10 + CA15-3, (E) PD-1 + IL-2Rα + CA15-3, (F) IL-10 + IL-2Rα + CA15-3, and (G) PD-1 + IL-10 + IL-2Rα + CA15-3.
Abbreviations: ROC, receiver-operating characteristic; CA15-3, cancer antigen 15-3; BC, breast cancer; BBD, breast benign disease; PD-1, programmed cell death 1; IL-10, interleukin-10; IL-2Rα, interleukin-2 receptor alpha; AUC, area under curve.
Differential diagnostic value of immune molecules in early-stage BC
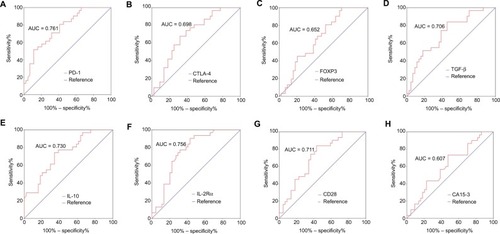
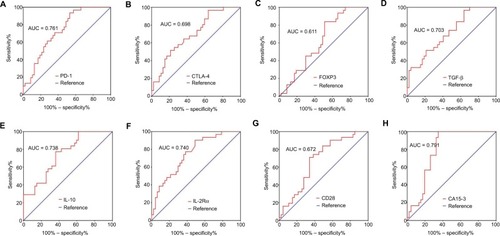
In early-stage BC, the AUC, sensitivity, and specificity for CA15-3 were 0.607 (95% CI: 0.477–0.737), 0.523, and 0.733, respectively ( and ; ). The AUCs for PD-1, IL-10, and IL-2Rα were 0.761 (95% CI: 0.654–0.869), 0.730 (95% CI: 0.616–0.844), and 0.756 (95% CI: 0.647–0.866), respectively (; ); the diagnostic sensitivity and specificity for these three immune molecules in early-stage BC were 0.591 and 0.800, 0.659 and 0.733, and 0.568 and 0.900, respectively ().
Figure 4 ROC analyses of immune molecules and CA15-3 to distinguish early-stage BC (N = 44) from BBD (N = 31).
Note: Differential diagnostic value of (A) PD-1, (B) CTLA-4, (C) FOXP3, (D) TGF-β, (E) IL-10, (F) IL-2Rα, (G) CD28, and (H) CA15-3.
Abbreviations: ROC, receiver-operating characteristic; CA15-3, cancer antigen 15-3; BC, breast cancer; BBD, breast benign disease; PD-1, programmed cell death 1; CTLA-4, cytotoxic T lymphocyte antigen 4; FOXP3, forkhead box P3; TGF-β, transforming growth factor-beta; IL-10, interleukin-10; IL-2Rα, interleukin-2 receptor alpha; CD28, cluster of differentiation 28; AUC, area under curve.
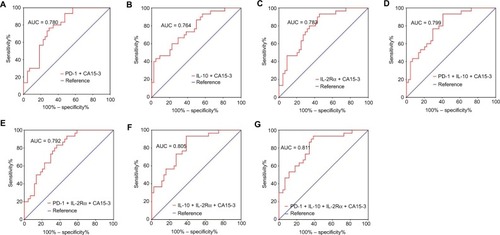
A three-parameter combination (IL-10 + IL-2Rα + CA15-3) exhibited a diagnostic AUC of 0.805 (95% CI: 0.706–0.903), sensitivity of 0.933, and specificity of 0.614 ( and ; ). Another three-parameter combination (PD-1 + IL-10 + CA15-3) showed a diagnostic AUC of 0.799 (95% CI: 0.700–0.898), sensitivity of 0.933, and specificity of 0.591 ( and ; ). The AUC, sensitivity, and specificity for a four-parameter combination (PD-1 + IL-10 + IL-2Rα + CA15-3) were 0.811 (95% CI: 0.713–0.910), 0.933, and 0.614, respectively ( and ; ).
Figure 5 ROC analyses of panels of combining immune molecules with CA15-3 to distinguish early-stage BC (N = 44) from BBD (N = 31).
Note: Differential diagnostic value of panels of (A) PD-1 + CA15-3, (B) IL-10 + CA15-3, (C) Its IL-2Rα + CA15-3. (D) PD-1 + IL-10 + CA15-3, (E) PD-1 + IL-2Rα + CA15-3, (F) IL-10 + IL-2Rα + CA15-3, and (G) PD-1 + IL-10 + IL-2Rα + CA15-3.
Abbreviations: ROC, receiver-operating characteristic; CA15-3, cancer antigen 15-3; BC, breast cancer; BBD, breast benign disease; PD-1, programmed cell death 1; IL-10, interleukin-10; IL-2Rα, interleukin-2 receptor alpha; AUC, area under curve.
Differential diagnostic value of immune molecules in advanced BC
In advanced BC, CA15-3 exhibited a differential diagnostic AUC of 0.791 (95% CI: 0.688–0.893), sensitivity of 0.652, and specificity of 1.000 ( and ; ). The AUCs for PD-1, IL-10, and IL-2Rα were 0.725 (95% CI: 0.614–0.837), 0.738 (95% CI: 0.628–0.849), and 0.740 (95% CI: 0.629–0.851), respectively (; ); the diagnostic sensitivity and specificity for these three immune molecules were 0.478 and 0.933, 0.630 and 0.767, and 0.500 and 0.900, respectively ().
Figure 6 ROC analyses of immune molecules and CA15-3 to distinguish advanced BC (N = 47) from BBD (N = 31).
Note: Differential diagnostic value of (A) PD-1, (B) CTLA-4, (C) FOXP3, (D) TGF-β, (E) IL-10, (F) IL-2Rα, (G) CD28, and (H) CA15-3.
Abbreviations: ROC, receiver-operating characteristic; CA15-3, cancer antigen 15-3; BC, breast cancer; BBD, breast benign disease; PD-1, programmed cell death 1; CTLA-4, cytotoxic T lymphocyte antigen 4; FOXP3, forkhead box P3; TGF-β, transforming growth factor-beta; IL-10, interleukin-10; IL-2Rα, interleukin-2 receptor alpha; CD28, cluster of differentiation 28; AUC, area under curve.
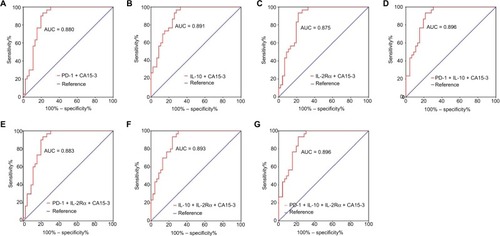
The AUC, sensitivity, and specificity for a three-parameter combination (PD-1 + IL-10 + CA15-3) were 0.896 (95% CI: 0.826–0.965), 0.933, and 0.783, respectively ( and ; ). The AUC, sensitivity, and specificity for another three-parameter combination (IL-10 + IL-2Rα + CA15-3) were 0.893 (95% CI: 0.824–0.962), 1.000, and 0.696, respectively ( and ; ). The four-parameter combination (PD-1 + IL-10 + IL-2Rα + CA15-3) showed a diagnostic AUC of 0.896 (95% CI: 0.827–0.964), sensitivity of 0.933, and specificity of 0.783 ( and ; ).
Figure 7 ROC analyses of panels of combining immune molecules with CA15-3 to distinguish advanced BC (N = 47) from BBD (N = 31).
Note: Differential diagnostic value of panels of (A) PD-1 + CA15-3, (B) IL-10 + CA15-3, (C) Its IL-2Rα + CA15-3. (D) PD-1 + IL-10 + CA15-3, (E) PD-1 + IL-2Rα + CA15-3, (F) IL-10 + IL-2Rα + CA15-3, and (G) PD-1 + IL-10 + IL-2Rα + CA15-3.
Abbreviations: ROC, receiver-operating characteristic; CA15-3, cancer antigen 15-3; BC, breast cancer; BBD, breast benign disease; PD-1, programmed cell death 1; IL-10, interleukin-10; IL-2Rα, interleukin-2 receptor alpha; AUC, area under curve.
Discussion
To the best of our knowledge, this study is the first to investigate the differential diagnostic efficiencies of immune checkpoint molecules in discriminating BC from BBD. Specifically, we combined immune molecules with CA15-3 to form a panel that could be used as a substantially less invasive approach compared to surgical biopsy to discriminate early-stage and advanced BC from BBD. We found that 1) relative mRNA levels of PD-1, CTLA-4, FOXP3, TGF-β, IL-10, IL-2Rα, and CD28 were significantly upregulated in the peripheral blood of BC patients versus BBD patients; 2) the diagnostic AUCs for PD-1 in BC (AUC = 0.764), early-stage BC (AUC = 0.761), and advanced BC (AUC = 0.725) were similar; the diagnostic AUCs for IL-2Rα in BC, early-stage BC, and advanced BC were 0.758, 0.756, and 0.740, respectively; and the diagnostic AUCs for IL-10 in BC, early-stage BC, and advanced BC were 0.743, 0.730, and 0.738, respectively; 3) for BC at all stages, a panel of PD-1 + IL-10 + IL-2Rα + CA15-3 showed the highest AUC of 0.862 with a sensitivity of 0.933 and a specificity of 0.724; for early-stage BC, this panel also showed the highest AUC of 0.811 with a sensitivity of 0.933 and a specificity of 0.614, while for advanced BC, a panel of PD-1 + IL-10 + CA15-3 showed the highest AUC of 0.896 with a sensitivity of 0.933 and a specificity of 0.783.
A previous study found that increased PD-1(+) cells in tumor tissue were associated with poor survival in BC patients.Citation33 In addition, increased PD-1 expression in peripheral blood mononuclear cells was correlated with high tumor stage in renal cell carcinoma.Citation50 We found increased PD-1 mRNA expression in the peripheral blood of BC patients compared with BBD patients with a fold change of 16.2, which was consistent with previous studies. In addition, we found that the differential diagnostic efficiency of PD-1 in total and early-stage BC was better than that of CA15-3. As a co-inhibitory molecule, PD-1 is highly expressed in immune cells and inhibits the anti-tumor response after tumor occurrence and development, which may explain our findings.Citation51
IL-2Rα has been extensively investigated in lymphoma owing to its negative correlation with patients’ survival.Citation35–Citation38 In this study, we found elevated relative expression of IL-2Rα with a fold change of 8.3 in BC versus BBD. More importantly, we found a better diagnostic AUC for IL-2Rα than for CA15-3 in BC patients. In addition, IL-10 showed similar results to those of IL-2Rα, consistent with previous findings that IL-10 is highly expressed in the peripheral blood of malignant breast tumors.Citation52,Citation53 The underlying mechanism is that IL-10, as an anti-inflammatory cytokine, promotes tumor progression and induces immunosuppression.Citation52
Due to the fact that single- or two-molecule combinations did not work well, we chose three molecules with the largest AUCs and CA15-3 to establish a panel to improve diagnostic efficiency. In the total BC group, a panel containing four parameters (PD-1 + IL-10 + IL-2Rα + CA15-3) had the highest diagnostic AUC of 0.862, sensitivity of 0.933, and specificity of 0.724. Shan et alCitation17 established a panel of six immune molecules to discriminate BC and BBD, which showed an AUC of 0.789, sensitivity of 0.824, and specificity of 0.781. In addition, another study revealed that plasma cfDNA integrity could provide an AUC of 0.80, sensitivity of 0.910, and specificity of 0.682 in discriminating non-small-cell lung cancer from benign lung nodules.Citation19 Our panel exhibited a better differential diagnostic value, which may be accounted for by the significance of checkpoint molecules and other immune molecules in tumor occurrence and invasion. In advanced BC patients, a panel containing three parameters (PD-1 + IL-10 + CA15-3) showed the same diagnostic power with the panel containing four parameters (PD-1 + IL-10 + IL-2Rα + CA15-3). Considering the cost, we suggest that the three-parameter panel may be a complement for conventional imaging modalities to detect advanced BC.
For early-stage BC detection, a recent study revealed that a model containing 15 lipid species had great differential diagnostic power, with an AUC of 0.926, sensitivity of 0.833, and specificity of 0.927.Citation21 Another previous study showed that the diagnostic value of developmental endothelial locus-1 protein was high, with an AUC of 0.924, sensitivity of 0.849, and specificity of 0.758 in distinguishing BC from BBD and non-cancer patients;Citation23 although they did not split BBD and other non-cancer patients, the diagnostic efficiency was still promising. In the current study, we found that our panel of PD-1 + IL-10 + IL-2Rα + CA15-3 showed an inferior AUC of 0.811, sensitivity of 0.933, and specificity of 0.614 when compared with the two abovementioned studies. However, considering technical issues and costs, our panel is easy to use and feasible.
Overall, we proved the diagnostic value of PD-1 and established a panel containing PD-1, IL-2Rα, IL-10, and CA15-3 to distinguish BC from BBD. However, there were some limitations. First, a validation group for above-mentioned results is absent in this study. Second, we only enrolled 91 BC patients and 31 BBD patients in the present study. The sample size was small, especially in terms of the BBD patient numbers, which was usually larger than 50 in similar studies. The limited sample size may affect the results. Third, some unknown factors for patients, such as eating habits, amount of exercise every day, sleep, and emotion, may influence the expression of immune molecules. Further studies need to take them into consideration and conduct subgroup analyses to address this limitation. Finally, 22 metastatic BC patients received adjuvant endocrine therapy before enrollment; endocrine therapy and its associated comorbidities, such as osteoporosis, hypercholesterolemia, cardiovascular events, and depression, may affect patients’ immune status. In addition, therapies for abovementioned comorbidities may affect expression of immune markers.
Conclusion
We established a panel containing PD-1, IL-2Rα, IL-10, and CA15-3 to discriminate BC from BBD, which could serve as a complement for conventional imaging modalities, especially in detecting early-stage BC. Further large-scale investigations are needed to confirm its diagnostic value and improve the identification of BC by combining the panel with other parameters.
Supplementary materials
Figure S1 Relative expression levels of immune molecules in the peripheral blood of patients with early-stage BC and advanced BC.
Note: Levels of (A) PD-1, (B) CTLA-4, (C) FOXP3, (D) TGF-β, (E) IL-10, (F) IL-2Rα, and (G) CD28.
Abbreviations: BC, breast cancer; PD-1, programmed cell death 1; CTLA-4, cytotoxic T lymphocyte antigen 4; FOXP3, forkhead box P3; TGF-β, transforming growth factor-beta; IL-10, interleukin-10; IL-2Rα, interleukin-2 receptor alpha; CD28, cluster of differentiation 28.
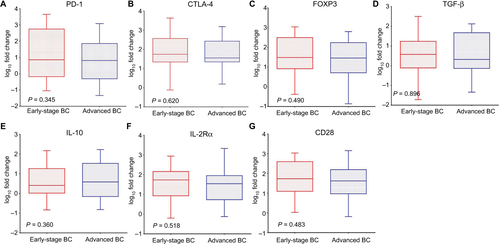
Table S1 Primers for PD-1, CTLA-4, FOXP3, TGF-β, IL-10, IL-2Rα, CD28, and β-actin
Disclosure
The authors report no conflicts of interest in this work.
References
- SiegelRLMillerKDJemalA Cancer statistics, 2017 CA Cancer J Clin 2017 67 1 7 30 28055103
- KerlikowskeKZhuWHubbardRABreast Cancer Surveillance Consortium Outcomes of screening mammography by frequency, breast density, and postmenopausal hormone therapy JAMA Intern Med 2013 173 9 807 816 23552817
- SaslowDBoetesCBurkeWAmerican Cancer Society Breast Cancer Advisory Group American Cancer Society guidelines for breast screening with MRI as an adjunct to mammography CA Cancer J Clin 2007 57 2 75 89 17392385
- KriegeMBrekelmansCTBoetesCMagnetic Resonance Imaging Screening Study Group Efficacy of MRI and mammography for breast-cancer screening in women with a familial or genetic predisposition N Engl J Med 2004 351 5 427 437 15282350
- StieberPNagelDBlankenburgI Diagnostic efficacy of CA 15-3 and CEA in the early detection of metastatic breast cancer – a retrospective analysis of kinetics on 743 breast cancer patients Clin Chim Acta 2015 448 228 231 26160053
- HamamRHamamDAlsalehKA Circulating microRNAs in breast cancer: novel diagnostic and prognostic biomarkers Cell Death Dis 2017 8 9 e3045 28880270
- Chandra GuptaSNandan TripathiY Potential of long non-coding RNAs in cancer patients: from biomarkers to therapeutic targets Int J Cancer 2017 140 9 1955 1967 27925173
- TrecateGSinuesPMOrlandiR Noninvasive strategies for breast cancer early detection Future Oncol 2016 12 11 1395 1441 27044539
- Alix-PanabièresCPantelK Clinical applications of circulating tumor cells and circulating tumor DNA as liquid biopsy Cancer Discov 2016 6 5 479 491 26969689
- ZhangLXuYJinX A circulating miRNA signature as a diagnostic biomarker for non-invasive early detection of breast cancer Breast Cancer Res Treat 2015 154 2 423 434 26476723
- ShakerOMaherMNassarYMorcosGGadZ Role of microRNAs -29b-2, -155, -197 and -205 as diagnostic biomarkers in serum of breast cancer females Gene 2015 560 1 77 82 25644077
- MishraSSrivastavaAKSumanSKumarVShuklaY Circulating miRNAs revealed as surrogate molecular signatures for the early detection of breast cancer Cancer Lett 2015 369 1 67 75 26276721
- ShenJHuQSchrauderM Circulating miR-148b and miR-133a as biomarkers for breast cancer detection Oncotarget 2014 5 14 5284 5294 25051376
- ChanMLiawCSJiSM Identification of circulating microRNA signatures for breast cancer detection Clin Cancer Res 2013 19 16 4477 4487 23797906
- NassarFJNasrRTalhoukR MicroRNAs as biomarkers for early breast cancer diagnosis, prognosis and therapy prediction Pharmacol Ther 2017 172 34 49 27916656
- UehiroNSatoFPuF Circulating cell-free DNA-based epigenetic assay can detect early breast cancer Breast Cancer Res 2016 18 1 129 27993161
- ShanMYinHLiJ Detection of aberrant methylation of a six-gene panel in serum DNA for diagnosis of breast cancer Oncotarget 2016 7 14 18485 18494 26918343
- MadhavanDWallwienerMBentsK Plasma DNA integrity as a biomarker for primary and metastatic breast cancer and potential marker for early diagnosis Breast Cancer Res Treat 2014 146 1 163 174 24838941
- SzpechcinskiARudzinskiPKupisWLangfortROrlowskiTChorostowska-WynimkoJ Plasma cell-free DNA levels and integrity in patients with chest radiological findings: NSCLC versus benign lung nodules Cancer Lett 2016 374 2 202 207 26854716
- SzpechcinskiAChorostowska-WynimkoJStruniawskiR Cell-free DNA levels in plasma of patients with non-small-cell lung cancer and inflammatory lung disease Br J Cancer 2015 113 3 476 483 26125447
- ChenXChenHDaiM Plasma lipidomics profiling identified lipid biomarkers in distinguishing early-stage breast cancer from benign lesions Oncotarget 2016 7 24 36622 36631 27153558
- YangLCuiXZhangN Comprehensive lipid profiling of plasma in patients with benign breast tumor and breast cancer reveals novel biomarkers Anal Bioanal Chem 2015 407 17 5065 5077 25651902
- MoonPGLeeJEChoYE Identification of developmental endothelial locus-1 on circulating extracellular vesicles as a novel bio-marker for early breast cancer detection Clin Cancer Res 2016 22 7 1757 1766 26603257
- ŁawickiSZajkowskaMGłażewskaEKBędkowskaGESzmitkowskiM Plasma levels and diagnostic utility of VEGF, MMP-9, and TIMP-1 in the diagnosis of patients with breast cancer Onco Targets Ther 2016 9 911 919 26966379
- ChenDSMellmanI Elements of cancer immunity and the cancer-immune set point Nature 2017 541 7637 321 330 28102259
- Vanpouille-BoxCLhuillierCBezuL Trial watch: immune checkpoint blockers for cancer therapy Oncoimmunology 2017 6 11 e1373237 29147629
- NishinoMRamaiyaNHHatabuHHodiFS Monitoring immune-checkpoint blockade: response evaluation and biomarker development Nat Rev Clin Oncol 2017 14 11 655 668 28653677
- MazzaschiGMadedduDFalcoA Low PD-1 expression in cytotoxic CD8+ tumor-infiltrating lymphocytes confers an immune-privileged tissue microenvironment in NSCLC with a prognostic and predictive value Clin Cancer Res 2018 24 2 407 419 29074606
- KollmannDSchweigerTSchwarzS PD1-positive tumor-infiltrating lymphocytes are associated with poor clinical outcome after pulmonary metastasectomy for colorectal cancer Oncoimmunology 2017 6 9 e1331194 28932634
- SorensenSFDemuthCWeberBSorensenBSMeldgaardP Increase in soluble PD-1 is associated with prolonged survival in patients with advanced EGFR-mutated non-small cell lung cancer treated with erlotinib Lung Cancer 2016 100 77 84 27597284
- DuchnowskaRPęksaRRadeckaBPolish Brain Metastasis Consortium Immune response in breast cancer brain metastases and their microenvironment: the role of the PD-1/PD-L axis Breast Cancer Res 2016 18 1 43 27117582
- WakiKYamadaTYoshiyamaK PD-1 expression on peripheral blood T-cell subsets correlates with prognosis in non-small cell lung cancer Cancer Sci 2014 105 10 1229 1235 25117757
- SunSFeiXMaoY PD-1(+) immune cell infiltration inversely correlates with survival of operable breast cancer patients Cancer Immunol Immunother 2014 63 4 395 406 24514954
- WangXRickertMGarciaKC Structure of the quaternary complex of interleukin-2 with its alpha, beta, and gammac receptors Science 2005 310 5751 1159 1163 16293754
- YangZZGroteDMZiesmerSC Soluble IL-2Rα facilitates IL-2-mediated immune responses and predicts reduced survival in follicular B-cell non-Hodgkin lymphoma Blood 2011 118 10 2809 2820 21719603
- NakaseKKitaKMiwaH Clinical and prognostic significance of cytokine receptor expression in adult acute lymphoblastic leukemia: interleukin-2 receptor alpha-chain predicts a poor prognosis Leukemia 2007 21 2 326 332 17205058
- HashimotoYYokohamaASaitohA Prognostic importance of the soluble form of IL-2 receptorα (sIL-2Rα) and its relationship with surface expression of IL-2Rα (CD25) of lymphoma cells in diffuse large B-cell lymphoma treated with CHOP-like regimen with or without rituximab: a retrospective analysis of 338 cases J Clin Exp Hematop 2013 53 3 197 205 24369221
- GuptaMStensonMO’ByrneM Comprehensive serum cytokine analysis identifies IL-1RA and soluble IL-2Rα as predictors of event-free survival in T-cell lymphoma Ann Oncol 2016 27 1 165 172 26487586
- KorobeinikovaEMyrzaliyevaDUgenskieneR The prognostic value of IL10 and TNF alpha functional polymorphisms in premenopausal early-stage breast cancer patients BMC Genet 2015 16 70 26112140
- EngelsCCCharehbiliAvan de VeldeCJ The prognostic and predictive value of Tregs and tumor immune subtypes in postmenopausal, hormone receptor-positive breast cancer patients treated with adjuvant endocrine therapy: a Dutch TEAM study analysis Breast Cancer Res Treat 2015 149 3 587 596 25616355
- LiuCWuSMengX Predictive value of peripheral regulatory T cells in non-small cell lung cancer patients undergoing radiotherapy Oncotarget 2017 8 26 43427 43438 28624781
- LiYGaoPYangJYuHZhuYSiW Relationship between IL-10 expression and prognosis in patients with primary breast cancer Tumour Biol 2014 35 11 11533 11540 25129439
- BrownJRWimberlyHLanninDRNixonCRimmDLBossuytV Multiplexed quantitative analysis of CD3, CD8, and CD20 predicts response to neoadjuvant chemotherapy in breast cancer Clin Cancer Res 2014 20 23 5995 6005 25255793
- WestNRKostSEMartinSD Tumour-infiltrating FOXP3(+) lymphocytes are associated with cytotoxic immune responses and good clinical outcome in oestrogen receptor-negative breast cancer Br J Cancer 2013 108 1 155 162 23169287
- SuYCaiHZhengY Associations of the transforming growth factor β/Smad pathway, body mass index, and physical activity with breast cancer outcomes: results from the Shanghai breast cancer study Am J Epidemiol 2016 184 7 501 509 27651382
- BuschSAcarAMagnussonYGregerssonPRydénLLandbergG TGF-beta receptor type-2 expression in cancer-associated fibroblasts regulates breast cancer cell growth and survival and is a prognostic marker in pre-menopausal breast cancer Oncogene 2015 34 1 27 38 24336330
- WangZKYangBLiuH Regulatory T cells increase in breast cancer and in stage IV breast cancer Cancer Immunol Immunother 2012 61 6 911 916 22116346
- WolfAMWolfDSteurerMGastlGGunsiliusEGrubeck-LoebensteinB Increase of regulatory T cells in the peripheral blood of cancer patients Clin Cancer Res 2003 9 2 606 612 12576425
- EdgeSBComptonCC The American Joint Committee on Cancer: the 7th edition of the AJCC cancer staging manual and the future of TNM Ann Surg Oncol 2010 17 6 1471 1474 20180029
- MacFarlaneAW4thJillabMPlimackER PD-1 expression on peripheral blood cells increases with stage in renal cell carcinoma patients and is rapidly reduced after surgical tumor resection Cancer Immunol Res 2014 2 4 320 331 24764579
- SharpeAHPaukenKE The diverse functions of the PD1 inhibitory pathway Nat Rev Immunol 2018 18 3 153 167 28990585
- HamidullahChangkijaBKonwarR Role of interleukin-10 in breast cancer Breast Cancer Res Treat 2012 133 1 11 21 22057973
- KiyomiAMakitaMOzekiT Characterization and clinical implication of Th1/Th2/Th17 cytokines produced from three-dimensionally cultured tumor tissues resected from breast cancer patients Transl Oncol 2015 8 4 318 326 26310378