
Abstract
Background
The aim of the present study was to identify potential prognostic microRNA (miRNA) biomarkers for hepatocellular carcinoma (HCC) prognosis prediction based on a dataset from The Cancer Genome Atlas (TCGA).
Materials and methods
A miRNA sequencing dataset and corresponding clinical parameters of HCC were obtained from TCGA. Genome-wide univariate Cox regression analysis was used to screen prognostic differentially expressed miRNAs (DEMs), and multivariable Cox regression analysis was used for prognostic signature construction. Comprehensive survival analysis was performed to evaluate the prognostic value of the prognostic signature.
Results
Five miRNAs were regarded as prognostic DEMs and used for prognostic signature construction. The five-DEM prognostic signature performed well in prognosis prediction (adjusted P < 0.0001, adjusted hazard ratio = 2.249, 95% confidence interval =1.491–3.394), and time-dependent receiver–operating characteristic (ROC) analysis showed an area under the curve (AUC) of 0.765, 0.745, 0.725, and 0.687 for 1-, 2-, 3-, and 5-year HCC overall survival (OS) prediction, respectively. Comprehensive survival analysis of the prognostic signature suggests that the risk score model could serve as an independent factor of HCC and perform better in prognosis prediction than other traditional clinical indicators. Functional assessment of the target genes of hsa-mir-139 and hsa-mir-5003 indicates that they were significantly enriched in multiple biological processes and pathways, including cell proliferation and cell migration regulation, pathways in cancer, and the cyclic adenosine monophosphate (cAMP) signaling pathway.
Conclusion
Our study indicates that the novel miRNA expression signature may be a potential prognostic biomarker for HCC patients.
Introduction
Liver cancer is prevalent in People’s Republic of China and has become the fourth highest cancer-related death in Chinese males.Citation1 The majority of liver cancers are diagnosed as hepatocellular carcinoma (HCC).Citation2 Tumorigenesis is derived from environmental and genetic factors; therefore, with the completion of the human genome project, cancer genetic susceptibility has gained more and more attention. The genes in the genome that are dysregulated between tumors and normal tissues are the most promising source of diagnostic and prognostic biomarkers, as well as therapeutic targets.Citation3–Citation5 Like many other cancers, HCC is characterized by the dysregulation of multiple gene networks and signaling pathways that are ordinarily involved in tissue homeostasis. Both protein-coding genes and noncoding RNA genes are involved in these genetic effects. Although the intense investigation of protein-coding genes has been the focus, microRNAs (miRNAs) are also receiving recognition as contributors to HCC.Citation3 A miRNA is a small noncoding RNA molecule (containing about 22 nucleotides) found in plants, animals, and some viruses that functions in RNA silencing and posttranscriptional regulation of gene expression.Citation6,Citation7 The miRNA expression profiling of human cancer has identified miRNA expression signatures that are associated with cancer diagnosis, prognosis, staging, and treatment.Citation8,Citation9 Recently, miRNAs have been reported to play certain roles in HCC development, tumorigenesis, metastasis, clinical implication, and in the risk of hepatitis B virus (HBV) infection.Citation10 Therefore, a comprehensive analysis of miRNA expression profiling in HCC with a reliable approach to developing clinical applications of miRNAs is highly necessary.
With the development of high-throughput sequencing technology and the completion of The Cancer Genome Atlas (TCGA) program, a large amount of genomic data is shared publicly for cancer research. TCGA has profiled and analyzed the whole-genome sequencing data at the DNA, RNA, protein, and epigenetic levels, and generated comprehensive, multidimensional maps of the key genomic changes in 33 types of cancer.Citation11 These genomic data have been made publicly available, and help the cancer research community improve the prevention, diagnosis, and treatment of cancer.Citation12 Comprehensive analysis of TCGA HCC whole-genome sequencing data has revealed the genomic characterization of HCC somatic mutations and developed a tumor protein p53 target gene expression signature that correlates with poor survival.Citation13 However, comprehensive analysis of the miRNA prognostic signature still needs further investigation. The aim of the current study was to identify potential prognostic miRNA biomarkers for predicting survival in patients with HCC using TCGA datasets and bioinformatics analysis and to develop a miRNA expression-based prognostic signature.
Materials and methods
Data source
The HCC dataset, including Level 3 miRNA expression data, was downloaded from TCGA data portal (https://portal.gdc.cancer.gov/, accessed November 5, 2017).Citation13 The corresponding clinical information was obtained from University of California, Santa Cruz Xena browser (UCSC Xena: http://xena.ucsc.edu/, accessed November 5, 2017). The raw counts of miRNA expression data of 375 tumor samples and 50 adjacent normal liver tissues were downloaded from TCGA dataset. Because the dataset in the current study was downloaded from TCGA, and data acquiring and application complied with the TCGA publication guidelines and data access policies, additional approval by an ethics committee was not needed.
Differentially expressed miRNA (DEM) screening
miRNA expression data were normalized by using the edgeR package on the R platform.Citation14 The mean value of each miRNA greater than 0 was included in the screening of DEMs. A miRNA with a false discovery rate (FDR) < 0.05 and |log2 fold change (log2FC)| ≥ 1 of expression level between the comparison of HCC tumor and adjacent normal liver tissue was identified as DEM.
DEM expression-based prognostic signature construction
The prognostic value of miRNAs was first assessed by the univariate Cox proportional hazards regression that was performed using the survival package. These DEMs with a P-value <0.001 were regarded as prognostic DEMs whose expression levels were significantly associated with the overall survival (OS) of HCC patients. These prognostic DEMs were assessed by the “step” function to select the optimal combination and then used for prognostic model construction. To evaluate the relative contribution of these prognostic DEMs to HCC survival prediction, they were fitted into a multivariate Cox regression analysis with OS as the dependent variable. A DEM expression-based prognostic risk score model was constructed by the linear combination of the expression levels of DEMs with the multivariate Cox regression coefficient (β) as the weight. The risk score formula was as follows: risk score = expression of DEM1 × β1DEM1 + expression of DEM2 × β2 DEM2 +…expression of DEMn × βn DEMn.Citation15–Citation17 This DEM prognostic model could divide the HCC patients into high- and low-risk groups using the median risk score that was based on DEM expression. The time-dependent receiver–operating characteristic (ROC) curve was performed using the survivalROC package on the R platform to evaluate the predictive accuracy of this DEM expression-based prognostic signature in HCC OS.Citation15
Comprehensive analysis of DEM expression-based prognostic signature
To comprehensively evaluate the prognostic model, comprehensive analysis of the DEM expression-based prognostic signature was carried out. In addition to the comparison of clinical outcomes between the low- and high-risk groups, we also investigated the prognosis predictive value of the risk score by nomogram, stratified analysis, and joint effect analysis to evaluate the association between risk score and clinical status in HCC OS. Moreover, the potential application of risk score in clinical status prediction was also explored.
Target prediction and enrichment analysis
TargetscanCitation18 (http://www.targetscan.org/, accessed November 5, 2017), miRDBCitation19 (http://www.mirdb.org/, accessed November 5, 2017), and miRTarBaseCitation20 (http://mirtarbase.mbc.nctu.edu.tw/, accessed November 5, 2017) were used to predict miRNA target genes. The overlapping target genes among these three databases were identified as miRNA target genes and used for further enrichment analysis. Furthermore, miRNA target gene interaction networks were constructed with Cytoscape v3.4.0 (http://www.cytoscape.org/, accessed January 16, 2017).Citation21 The potential function of these miRNA target genes was analyzed with the Database for Annotation, Visualization, and Integrated Discovery 6.8 (DAVID 6.8, https://david.ncifcrf.gov/home.jsp, accessed November 5, 2017)Citation22 and visualized with the ggplot2 package.
Statistical analysis
Adjustment for multiple testing with the Benjamini–Hochberg procedure was used to control the FDR in edgeR.Citation23–Citation25 Univariate analysis between clinical features and OS were compared using the log-rank test; those with P < 0.05 were entered into the multivariate Cox proportional hazards regression model for adjustment. A volcano plot and heat map were drawn by the ggplot2 package on the R platform. A value of P < 0.05 was considered statistically significant. All statistical analyses were conducted with SPSS version 20.0 (IBM Corporation, Armonk, NY, USA) and R 3.3.0.
Results
DEM screening
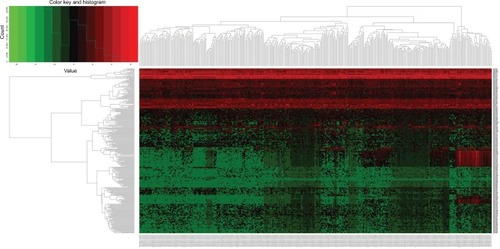
A total of 1881 miRNAs were obtained from the Level 3 miRNA expression dataset, and 320 miRNAs (Table S1) were identified as DEMs after edgeR filtering, which meets the criterion of FDR < 0.05 and | log2FC| ≥ 1. The volcano plot and heat map of these 320 DEMs were visualized by the ggplot2 package and shown in and , respectively.
Figure 1 Volcano plot of DEMs in HCC.
Abbreviations: DEMs, differentially expressed microRNAs; FDR, false discovery rate; HCC, hepatocellular carcinoma.
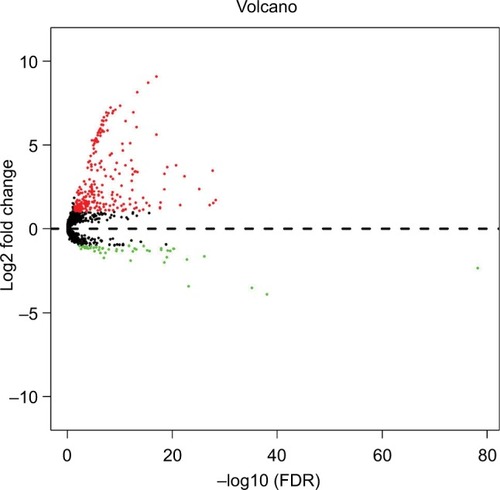
Figure 2 Heat map of 320 DEMs in HCC.
Abbreviations: DEMs, differentially expressed microRNAs; HCC, hepatocellular carcinoma.
Construction of the DEM-based prognostic signature
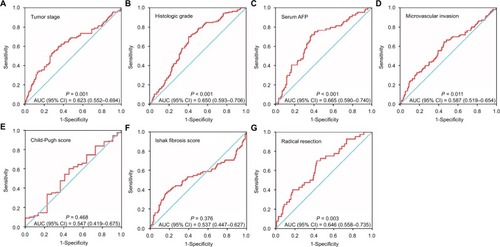
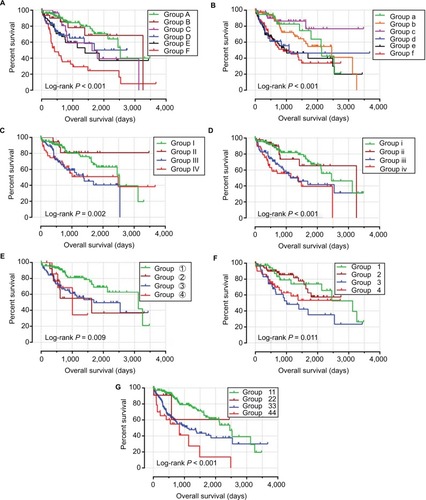
The univariate Cox regression analysis results of DEMs are shown in Table S2, and suggest that there were 17 DEMs gained significant prognostic value for HCC with a P-value less than 0.001. By analyzing the expression level of these DEMs, we found that five miRNAs (hsa-mir-137, hsa-mir-3680-2, hsa-mir-6728, hsa-mir-3660, and hsa-mir-2682) had low expression in tumor tissue, and more than 20% of samples had an expression of zero. Therefore, only the remaining 12 miRNAs were included in the step function screening to investigate the optimal combination, and all the miRNA expression data were log2 transformed for further analysis. The following five miRNAs were screened through the step function and used to develop a miRNA prognostic model: hsa-mir-139, hsa-mir-101-2, hsa-mir-105-2, hsa-mir-9-3, and hsa-mir-5003. Kaplan–Meier and ROC curves of these prognostic DEMs are shown in and , respectively. A multivariate Cox regression analysis was used to assess the relative contribution of these prognostic DEMs in survival prediction. The risk score formula was as follows: risk score = expression of hsa-mir-139 × (−0.1795) + expression of hsa-mir-101-2 × (−0.2396) + expression of hsa-mir-105-2 × (0.0533) + expression of hsa-mir-9-3 × (0.0728) + expression of hsa-mir-5003 × (0.2640). Survival analysis of HCC clinical characteristics and risk scores are summarized in and show that tumor stage and radical resection were significantly associated with HCC OS and were included into a multivariate Cox proportional hazards regression model for adjustment. Patients with a high-risk score have a shorter median survival time (MST) than those with a low-risk score (931 vs. 2456 days for high risk vs. low risk, , ), and significantly increased risk of death (adjusted P < 0.0001, adjusted hazard ratio = 2.249, 95% confidence interval [CI] = 1.491–3.394 for OS), after being adjusted for tumor stage and radical resection. Time-dependent ROC analysis with the survivalROC package demonstrated that this miRNA expression-based prognostic signature also performed well in HCC OS prediction; the area under the curve (AUC) of the time-dependent ROC curve was 0.765, 0.745, 0.725, and 0.687 for 1-, 2-, 3-, and 5-year survival (). The expression distribution of these miRNAs between tumor tissue and adjacent normal liver tissue is shown in , whereas the expression distribution in low- and high-risk groups is shown in . We also explored the potential use of this risk score in the status of clinical characteristic prediction, and the ROC curves are shown in . This 5-miRNA prognostic signature performed well in predicting HCC tumor stage (P = 0.001, AUC = 0.623, 95% CI = 0.552–0.694; ), histologic grade (P < 0.001, AUC = 0.650, 95% CI = 0.593–0.706; ), serum AFP (P < 0.001, AUC = 0.665, 95% CI = 0.590–0.740; ), microvascular invasion (P = 0.011, AUC = 0.587, 95% CI = 0.519–0.654; ), and radical resection (P = 0.003, AUC = 0.646, 95% CI = 0.558–0.735; ).
Table 1 Distribution of HCC patients’ characteristics and prognosis analysis
Figure 3 The Kaplan–Meier curves of five prognostic DEMs in HCC.
Notes: The order of Kaplan–Meier curves of five prognostic DEMs were as follows: hsa-mir-105-2 (A), hsa-mir-5003 (B), hsa-mir-101-2 (C), hsa-mir-139 (D), and hsa-mir-9-3 (E).
Abbreviations: DEMs, differentially expressed microRNAs; HCC, hepatocellular carcinoma.
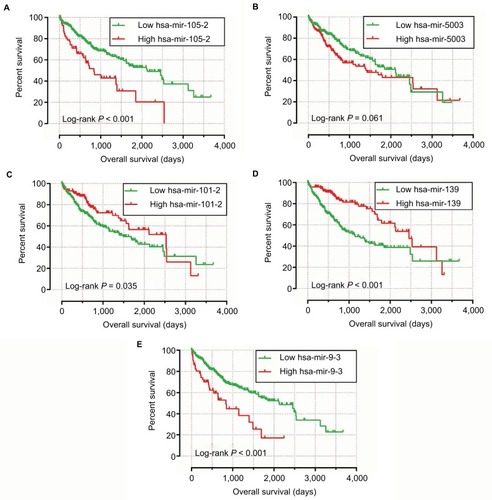
Figure 4 ROC curves of five prognostic DEMs to distinguish HCC tissue from adjacent normal liver tissue.
Notes: The order of ROC curves of five prognostic DEMs were as follows: hsa-mir-105-2 (A), hsa-mir-5003 (B), hsa-mir-101-2 (C), hsa-mir-139 (D), and hsa-mir-9-3 (E).
Abbreviations: AUC, area under the curve; CI, confidence interval; DEMs, differentially expressed microRNAs; HCC, hepatocellular carcinoma; ROC, receiver–operating characteristic.
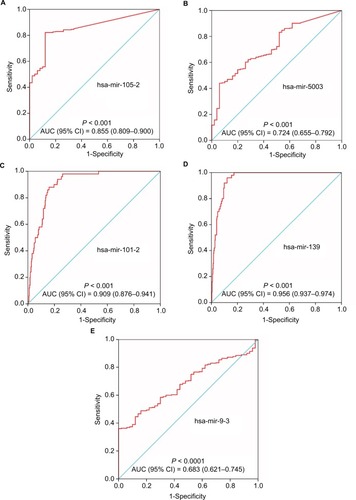
Figure 5 Prognostic risk score model analysis of five prognostic DEMs in HCC patients.
Notes: (A) From top to bottom are the risk score, patients’ survival status distribution, and five prognostic DEMs’ expression heat map for low- and high-risk groups. (B) Kaplan–Meier curves for low- and high-risk groups. (C) ROC curve for predicting survival in HCC patients by the risk score.
Abbreviations: DEMs, differentially expressed microRNAs; HCC, hepatocellular carcinoma; ROC, receiver–operating characteristic.
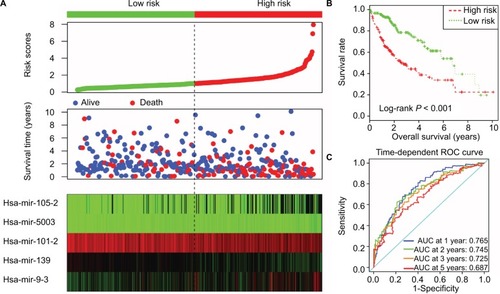
Figure 6 Expression level of five prognostic DEMs in tumor tissue and adjacent normal liver tissue, low- and high-risk groups, respectively.
Notes: (A) Scatter plot of five prognostic DEMs’ expression level between HCC tumor tissue and adjacent normal liver tissue. (B) Scatter plot of five prognostic DEMs’ expression level between low- and high-risk groups; *P<0.05; ****P<0.0001.
Abbreviations: DEMs, differentially expressed microRNAs; HCC, hepatocellular carcinoma.
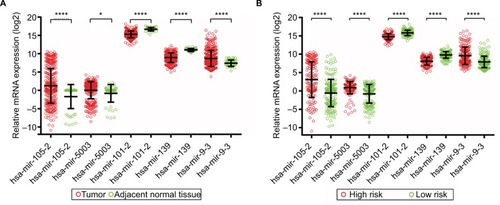
Figure 7 The predictive value of the risk score for the HCC clinical parameters.
Notes: ROC curve of risk score for clinical parameters: tumor stage: cutoff by stage I+II and stage III+IV (A); histologic grade: cutoff by G1+G2 and G3+G4 (B); serum AFP: cutoff by 400 ng/mL (C); MVI: cutoff by with and without MVI (D); and Child–Pugh score: cutoff by Child A and B+C (E); Ishak fibrosis score: cutoff by 0 and 1+2+3+4+5+6 (F); radical resection: cutoff by R0 and R1+R2+RX (G).
Abbreviations: AFP, α-fetoprotein; AUC, area under the curve; CI, confidence interval; HCC, hepatocellular carcinoma; ROC, receiver-operating characteristic; MVI, microvascular invasion.
Stratified and joint effects analysis
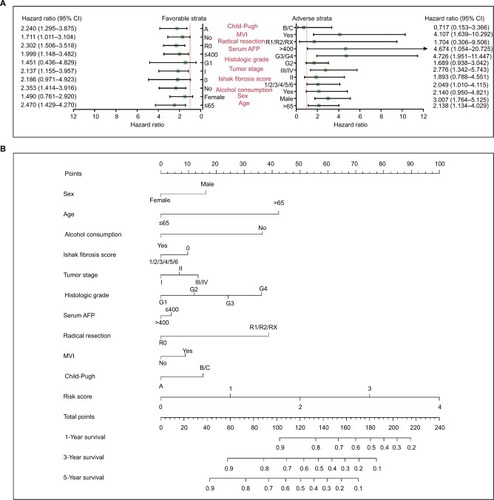
To further investigate the association between risk score and clinical characteristics in HCC OS, comprehensive survival analysis of nomogram, stratified, and joint effects survival analysis was carried out. The stratified analysis suggests that a high-risk score significantly increased the risk of death in patients with all favorable strata except in patients with G1 grade, without fibrosis and females, and all adverse strata except in patients with Child–Pugh B/C score, without radical resection, G1 grade, tumor stage II, and with alcohol consumption (), indicating that this 5-miRNA prognostic signature was independent of the clinical characteristics. A nomogram was drawn by rms and its auxiliary packages based on the data of 155 HCC patients with complete clinical information in TCGA. It substantiated that the 5-miRNA prognostic signature contributes the most risk points (ranged 0–100), whereas the other clinical characteristics contribute much less ().
Figure 8 The relationship between risk score and clinical information.
Notes: (A) Stratified analysis of association between risk score and OS in HCC. (B) Nomogram for predicting the 1-, 3-, and 5-year event (death) with risk score and clinical information.
Abbreviations: AFP, α-fetoprotein; CI, confidence interval; HCC, hepatocellular carcinoma; MVI, microvascular invasion; OS, overall survival.
Joint effects analysis of the 5-miRNA prognostic signature and clinical parameters indicate that this prognostic signature performed well in OS prediction and in combination with the clinical parameters showed a better predictive value for HCC OS (; ).
Table 2 Joint effects survival analysis of clinical factors and the DEMs’ signature risk score with OS in HCC patients
Figure 9 Joint effects analysis of OS stratified by risk score and HCC clinical parameters.
Notes: Joint effects analysis stratified by risk score and following clinical parameters: tumor stage (A), histologic grade (B), serum AFP (C), microvascular invasion (D), Child–Pugh score (E), Ishak fibrosis score (F), and radical resection (G).
Abbreviations: AFP, α-fetoprotein; HCC, hepatocellular carcinoma; OS, overall survival.
Target prediction and enrichment analysis
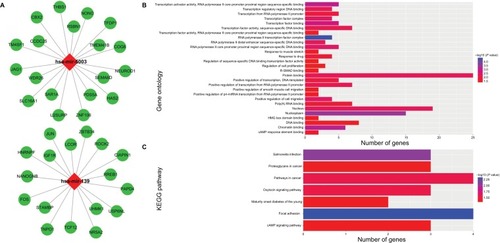
To assess the potential biological function of the five miRNAs, the miRNA target genes were predicted by three independent miRNA target gene prediction websites: Targetscan, miRDB, and miRTarBase. The candidate target genes of each miRNA predicted in all three websites were identified as miRNA target genes. Because hsa-mir-9-3, hsa-mir-101-2, and hsa-mir-105-2 were not available in the Targetscan database, only the miRNA target genes of hsa-mir-139 and hsa-mir-5003 were used for further enrichment analysis. A total of 36 genes were regarded as miRNA target genes for these two miRNAs and used for enrichment analysis and miRNA target gene interaction network construction. The miRNA target gene interaction networks are shown in . Functional assessment suggests that these miRNA target genes were significantly enriched in multiple biological processes, such as the regulation of cell proliferation and cell migration, cyclic adenosine monophosphate (cAMP) response element binding, response to drugs, and positive regulation of pri-miRNA transcription from RNA polymerase II promoter (). The Kyoto Encyclopedia of Genes and Genomes enrichment indicates that pathways in cancer, cAMP signaling pathway, proteoglycans in cancer, and focal adhesion were also significantly enriched ().
Figure 10 The prognostic miRNAs-target genes interactions network and their enrichment analysis results.
Notes: (A) The prognostic miRNAs-target genes interactions network. (B) GO term enrichment results. (C) KEGG enrichment results.
Abbreviations: GO, gene ontology; KEGG, Kyoto Encyclopedia of Genes and Genomes.
Discussion
The data mining of TCGA miRNA datasets has been widely used in cancer prognosis prediction. Similar miRNA expression-based prognostic signatures for cancer prognosis prediction have been investigated in numerous studies. For instance, miRNA expression-based prognostic signatures, which were identified by Cox proportional regression models in cancer prognosis prediction using TCGA datasets, have been developed in multiple cancers, such as pancreatic cancer,Citation26,Citation27 stomach adenocarcinoma,Citation28 head and neck squamous cell carcinoma,Citation29,Citation30 gliomas,Citation31 glioblastoma,Citation32–Citation34 cervical cancer,Citation35 bladder cancer,Citation36 breast cancer,Citation37,Citation38 colon cancer,Citation39 lung cancer,Citation40,Citation41 and HCC.Citation42–Citation44 In addition, diagnosticCitation45–Citation47 and metastasisCitation48 related miRNA signature biomarkers have been investigated in multiple cancers using TCGA datasets. Updates in the TCGA HCC dataset and the miRNA expression-based prognostic signatures require comprehensive survival analysis to validate; therefore, further investigations of miRNA expression prognostic signatures with a reliable method and comprehensive evaluation is necessary. The advantage of the current study was that the optimum combination of these prognostic miRNAs was investigated using the “step” function of the R platform. Additionally, we also assessed the accuracy of the prognostic signature by the survivalROC package. Furthermore, comprehensive survival analysis of our five-DEM prognostic signature has been evaluated by nomogram, stratified, and joint effects survival analysis to investigate its potential prognosis application.
Previous studies have demonstrated that miRNAs may serve as therapeutic targets and diagnosis and prognostic biomarkers in HCC.Citation49,Citation50 In the current study, we used five DEMs to construct a miRNA expression-based prognostic signature to predicted HCC clinical outcome. Consistent with our finding, a study by Gu et al also observed that miR-139 was significantly downregulated in HCC tumor tissue and may be a potential diagnostic biomarker of HCC. Furthermore, low miR-139 expression in tumor tissue was significantly associated with increased risk of death.Citation51 Similar results were also validated by other researchers, and conclude that miR-139 may be a novel prognostic biomarker of HCC.Citation52 Other studies have also substantiated that miR-139 was significantly downregulated in HCC tissueCitation53,Citation54 and serves as a tumor suppressor that inhibits HCC cell metastasis, progression, epithelial–mesenchymal transition, migration proliferation, and invasion by regulated genes and pathways.Citation53–Citation56 The miR-139 expression level also acts as a prognostic marker in colon cancer and bile duct cancer.Citation57,Citation58
Previous studies report that miR-9-3 was found to be specifically methylated in tumors of patients with non-small cell lung cancers and serves as a prognostic marker. Moreover, aberrant miR-9-3 methylation was associated with tumor progression.Citation59,Citation60 Aberrant methylation of miR-9-3 has also been reported in bladder cancer,Citation61 clear cell renal cell carcinoma,Citation62 oral and oropharyngeal squamous cell carcinomas,Citation63 HCC,Citation64,Citation65 and thymoma and thymic carcinoma.Citation66 In addition, hypermethylation of miR-9-3 was a potential diagnostic marker in bladder cancerCitation61 and HCC,Citation65 whereas miR-9-3 methylation status was also significantly associated with OS in HCCCitation65 and increased risk of recurrence in clear cell renal cell carcinoma.Citation62 In the current study, we focused on investigating the association between the expression of hsa-mir-9-3 and clinical outcome; therefore, the hsa-miR-9-3 methylation status in HCC still needs further analysis. Although the current study did not mine the methylation data of hsa-mir-9-3 using TCGA datasets, our study was the first study to reveal the value of hsa-mir-9-3 expression in HCC prognosis and diagnosis.
Hsa-mir-101-2 is encoded by a gene located in 9p21; studies by Ma et al reveal that miR-101-2-5p was involved in lipid metabolism through binding with the 3′-untranslated region of the ApoB gene in the liver of egg-laying chickens.Citation67 Furthermore, work by Bae et al suggests that genetic variations of miR-101-2 had a significant association with the clearance of HBV infection.Citation68 In cancer research, genetic variations of miR-101-2 were associated with significantly increased risk of genetic susceptibility in breast cancer.Citation69 Functional research in gastric cancer indicates that miR-101-2 was notably downregulated in gastric cancer tumor tissues and acts as a potential tumor suppressor in gastric cancer. Inhibited expression of miR-101-2 significantly reduced cell viability and colony formation, increased cell death, and reduced cell migration and invasion in gastric cancer cells.Citation70 A similar data mining study of TCGA in breast cancer demonstrated that miR-101-2 was downregulated in breast cancer tumor tissue, and may be a potential biomarker for the prognosis and diagnosis of breast cancer. Additionally, the expression level of miR-101-2 was associated with the clinical parameters of tumor progression.Citation71 In the present study, we also observed miR-101-2 downregulation in HCC tumor tissue and low miR-101-2 expression were significantly associated with poor clinical outcome, which is consistent with previous studies. However, presently, the functional verification experiments of miR-101-2 in HCC have not been reported and still need to be further confirmed. Hsa-mir-9-3, hsa-mir-101-2, and hsa-mir-105-2 have not been reported in previous studies, and their function still needs further investigation.
Functional assessment of the target genes of hsa-mir-139 and hsa-mir-5003 suggests that these target genes were significantly enriched in the regulation of cell-based biological processes, such as cell proliferation and cell migration. Recently, miR-139 has been reported as a tumor suppressor in various types of cancer and can regulate many cancer-related genes and pathways that affect the cell function.Citation72–Citation74 Previous experimental studies have substantiated that overexpression of miR-139 expression in HCC cell lines can inhibit cell proliferation, migration, and invasion through regulating multiple genes and pathways.Citation52,Citation53,Citation55,Citation56 MiR-139 downregulation increased the invasive abilities of HCC cells in vitro and HCC metastasis in vivo.Citation54 These reports conclude that the function of miR-139 may be a potential tumor suppressor in HCC and may provide a therapeutic strategy for the treatment of HCC patients, especially for HCC tumor metastasis.Citation54–Citation56 By reviewing the literature, we failed to retrieve the relevant reports on the function of hsa-mir-5003 in cell proliferation and migration in biological processes.
In the current study, through a comprehensive survival analysis of the prognostic signature, we have developed an accurate risk score model for HCC prognosis prediction based on the expression of five miRNAs. The risk score of patients with HCC can be divided into high- and low-risk groups, and the clinical outcome of HCC patients was significantly different between high- and low-risk groups. Time-dependent ROC analysis also suggested that this risk score model has long-term prognosis prediction and has relatively good accuracy. Stratified analysis revealed that this risk score model was an independent factor of HCC, while joint effects analysis and nomogram indicated that the risk score model performed better than traditional prognostic markers. Although this model performs well in HCC prognosis prediction, there are some limitations in the current study that still need clarification. First, because the clinical parameters from the TCGA database were not complete, such as the detailed information of treatment after the surgery was not available, we therefore could not perform a comprehensive survival analysis of the miRNA expression-based prognostic signature that considered all the potential prognostic factors of HCC. Second, patients in the current study were exclusively from a single cohort with a relatively small sample size, which may serve to bias our results. In addition, our sample size was not large enough to accurately validate the impact of the prognostic signature on OS in all strata of the stratified analysis. Therefore, our findings still need further verification in independent larger cohorts.
Despite these limitations, our current study has identified numerous DEMs, which may have potential value in HCC diagnosis and prognosis. We also constructed an effective prognostic signature to predict HCC prognosis that may have value in potential clinical applications.
Conclusion
Our study has identified 320 DEMs between HCC tumor tissue and adjacent normal liver tissue and assessed their predictive value in HCC prognosis. Five of the DEMs (hsa-mir-139, hsa-mir-101-2, hsa-mir-105-2, hsa-mir-9-3, and hsa-mir-5003) were used for prognostic signature construction based on their expression level. Survival analysis indicates that this five-DEM prognostic signature was significantly associated with HCC OS, and time-dependent ROC analysis also revealed that the prognostic signature showed a good performance in HCC survival prediction with the AUC of 0.765, 0.745, 0.725, and 0.687 for 1-, 2-, 3-, and 5-year survival, respectively. Stratified analysis substantiated that the prognostic signature serves as an independent factor of HCC and performs better in prognosis prediction than other traditional clinical indicators. Joint effects analysis demonstrated that a combination of this prognostic signature and other clinical indicators could obviously improve the performance of HCC prognosis prediction, and the nomogram also revealed that the prognostic signature contributed more than other traditional clinical indicators in HCC prognosis prediction. In addition, these five DEMs may serve as a potential independent risk factor and prognosis indicator for HCC patients and may also have potential diagnostic and prognostic value in HCC. However, due to limitations in our study, validation of our findings is necessary with independent cohorts. Moreover, additional findings obtained in our study are also worthy of further investigation.
Acknowledgments
This work was supported in part by the National Nature Science Foundation of China (81560535, 81072321, 30760243, 30460143, and 30560133), 2009 Program for New Century Excellent Talents in University (NCET), Guangxi Nature Sciences Foundation (GuiKeGong 1104003A-7), and Guangxi Health Ministry Medicine Grant (Key-Scientific Research-Grant Z201018). The present study is also partly supported by Scientific Research Fund of the Health and Family Planning Commission of Guangxi Zhuang Autonomous Region (Z2016318). We would also acknowledge the supported provided by the National Key Clinical Specialty Programs (General Surgery and Oncology) and the Key Laboratory of Early Prevention and Treatment for Regional High-Incidence-Tumor (Guangxi Medical University), Ministry of Education, China. The authors thank the contributors of TCGA (https://cancergenome.nih.gov/) and UCSC Xena (http://xena.ucsc.edu/) for sharing the HCC data on open access. In addition, we would like to acknowledge the helpful comments on this article received from our reviewers.
Supplementary materials
Table S1 DEMs identified by the edgeR package.
Abbreviation: DEMs, differentially expressed microRNAs.
Table S2 The univariate survival analysis results of the DEMs.
Abbreviation: DEMs, differentially expressed microRNAs.
Disclosure
The authors report no conflicts of interest in this work.
References
- ChenWZhengRBaadePDCancer statistics in China, 2015CA Cancer J Clin201666211513226808342
- TangDNaganoHNakamuraMClinical and pathological features of Allen’s type C classification of resected combined hepatocellular and cholangiocarcinoma: a comparative study with hepatocellular carcinoma and cholangiocellular carcinomaJ Gastrointest Surg200610798799816843869
- GeorgeJPatelTNoncoding RNA as therapeutic targets for hepatocellular carcinomaSemin Liver Dis2015351637425632936
- KlingenbergMMatsudaADiederichsSPatelTNon-coding RNA in hepatocellular carcinoma: mechanisms, biomarkers and therapeutic targetsJ Hepatol201767360361828438689
- ShibataCOtsukaMKishikawaTDiagnostic and therapeutic application of noncoding RNAs for hepatocellular carcinomaWorld J Hepatol2015711625624991
- AmbrosVThe functions of animal microRNAsNature2004431700635035515372042
- BartelDPMicroRNAs: genomics, biogenesis, mechanism, and functionCell2004116228129714744438
- SempereLFIntegrating contextual miRNA and protein signatures for diagnostic and treatment decisions in cancerExpert Rev Mol Diagn201111881382722022944
- LuJGetzGMiskaEAMicroRNA expression profiles classify human cancersNature2005435704383483815944708
- WangZLiXThe role of noncoding RNA in hepatocellular carcinomaGland Surg201321252925083452
- Cancer Genome Atlas Research NetworkWeinsteinJNCollissonEAThe Cancer Genome Atlas pan-cancer analysis projectNat Genet201345101113112024071849
- TomczakKCzerwińskaPWiznerowiczMThe Cancer Genome Atlas (TCGA): an immeasurable source of knowledgeContemp Oncol (Pozn)2015191AA68A7725691825
- Cancer Genome Atlas Research Network. Electronic address: [email protected]; Cancer Genome Atlas Research NetworkComprehensive and integrative genomic characterization of hepatocellular carcinomaCell201716971327.e231341.e2328622513
- RobinsonMDMcCarthyDJSmythGKedgeR: a Bioconductor package for differential expression analysis of digital gene expression dataBioinformatics201026113914019910308
- LiaoXHuangKHuangRGenome-scale analysis to identify prognostic markers in patients with early-stage pancreatic ductal adenocarcinoma after pancreaticoduodenectomyOnco Targets Ther2017104493450628979141
- ZhouMZhaoHWangZIdentification and validation of potential prognostic lncRNA biomarkers for predicting survival in patients with multiple myelomaJ Exp Clin Cancer Res20153410226362431
- ZhouMSunYSunYComprehensive analysis of lncRNA expression profiles reveals a novel lncRNA signature to discriminate nonequivalent outcomes in patients with ovarian cancerOncotarget2016722324333244827074572
- AgarwalVBellGWNamJWBartelDPPredicting effective microRNA target sites in mammalian mRNAsElife20154138
- WongNWangXmiRDB: an online resource for microRNA target prediction and functional annotationsNucleic Acids Res201543 Database issueD146D15225378301
- ChouCHShresthaSYangCDmiRTarBase update 2018: a resource for experimentally validated microRNA-target interactionsNucleic Acids Res201846D1D296D30229126174
- ShannonPMarkielAOzierOCytoscape: a software environment for integrated models of biomolecular interaction networksGenome Res200313112498250414597658
- DennisGJrShermanBTHosackDADAVID: database for annotation, visualization, and integrated discoveryGenome Biol200345P312734009
- BenjaminiYHochbergYControlling the false discovery rate: a practical and powerful approach to multiple testingJ Roy Statist Soc Series B Stat Methodol1995571289300
- ReinerAYekutieliDBenjaminiYIdentifying differentially expressed genes using false discovery rate controlling proceduresBioinformatics200319336837512584122
- BenjaminiYDraiDElmerGKafkafiNGolaniIControlling the false discovery rate in behavior genetics researchBehav Brain Res20011251–227928411682119
- LiangLWeiDMLiJJPrognostic microRNAs and their potential molecular mechanism in pancreatic cancer: a study based on The Cancer Genome Atlas and bioinformatics investigationMol Med Rep201817193995129115476
- ZhouXHuangZXuLA panel of 13-miRNA signature as a potential biomarker for predicting survival in pancreatic cancerOncotarget2016743696166962427626307
- DingBGaoXLiHLiuLHaoXA novel microRNA signature predicts survival in stomach adenocarcinomaOncotarget2017817281442815328423653
- WongNKhwajaSSBakerCMPrognostic microRNA signatures derived from The Cancer Genome Atlas for head and neck squamous cell carcinomasCancer Med2016571619162827109697
- ShiHChenJLiYIdentification of a six microRNA signature as a novel potential prognostic biomarker in patients with head and neck squamous cell carcinomaOncotarget2016716215792159026933913
- YanWLiRLiuYMicroRNA expression patterns in the malignant progression of gliomas and a 5-microRNA signature for prognosisOncotarget2014524129081291525415048
- LiRGaoKLuoHIdentification of intrinsic subtype-specific prognostic microRNAs in primary glioblastomaJ Exp Clin Cancer Res201433924438238
- WangZBaoZYanWIsocitrate dehydrogenase 1 (IDH1) mutation-specific microRNA signature predicts favorable prognosis in glioblastoma patients with IDH1 wild typeJ Exp Clin Cancer Res2013325923988086
- HayesJThygesenHTumilsonCPrediction of clinical outcome in glioblastoma using a biologically relevant nine-microRNA signatureMol Oncol20159370471425499534
- LiangBLiYWangTA three miRNAs signature predicts survival in cervical cancer using bioinformatics analysisSci Rep201771562428717180
- ZhouHTangKXiaoHA panel of eight-miRNA signature as a potential biomarker for predicting survival in bladder cancerJ Exp Clin Cancer Res2015345325991007
- ZhouXWangXHuangZXuLZhuWLiuPAn ER-associated miRNA signature predicts prognosis in ER-positive breast cancerJ Exp Clin Cancer Res2014339425373603
- VoliniaSCroceCMPrognostic microRNA/mRNA signature from the integrated analysis of patients with invasive breast cancerProc Natl Acad Sci U S A2013110187413741723589849
- JacobHStanisavljevicLStorliKEHestetunKEDahlOMyklebustMPIdentification of a sixteen-microRNA signature as prognostic biomarker for stage II and III colon cancerOncotarget2017850878378784729152124
- LiXShiYYinZXueXZhouBAn eight-miRNA signature as a potential biomarker for predicting survival in lung adenocarcinomaJ Transl Med20141215924893932
- GaoXWuYYuWLiHIdentification of a seven-miRNA signature as prognostic biomarker for lung squamous cell carcinomaOncotarget2016749816708167927835574
- LuMKongXWangHHuangGYeCHeZA novel microRNAs expression signature for hepatocellular carcinoma diagnosis and prognosisOncotarget2017858775878428060739
- LiuGWangHFuJDLiuJYYanAGGuanYYA five-miRNA expression signature predicts survival in hepatocellular carcinomaAPMIS2017125761462228430373
- ZhangJChongCCChenGGLaiPBA seven-microRNA expression signature predicts survival in hepatocellular carcinomaPLoS One2015106e012862826046780
- ZhouXWenWZhuJA six-microRNA signature in plasma was identified as a potential biomarker in diagnosis of esophageal squamous cell carcinomaOncotarget2017821344683448028380431
- ZhangYSuiJShenXDifferential expression profiles of microR-NAs as potential biomarkers for the early diagnosis of lung cancerOncol Rep20173763543355328498428
- XiongDDLvJWeiKLA nine-miRNA signature as a potential diagnostic marker for breast carcinoma: an integrated study of 1,110 casesOncol Rep20173763297330428440475
- Ab MutalibNSOthmanSNMohamad YusofAAbdullah SuhaimiSNMuhammadRJamalRIntegrated microRNA, gene expression and transcription factors signature in papillary thyroid cancer with lymph node metastasisPeerJ20164e211927350898
- GiordanoSColumbanoAMicroRNAs: new tools for diagnosis, prognosis, and therapy in hepatocellular carcinoma?Hepatology201357284084723081718
- ZhangQPuRDuYNon-coding RNAs in hepatitis B or C-associated hepatocellular carcinoma: potential diagnostic and prognostic markers and therapeutic targetsCancer Lett2012321111222425745
- LiTYinJYuanLDownregulation of microRNA-139 is associated with hepatocellular carcinoma risk and short-term survivalOncol Rep20143141699170624549282
- WangZDingQLiYReanalysis of microRNA expression profiles identifies novel biomarkers for hepatocellular carcinoma prognosisTumour Biol20163711147791478727633066
- GuWLiXWangJmiR-139 regulates the proliferation and invasion of hepatocellular carcinoma through the WNT/TCF-4 pathwayOncol Rep201431139740424190507
- WongCCWongCMTungEKThe microRNA miR-139 suppresses metastasis and progression of hepatocellular carcinoma by down-regulating Rho-kinase 2Gastroenterology2011140132233120951699
- QiuGLinYZhangHWuDmiR-139-5p inhibits epithelial-mesenchymal transition, migration and invasion of hepatocellular carcinoma cells by targeting ZEB1 and ZEB2Biochem Biophys Res Commun2015463331532126022123
- FanQHeMDengXDerepression of c-Fos caused by microRNA-139 down-regulation contributes to the metastasis of human hepatocellular carcinomaCell Biochem Funct201331431932423001723
- WangMWenTFHeLHLiCZhuWJTrishulNMA six-microRNA set as prognostic indicators for bile duct cancerInt J Clin Exp Med2015810172611727026770318
- LiuXDuanBDongYMicroRNA-139-3p indicates a poor prognosis of colon cancerInt J Clin Exp Pathol20147118046805225550849
- HellerGWeinzierlMNollCGenome-wide miRNA expression profiling identifies miR-9-3 and miR-193a as targets for DNA methylation in non-small cell lung cancersClin Cancer Res20121861619162922282464
- KitanoKWatanabeKEmotoNCpG island methylation of microRNAs is associated with tumor size and recurrence of non-small-cell lung cancerCancer Sci2011102122126213121917081
- ShimizuTSuzukiHNojimaMMethylation of a panel of microRNA genes is a novel biomarker for detection of bladder cancerEur Urol20136361091110023200812
- HildebrandtMAGuJLinJHsa-miR-9 methylation status is associated with cancer development and metastatic recurrence in patients with clear cell renal cell carcinomaOncogene201029425724572820676129
- MinorJWangXZhangFMethylation of microRNA-9 is a specific and sensitive biomarker for oral and oropharyngeal squamous cell carcinomasOral Oncol2012481737822133638
- PotapovaAAlbatCHasemeierBSystematic cross-validation of 454 sequencing and pyrosequencing for the exact quantification of DNA methylation patterns with single CpG resolutionBMC Biotechnol201111621235780
- AnwarSLAlbatCKrechTConcordant hypermethylation of intergenic microRNA genes in human hepatocellular carcinoma as new diagnostic and prognostic markerInt J Cancer2013133366067023364900
- EnknerFPichlhöferBZaharieATMolecular profiling of thymoma and thymic carcinoma: genetic differences and potential novel therapeutic targetsPathol Oncol Res201723355156427844328
- MaZLiHZhengHMicroRNA-101-2-5p targets the ApoB gene in the liver of chicken (Gallus Gallus)Genome201760867367828636837
- BaeJSKimJHPasajeCFAssociation study of genetic variations in microRNAs with the risk of hepatitis B-related liver diseasesDig Liver Dis2012441084985422658643
- ChenJQinZJiangYGenetic variations in the flanking regions of miR-101-2 are associated with increased risk of breast cancerPLoS One201491e8631924475105
- RiquelmeITapiaOLealPmiR-101-2, miR-125b-2 and miR-451a act as potential tumor suppressors in gastric cancer through regulation of the PI3K/AKT/mTOR pathwayCell Oncol (Dordr)2016391233326458815
- LiCYXiongDDHuangCQClinical value of miR-101-3p and biological analysis of its prospective targets in breast cancer: a study based on The Cancer Genome Atlas (TCGA) and bioinformaticsMed Sci Monit2017231857187128416776
- SannigrahiMKSharmaRPandaNKKhullarMRole of non-coding RNAs in head and neck squamous cell carcinoma: a narrative reviewOral Dis Epub2017921
- YangLYinDWangYCaoLInhibition of the growth of hepatocellular carcinoma cells through fibroblast growth factor 18 suppressed by miR-139Oncol Rep20173842565257128765917
- LuoHYangRLiCMicroRNA-139-5p inhibits bladder cancer proliferation and self-renewal by targeting the Bmi1 oncogeneTumour Biol2017397101042831771841428720065