
Abstract
Background
A substantial increase in the number of non-smoking lung adenocarcinoma (LAC) patients has been drawing extensive attention in the past decade. However, effective biomarkers, which could guide the precise treatment, are still limited for identifying high-risk patients. Here, we provide a network-based signature to predict the survival of non-smoking LAC.
Materials and methods
Gene expression profiles were downloaded from The Cancer Genome Atlas and Gene Expression Omnibus. Significant gene co-expression networks and hub genes were identified by Weighted Gene Co-expression Network Analysis. Potential mechanisms and pathways of co-expression networks were analyzed by Gene Ontology. The predictive signature was constructed by penalized Cox regression analysis and tested in two independent datasets.
Results
Two distinct co-expression modules were significantly correlated with the non-smoking status across 4 Gene Expression Omnibus datasets. Gene Ontology revealed that nuclear division and cell cycle pathways were main mechanisms of the blue module and that genes in the turquoise module were involved in lymphocyte activation and cell adhesion pathways. Seventeen genes were selected from hub genes at an optimal lambda value and built the prognostic signature. The prognostic signature distinguished the survival of non-smoking LAC (training: hazard ratio [HR]=3.696, 95% CI: 2.025–6.748, P<0.001; testing: HR=2.9, 95% CI: 1.322–6.789, P=0.006; HR=2.78, 95% CI: 1.658–6.654, P=0.022) and had moderate predictive abilities in the training and validation datasets.
Conclusion
The prognostic signature is a promising predictor of non-smoking LAC patients, which might benefit clinical practice and precision therapeutic management.
Introduction
Lung adenocarcinoma (LAC) is the main histological type of non-small cell lung carcinoma (NSCLC), making up 40% of lung cancer patients. There is a growing concern about the increasing number of the non-smoking LAC in the past decade. Previous evidence shows that the non-smoking LAC patients are more likely to be young, women, and carrying epidermal growth factor receptor mutations, which are different from smoking LAC patients.Citation1,Citation2 In addition, etiology and biological behaviors of non-smoking LAC are remarkably different from smoking LAC, which make them different in therapeutic responses and prognosis.Citation3,Citation4 Reliable signatures can accurately estimate the prognosis of disease and have tremendous significance in therapeutic management. Increasing number of studies are proposing gene expression-based signatures for survival stratification of NSCLC patients.Citation5 However, predictive signatures for non-smoking LAC have not been well addressed. Therefore, promising prognostic signatures for the non-smoking LAC are needed to stratify patients and predict the outcomes.
Weighted gene co-expression network analysis (WGCNA) is a feasible approach, which handles multi-dimensional expression data to construct sub-network atlas related to clinical features. Clarke et al reported a large-scale co-expression analysis in breast cancer from 13 microarrays.Citation6 Sun et al identified several hub genes related to the stage and grade of ovarian cancer.Citation7 Another study uncovered biomarkers for the prognosis of stage II and III colon cancer by the network-based approach.Citation8 These studies reinforced the effect of WGCNA as a method for discovering useful and reliable cancer biomarkers.
In this study, we developed a prognostic signature to predict the survival of non-smoking LAC patients by WGCNA, which could help better understand the potential mechanisms and aid in optimizing treatment.
Materials and methods
Microarray analysis
The expression profiles of LAC were retrieved from the Gene Expression Omnibus (GEO) data repository (http://www.ncbi.nlm.nih.gov/geo/) and The Cancer Genome Atlas (TCGA). The datasets that contained non-smoking status and normal tissues were included into subsequent analysis. To avoid bias, we only included datasets with large sample sizes. Gene expression profile was assessed by the HG-U133A microarrays from Affymetrix Human Genome. The background correction was performed by robust multi-array (RMA) method to remove the noise signals. Quantile standard method was used to normalize the data. Gene annotation was conducted using the Bioconductor annotation package hgu133plus2.db. These steps were performed using the R package “affy”.Citation9 The mean expression was calculated as the final expression of genes measured by multiple probes. Differential expression analysis of the microarray was conducted by the R package “limma” and “EdgeR”.Citation10,Citation11 The batch effects between different datasets were adjusted by R package “limma”. The threshold of different expression genes (DEGs) were defined as fold change (FC) over 2 with adjusted P-value <0.05. The R packages of “pHeatmap” was used for data visualization.Citation12
Gene Ontology (GO) biological process analysis and string network
The clusterProfiler package was used to perform the GO functional enrichment analysis among the DEGs.Citation13 The significance of each GO term was defined by the P<0.05. The top 10 GO terms with the least P-value were listed. The active interaction sources contained experiments, databases and co-expression. The minimum interaction scores were defined as 0.4. The cytoscape software (http://www.cytoscape.org/) was used to visualize the co-expression network.Citation14
WGCNA analysis
The R package “WGCNA” was used to cluster the gene co-expression network.Citation15 In case of outlier effects, preprocessing step was performed before the WGCNA analysis. Based on the expression matrix, the clustering analysis was performed to identify abnormal samples, which might bring bias to subsequent analysis. A soft thresholding power of 7 with a scale-free model fitting index R2>0.9 was applied to maximize scale-free topology, maintaining a high mean number of connections and eliminating small correlations. In WGCNA, a neighborhood proximity measurement was defined as topological overlap matrix (TOM), which quantified the degree of shared network neighbors. One-step network was constructed with the following parameters: maxBlockSize=10,000, minModuleSize=30, deepSplit=4. Then, a hierarchical clustering dendrogram was plotted with identified modules. Modules were defined as clusters of interconnected genes. The module eigengene (ME) was defined as the first principal component of a given module, which was considered a representative of the gene expression profiling. MEs were calculated to evaluate the correlation between the modules and the clinical traits (non-smoking status). Associations can then be determined on the basis of MEs. Sum of correlation coefficients with other nodes in a “signed” TOM defined the connectivity of one node. Hub genes were loosely identified as those with high network connectivity. Unweighted node connectivity information was used to identify hub genes within the 2 modules. The top strongest connections within the significant modules were identified to show the distribution of hub genes. We defined the significant hub genes as the top 25 genes ranked by gene significance (GS) in each module.
Statistical analysis
The prognostic signature was estimated in the training cohort by using penalized lasso Cox proportional hazards regression (R package “Glmnet”). The optimal lambda value was defined by 10-fold cross-validation. The number of candidate genes and corresponding coefficients were calculated by the optimal lambda value. The predictive ability was evaluated by the time-dependent receiver operating characteristic (ROC) curve (R package “survivalROC”). This signature was carried over the testing datasets to validate the predictive ability. Coefficients were not re-estimated in testing dataset.
Results
Selecting DEGs in discovering datasets
Comprehensive search was conducted in GEO for RNA sequencing data and microarray expression profiles with LAC tissue samples. Datasets without non-smoking clinical records were excluded. To avoid bias, we excluded datasets with small sample sizes. The final accession numbers of datasets were GSE10072,Citation16 GSE31210,Citation17 GSE40419,Citation18 GSE68465,Citation19 and GSE50081.Citation20 One of them was RNA sequencing data and the others were microarray profiles. In addition, 214 LAC patients from TCGA met the inclusion criteria and were included. The baseline information of these datasets are listed in . We assigned GSE10072, GSE31210, GSE40419, and GSE68465 datasets into the discovering group. The patients from TCGA were treated as training group to build prognostic signature. GSE50081 and GSE31210 were identified as 2 external testing groups for validation (Figure S1). Different expression analysis of these datasets in discovery group revealed that 180 genes were down-regulated and 318 genes were up-regulated in GSE10072, 348 genes were down-regulated and 248 genes were up-regulated in GSE31210, 1,620 genes were down-regulated and 1,238 genes were up-regulated in GSE40419, and 660 genes were down-regulated and 803 genes were up-regulated in GSE68465 (FC>2, P<0.05). Different expression genes plotted are shown in Figure S2.
Constructing gene co-expression networks
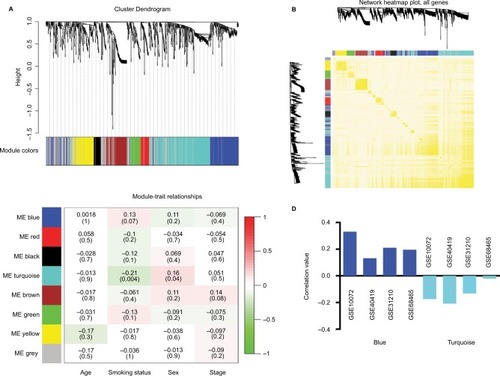
To construct gene co-expression modules, DEGs of each dataset were submitted to WGCNA. DEGs were assigned to different co-expression networks by cluster dendrogram trees (). Unassigned genes were categorized into gray module. Different numbers of the co-expression modules were obtained from the different datasets, ranging from 4 to 10. The relationships between the clinical records with the co-expression networks are presented in . We found that the blue and turquoise modules were 2 significant networks related to non-smoking status across 4 datasets (). In addition, 2 networks showed an opposite correlation with non-smoking status (). TOM was visualized by heat map, which could depict adjacencies or topological overlaps. The topological overlap of two nodes reflected their similarity in terms of commonality of the nodes they connected to ().
Table 1 P-values of module-trait relationships of two nonsmoking related modules across 4 training datasets
Figure 1 Weighted gene co-expression network analysis identified co-expression gene modules of LAC.
Notes: (A) Clustering dendrogram of different expression genes. Hierarchical cluster analysis dendrogram used to detect co-expression clusters. Each color is assigned to 1 module (gray represented unassigned genes). (B) Network heatmap plot. Genes were sorted in the rows and columns by the clustering tree. Light colors denoted low adjacency and darker colors denoted higher adjacency. (C) Correlation values of different module-trait relationships with different clinical records. (D) Correlation values of module-trait relationships of non-smoking related modules across 4 training datasets.
Abbreviation: ME, module eigengene.
Gene Ontology (GO) analysis of significant modules
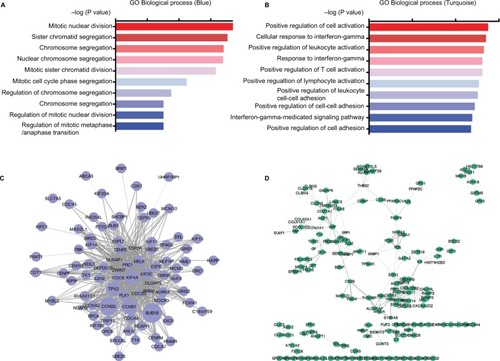
GO enrichment analysis was conducted to identify the potential mechanisms of the significant modules. Based on the GO biological process, we observed that different expression genes of the blue module were mainly enriched in the nuclear division and cell cycle pathways (). For the turquoise modules, genes were engaged in the lymphocyte activation and cell adhesion pathways (). There were 131 genes in the blue modules from 4 datasets. In addition, a total of 352 genes were assigned in the turquoise modules across 4 datasets. String analysis plotted the inter-connection of different expression genes in 2 modules by the co-expression networks (). It could be seen that BUB1B, CCNB2, and TPX2 exhibited high connectivity with neighboring genes in the blue module. VWF, END1, and THBS2 were highly connecting hub nodes in the turquoise network. The size of nodes represented the degree of the correlation with the non-smoking status. The width of the lines was based on the co-expression value of 2 nodes. The hub genes were selected from the top 25 genes of each dataset based on the GS. Several genes were overlapped in the 4 datasets ().
Table 2 The top 25 hub genes of the blue and turquoise modules in 4 training datasets
Figure 2 GO analysis and co-expression network of non-smoking related modules.
Notes: GO enrichment analysis of the blue and turquoise modules (A and B); visual representation of co-expression networks in the blue and turquoise modules. The width of the lines represented co-expression correlation value (C and D); different sizes of nodes indicated different Module Membership values.
Abbreviation: GO, Gene Ontology.
Building prognostic signature
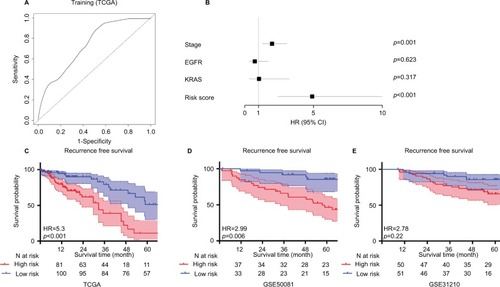
After combining the genes from 2 networks related to the non-smoking status, 234 overlapped genes were identified, including 58 genes selected simultaneously from 4 datasets. We clustered the expression of 17 candidate genes in the training cohort (). To build an efficient prognostic model, the penalized Cox regression model was used to narrow down the candidate genes and calculate the coefficients (). Finally, the prognostic signature was built by 17 genes at the optimal λ value (Risk score=0.016* ADAM1 2+0.001*ASPN+0.068*COL1A2–0.016*DNALI1−0.09*FC GBP+0.007*FNDC1+0.03 *FOSL1+ 0.069 *FSCN1−0.107 *GDF15–0.041 *HLF+0.088*IGF2BP3+0.002*LRCH2 + 0.027*S100A8+0.087*SCD−0.027*SFTPB +0.043 *ST6GA LNAC5−0.014*UNC5CL). The performance of the signature was tested by time-dependent ROC curve. The area under the curve (AUC) of the training dataset was 0.736 (). X-tile was used to find out the optimal cut-off value of risk score for the training dataset. Patients with a risk score more than 0.204 were assigned to the high-risk subgroup and the rest of the patients were included into low-risk subgroup (). Log-ranked survival analysis showed that the high-risk subgroup had a poorer prognosis than the low-risk subgroup (hazard ratio [HR]=3.696, 95% CI: 2.025–6.748, P<0.001). Multi-variable Cox analysis revealed that the risk score was an independent risk factor for survival of nonsmoking LAC ().
Figure 3 Cluster analysis of 17 candidate genes selected by penalized Cox regression in the training group (A). Penalized Cox regression analysis to select survival-associated genes in the training group. (B) The optimal λ value is 14.
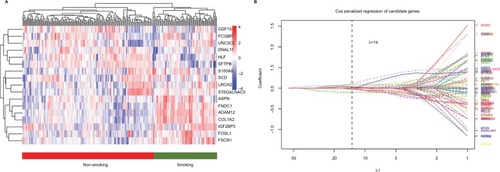
Figure 4 ROC curves for 17 genes to predict the survival of non-smoking LAC (A). Multi-variable Cox analysis indicated that risk score was an independent prognostic risk factor by adjusting other variables (B). The performance of the prognostic signature in stratifying the high-risk and low-risk groups. (C) training cohort (TCGA), (D) external testing cohort 1 (GSE50081), (E) external testing cohort 2 (GSE50081).
Abbreviations: EGFR, epidermal growth factor receptor; HR, hazard ratio; KRAS, Kirsten ras; LAC, lung adenocarcinoma; TGCA, The Cancer Genome Atlas.
Testing the prognostic signature
GSE50081 and GSE31210 were adopted to test performance of the prognostic signature to avoid over-fitting. Eighty cases were selected from GSE50081 dataset and 105 patients were included from GSE31210 with non-smoking LAC and survival records. ROC curve showed a good predictive ability of GSE50081 and a moderate predictive ability of GSE31210 (GSE50081: AUC =0.818, GSE31210: AUC =0.662). The prognostic signature could discriminate the high-risk subgroup from the low-risk subgroup in 2 testing datasets by survival analysis (GSE50081:HR =2.9, 95% CI: 1.322–6.789, P=0.006; GSE31210: HR =2.78, 95% CI: 1.658–6.654, P=0.022) ().
Discussion
The rapid increase in the number of non-smoking LAC makes it a novel hotspot of lung cancer prevention.Citation21 Current evidence indicates that non-smoking LAC carries more characterized driver genes and somatic mutations, which results in clinical disparities between the non-smoking LAC and the smoking LAC.Citation22,Citation23 In addition, the differences of the demographics and survival between the non-smoking group and the smoking group suggest that non-smoking LAC should be recognized as a separate group.Citation1,Citation2,Citation24 To explore reliable biomarkers of the non-smoking LAC, we identified 2 co-expression networks by the WGCNA and built a prognostic signature to predict the survival.
WGCNA is a promising approach to identify hub genes related to clinical features and mine significant gene co-expression networks. Zhang et al revealed a unique 22 carbon-metabolism gene expression signature in hepatocellular carcinoma (HCC), which might provide new therapeutic targets for HCC treatment.Citation25 Another study built a prognostic signature to predict the survival of gastric cancer by WGCNA.Citation26 In the discovery phase, we identified 2 significant co-expression networks related to the non-smoking status by the WGCNA across 4 datasets. The blue module positively correlated with the non-smoking status with the highest P-value. GO annotation analysis revealed that genes in the blue module were mainly enriched in the nuclear division and cell cycle pathways, indicating that aberrant nuclear division and dysregulated cell cycle might play critical roles in progression of non-smoking LAC. Wu et al’s study found that a differentially regulated gene module was enriched for cell cycle related genes, which played a role in the molecular differences between the smoking and the non-smoking LAC.Citation27 Zhang et al reported that MID1-PP2A complex plays an important role in cell cycle arrest among non-smoking LAC patients.Citation28 In addition, Chen et al found that AhR modulated NFkB activity and up-regulated the interleukin-6 expression, which promoted lung carcinogenesis in non-smokers.Citation29 Our results were consistent with theirs. Another significant module that correlated with the non-smoking status was defined as turquoise. Compared with the blue module, the turquoise module negatively correlated with the non-smoking status. GO biological pathways demonstrated that genes of the turquoise module were enriched in the lymphocyte activation and cell adhesion pathways. These results were consistent with the previous studies.Citation30 Peng et al’s study indicated that several genes affect the prognosis of LAC patients through regulating cell cycle and cell adhesion.Citation31 Another study found that different active T cells promoted the progression of non-smoking LAC by creating an immunosuppressive microenvironment,Citation32 which supported our findings.
Due to heterogeneity of expression profiles, hub genes of different datasets were not absolutely accordant. However, several significant hub genes were shared by 4 different datasets, and some of them were reported by published studies. Based on previous studies, DLGAP5 was identified as a promising diagnostic and prognostic biomarker in lung cancer.Citation33 In addition, integrated genome-scale co-expression network revealed that DLGAP5 played a crucial role in cell cycle progression of LAC, which was consistent with our analysis.Citation34 And our analysis further pointed out that high expression of DLGAP5 showed poor survival for the nonsmoking LAC. In addition, TPX2 was defined as a prognostic biomarker for lung cancer and engaged in cell division and cell cycle pathways according to published studies.Citation35 Our analysis further reinforced the important roles of TPX2 in the non-smoking LAC. Published studies indicated that epigenetic deregulation of TCF21 inhibited malignant behavior of lung cancer.Citation36 Existing evidence demonstrated that LDB2 engaged in the epithelial–mesenchymal transition (EMT) and the cell adhesion pathways.Citation37 Our analysis highlighted LDB2 as a prognostic biomarker and potential therapeutic target for non-smoking LAC. However, several novel targets, like COL1A2 and CDH5, have not been well reported by previous studies. Further studies are needed to identify the mechanisms of these genes.
The prognostic signature was defined by combining several transcriptome profiles from non-smoking samples in GEO datasets and TCGA. The multiple datasets and analysis method avoided the biases from batch effect and platform.Citation38 The Cox penalized regression model was used to identify prognostic genes and corresponding coefficients. The predictive ability of prognostic signature was moderate in the training dataset, but it was good in 1 testing dataset, indicating excellent generalization of the prognostic signature. Survival analysis showed that significant distinction between the high-risk and low-risk groups in 2 testing datasets, which implied that the signature was a feasible tool to stratify high-risk non-smoking LAC patients.
Increasing studies have proposed the prognostic signatures for survival prediction of LAC. The first RNA-seqprognostic signature for LAC was proposed by Shukla et al, which provided a powerful prognostic tool for precision oncology.Citation39 In addition, the prognostic predictor based on alternative splicing events uncovered prognostic effect of the splicing networks in LAC.Citation40 A recent study reported that a P53-deficiency gene signature could predict recurrence risk of patients with early-stage LAC.Citation41 However, few predicted the survival of non-smoking LAC patients. This was the first study to develop a prognostic signature based on 17 non-smoking related genes for survival of non-smoking LAC. The prognostic signature was tested in 2 independent datasets from different demographics to guarantee the generalization. In addition, our signature could stratify patients into the high-risk group and the low-risk group with different survival outcomes. Compared with previous biomarkers, our model first leveraged the molecular biomarkers from co-expression networks by the WGCNA to accurately estimate the survival of the non-smoking LAC, which might aid to guide the therapeutic management.
The current study had several limitations. First, we did not test the expression of hub genes and performance of prognostic signature by our own samples. Second, we only used expression profiles in our signature. However, combining meta-omics biomarkers into signature would further improve the predictive ability.Citation42 Furthermore, the role of hub genes should be explored by further experimental procedures, which might reinforce the significance and robustness of this analysis.
In this study, we highlighted 2 gene modules related to non-smoking LAC and built a prognostic signature, which provide the novel compendium of biomarkers and guide the therapy in the non-smoking LAC.
Acknowledgments
This research was supported by the National Natural Science Foundation of China (Nos. 81472702, 81501977 and 81672294), Natural Science Foundation of Jiangsu Province (No. SBK016030028), and the Innovation Capability Development Project of Jiangsu Province (No. BM2015004). Thanks to Jing Han from Department of Epidemiology and Biostatistics, School of Public Health, Nanjing Medical University for helping with statistical analysis. The abstract of this paper was presented at the European Lung Cancer Congress as a poster presentation with interim findings. The poster’s abstract was published in “Poster Abstracts” in the Journal of Thoracic Oncology.
Supplementary material
Figure S1 The flow chat of the study.
Abbreviation: WGCNA, Weighted correlation network analysis.

Figure S2 The expression profile in lung adenocarcinoma tissues and normal tissues. (A–D) Heatmap of the different expression genes in GSE10072, GSE31210, GSE40419 and GSE68465 datasets.
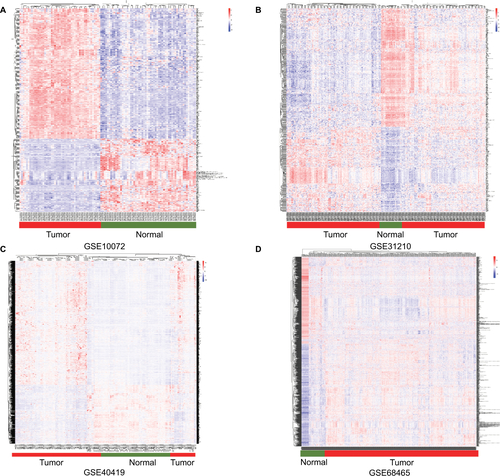
Table S1 Information of training and validation GEO datasets
Disclosure
The authors report no conflicts of interest in this work.
References
- StilesBMRahoumaMHusseinMKNever smokers with resected lung cancer: different demographics, similar survivalEur J Cardiothorac Surg201853484284829182735
- ChoJChoiSMLeeJProportion and clinical features of never-smokers with non-small cell lung cancerChin J Cancer20173612028179026
- ThuKLVucicEAChariRLung adenocarcinoma of never smokers and smokers harbor differential regions of genetic alteration and exhibit different levels of genomic instabilityPLoS One201273e3300322412972
- SongMABenowitzNLBermanMCigarette Filter Ventilation and its Relationship to Increasing Rates of Lung AdenocarcinomaJ Natl Cancer Inst201710912
- DongYLiYJinBPathologic subtype-defined prognosis is dependent on both tumor stage and status of oncogenic driver mutations in lung adenocarcinomaOncotarget2017847822448225529137260
- ClarkeCMaddenSFDoolanPCorrelating transcriptional networks to breast cancer survival: a large-scale coexpression analysisCarcinogenesis201334102300230823740839
- SunQZhaoHZhangCGene co-expression network reveals shared modules predictive of stage and grade in serous ovarian cancersOncotarget2017826429834299628562334
- LiuRZhangWLiuZQZhouHHAssociating transcriptional modules with colon cancer survival through weighted gene co-expression network analysisBMC Genomics201718136128486948
- GautierLCopeLBolstadBMIrizarryRAFauCLFauBBIrizarryRAaffy–analysis of Affymetrix GeneChip data at the probe levelBioinformatics200420330731514960456
- RitchieMEPhipsonBWuDlimma powers differential expression analyses for RNA-sequencing and microarray studiesNucleic Acids Res2015437e47e4725605792
- RobinsonMDMccarthyDJSmythGKedgeR: a Bioconductor package for differential expression analysis of digital gene expression dataBioinformatics201026113914019910308
- WickhamHggplot2: Elegant Graphics for Data AnalysisSpringerVerlagNew York2009
- YuGWangLGHanYHeQYclusterProfiler: an R package for comparing biological themes among gene clustersOMICS201216528428722455463
- ShannonPMarkielAOzierOCytoscape: a software environment for integrated models of biomolecular interaction networksGenome Res200313112498250414597658
- LangfelderPHorvathSWGCNA: an R package for weighted correlation network analysisBMC Bioinformatics20089155919114008
- LandiMTDrachevaTRotunnoMGene expression signature of cigarette smoking and its role in lung adenocarcinoma development and survivalPLoS One200832e165118297132
- YamauchiMYamaguchiRNakataAEpidermal growth factor receptor tyrosine kinase defines critical prognostic genes of stage I lung adenocarcinomaPLoS One201279e4392323028479
- SeoJSJuYSLeeWCThe transcriptional landscape and mutational profile of lung adenocarcinomaGenome Res201222112109211922975805
- SheddenKTaylorJMGEnkemannSAGene Expression-Based Survival Prediction in Lung Adenocarcinoma: A Multi-Site, Blinded Validation Study: Director’s Challenge Consortium for the Molecular Classification of Lung AdenocarcinomaNat Med200814882282718641660
- derSDSykesJPintilieMValidation of a histology-independent prognostic gene signature for early-stage, non-small-cell lung cancer including stage IA patientsJ Thorac Oncol201491596424305008
- LuTPTsaiMHLeeJMIdentification of a novel biomarker, SEMA5A, for non-small cell lung carcinoma in nonsmoking womenCancer Epidemiol Biomarkers Prev201019102590259720802022
- SunSSchillerJHGazdarAFLung cancer in never smokers--a different diseaseNat Rev Cancer200771077879017882278
- GouL-YNiuF-YY-LWZhongW-ZDifferences in driver genes between smoking-related and non–smoking-related lung cancer in the Chinese populationCancer2015121S173069307926331813
- YanoTMiuraNTakenakaTNever-smoking nonsmall cell lung cancer as a separate entityCancer200811351012101818618510
- ZhangJBaddooMHanCGene network analysis reveals a novel 22-gene signature of carbon metabolism in hepatocellular carcinomaOncotarget2016731492324924527363021
- ZhaoXCaiHWangXMaLDiscovery of signature genes in gastric cancer associated with prognosisNeoplasma201663223924526774142
- WuCZhuJZhangXNetwork-based differential gene expression analysis suggests cell cycle related genes regulated by E2F1 underlie the molecular difference between smoker and non-smoker lung adenocarcinomaBMC Bioinformatics201314136524341432
- ZhangLLiJLvXGuoTLiWZhangJMID1-PP2A complex functions as new insights in human lung adenocarcinomaJ Cancer Res Clin Oncol2018144585586429450633
- ChenPHChangHChangJTLinPAryl hydrocarbon receptor in association with RelA modulates IL-6 expression in non-smoking lung cancerOncogene201131255521996739
- Zhou MyWCuiHWangNIdentification of potential therapeutic target genes and mechanisms in non-small-cell lung carcinoma in non-smoking women based on bioinformatics analysisEur Rev Med Pharmacol Sci201519183375338426439031
- PengFWangRZhangYDifferential expression analysis at the individual level reveals a lncRNA prognostic signature for lung adenocarcinomaMol Cancer20171619828587642
- KinoshitaTKudo-SaitoCMuramatsuRDetermination of poor prognostic immune features of tumour microenvironment in non-smoking patients with lung adenocarcinomaEur J Cancer201786152728950145
- ShiYXYinJYShenYZhangWZhouHHLiuZQGenome-scale analysis identifies NEK2, DLGAP5 and ECT2 as promising diagnostic and prognostic biomarkers in human lung cancerSci Rep201771807228808310
- BidkhoriGNarimaniZHosseini AshtianiSMoeiniANowzari-DaliniAMasoudi-NejadAReconstruction of an Integrated Genome-Scale Co-Expression Network Reveals Key Modules Involved in Lung AdenocarcinomaPLoS ONE201387e6755223874428
- OrthMUngerKSchoetzUBelkaCLauberKTaxane-mediated radiosensitization derives from chromosomal missegregation on tripolar mitotic spindles orchestrated by AURKA and TPX2Oncogene2018371526228869599
- RichardsKLZhangBSunMMethylation of the Candidate Biomarker TCF21 Is Very Frequent Across A Spectrum of Early Stage Non-Small Cell Lung CancersCancer2011117360661720945327
- ChenHNYuanKXieNPDLIM1 Stabilizes the E-Cadherin/β-Catenin Complex to Prevent Epithelial-Mesenchymal Transition and Metastatic Potential of Colorectal Cancer CellsCancer Res20167651122113426701804
- ChuSHHuangYTIntegrated genomic analysis of biological gene sets with applications in lung cancer prognosisBMC Bioinformatics201718133628697753
- ShuklaSEvansJRMalikRDevelopment of a RNA-Seq Based Prognostic Signature in Lung AdenocarcinomaJ Natl Cancer Inst20171091djw200
- LiYSunNLuZPrognostic alternative mRNA splicing signature in non-small cell lung cancerCancer Letters2017393Supplement C405128223168
- ZhaoYVarnFSCaiGXiaoFAmosCIChengCA P53-Deficiency Gene Signature Predicts Recurrence Risk of Patients with Early- Stage Lung AdenocarcinomaCancer Epidemiol Biomarkers Prev2018271869529141854
- ChaudharyKPoirionOBLuLGarmireLXDeep Learning-Based Multi-Omics Integration Robustly Predicts Survival in Liver CancerClin Cancer Res20182461248125928982688