
Abstract
Background
Early death (ED) rate in acute promyelocytic leukemia (APL) remains high. Some studies have identified prognostic factors capable of predicting ED, whereas no risk rating system for ED has been reported in the literature. In this study, a risk classification system was built to identify subgroup at high risk of ED among patients with APL.
Methods
Totally, 364 consecutive APL patients who received arsenic trioxide as induction therapy were included. Ten baseline clinical characteristics were selected for analysis, and they were de novo/relapse, age, sex, white blood cell count, platelet count, serum fibrinogen, creatinine, uric acid, aspartate aminotransferase, and albumin. Using a training cohort (N=275), a multivariable logistic regression model was constructed, which was internally validated by the bootstrap method and externally validated using an independent cohort (N=89). Based on the model, a risk classification system was designed. Then, all patients were regrouped into de novo (N=285) and relapse (N=79) cohorts and the model and risk classification system were applied to both cohorts.
Results
The constructed model included 8 variables without platelet count and sex. The model had excellent discriminatory ability (optimism-corrected area under the receiver operator characteristic curve=0.816±0.028 in the training cohort and area under the receiver operator characteristic curve=0.798 in the independent cohort) and fit well for both the training and independent data sets (Hosmer–Lemeshow test, P=0.718 and 0.25, respectively). The optimism-corrected calibration slope was 0.817±0.12. The risk classification system could identify a subgroup comprising ~25% of patients at high risk of ED in both the training and independent cohorts (OR=0.140, P<0.001 and OR=0.224, P=0.027, respectively). The risk classification system could effectively identify patient subgroups at high risk of ED in not only de novo but also relapse cohorts (OR=0.233, P<0.001 and OR=0.105, P=0.001, respectively).
Conclusion
All the results highlight the high practical value of the risk classification system.
Introduction
Following the introduction of treatment with all-trans retinoic acid and arsenic trioxide (ATO), the prognosis of patients with acute promyelocytic leukemia (APL) improved dramatically. However, treatment advances have not improved the early death (ED) rate, which remains high, up to 17.3%–32%.Citation1–Citation6 Some studies have identified prognostic factors capable of predicting this heterogeneity in early survival,Citation1,Citation7–Citation11 and the prognostic factors included old age, male, high white blood cell (WBC) count, low platelet (PLT) count, low serum fibrinogen (FIB) level, high creatinine (Cr) level, and so on.
Krug et alCitation12 derived a risk score from regression coefficients of multivariable logistic regression model, which could be used to predict the probability of complete remission and the risk of ED in older patients (aged ≥60 years) with acute myeloid leukemia, but otherwise medically healthy, for whom intensive induction chemotherapy is planned. Walter et alCitation13 built a risk rating system based on logistic regression analysis, which was used to predict risk of treatment-related mortality (death within 28 days of treatment initiation) after intensive chemotherapy for acute myeloid leukemia other than APL. However, no model or risk rating system for predicting the risk of ED/induction death in patients with APL has been reported in the literature. In this retrospective cohort study, a risk classification system was built to identify subgroup at high risk of ED among patients with APL treated with ATO alone.
Methods
Study design and patient samples
The study used data from a training cohort to construct a multivariable logistic regression model and then tested its performance using the training cohort (internal validation) and an independent cohort (external validation). Based on the constructed model, a risk classification system was designed. Then, all patients included in the 2 cohorts were reclassified into de novo cohort and relapse cohort. The performance of the model and the risk classification system was also tested in the de novo and relapse cohorts.
Between December 2008 and March 2016, 436 consecutive patients with de novo or hematologically relapsed APL were treated at the First (418 cases) or Fourth (18 cases) Affiliated Hospitals of Harbin Medical University. For 364 patients, the diagnosis was confirmed by the presence of t(15;17) and/or the PML/RARa fusion gene, and ATO was administered alone for remission induction. These patients were included in this study. The first 75% (275 cases) of the patients in the series, from December 2008 to September 2014, were assigned to the training set and the last 25% (the remaining 89 cases) to the validation set.
With regard to the ATO therapy, the total daily dose (0.16 mg/kg/d for a maximum of 10 mg/d) was infused intravenously until achieving hematologically complete remission (HCR) or up to a maximum of 60 doses. For the management of coagulopathy, PLT concentrates were transfused to maintain PLT counts >30×109/L. When there were indications of coagulopathy or clinical indications of active bleeding, fresh-frozen plasma was infused repeatedly, with a target FIB blood value of 1.5 g/L. If FIB remained <1 g/L after multiple infusions of fresh-frozen plasma, then cryoprecipitate or/and FIB was administered to increase FIB level.
The study protocol was reviewed and approved by the Medical Ethics Committee of the First Affiliated Hospital of Harbin Medical University who waived the need for patient consent given that this is a retrospective analysis and patient anonymity was assured.
Definitions
ED was defined as death from any cause either before treatment is initiated or within the first 30 days of induction treatment. In this study, there were 10 patients who died within 12 hours of hospital admission without receiving ATO treatment.
Potential predictors of ED
To aid the rapid identification of patients at high risk of ED within the first few hours of hospital admission, all candidate variables must be readily available and promptly assessed by clinicians. Based on the information provided by previous reportsCitation1,Citation2,Citation7,Citation9,Citation14–Citation16 and clinical experts, 10 baseline clinical variables, ie, de novo/relapse, age, sex, WBC count, PLT count, serum FIB, Cr, uric acid (UA), aspartate aminotransferase (AST), and albumin (Alb), were chosen for the analysis ().
Table 1 Main demographic and clinical characteristics of different patient cohorts
Statistical analysis
Missing values in a variable were imputed with the median of the variable. Less than 4% of the values were missing. To design a convenient prognostic score, continuous variables were dichotomized by receiver operator characteristic (ROC) curve analysis that set the cutoff to optimize the area under the ROC curve (AUC), which could quantify the discriminatory ability of each variable for ED.
For the univariate analysis, the categorical variables were compared between the training and validation cohorts or the de novo and relapse cohorts using Pearson’s χ2 test or Fisher’s exact test, as appropriate. Univariate logistic regression was used to examine the association between each variable and ED in the training cohort or between the constructed risk classification system and ED in each cohort.
In the multivariate analysis, multiple logistic regression was used to explore risk factors associated with ED, and a backward stepwise variable selection based on the Akaike information criterion was used to determine the best-fitting stepwise-selected model.Citation17 The AUC was used to quantify the discriminatory ability of the regression model. The goodness-of-fit of the model was assessed using the Hosmer–Lemeshow test and the calibration slope.Citation18 When a model was fit to data in the training set, the bootstrap method, based on 1,000 bootstrap samples, was used to estimate the optimism-corrected AUC and calibration slope.
Risk scores derived from the predictive model were calculated for each individual in the training cohort. By setting the risk score cutoffs at the lower and upper quartiles, the patients were stratified into low-, intermediate- and high-risk groups (corresponding to the lower-, inter-, and upper-quartile range). Both the predictive model and the risk classification system were tested in an independent validation cohort.
All statistical analyses were performed using SPSS (version 19.0, IBM Corporation, Armonk, NY, USA) and the R environment (version 3.1.3, http://www.r-project.org) with P<0.05 considered statistically significant.
Results
Patient characteristics
Of the 364 patients, 284 (78.0%) achieved HCR, and the median duration required to achieve HCR was 44 days (range, 22–71 days). The characteristics of our study cohorts are summarized in . No significant differences were observed in the demographic and clinical characteristics between the training and validation cohorts (all P>0.05). The causes of ED are presented in . In the training cohort, 58 EDs (21.1%; 95% CI, 16.4%–26.4%) occurred, which were caused by hemorrhage, differentiation syndrome, and infection among other causes. In the validation cohort, only 12 EDs (13.5%; 95% CI, 7.2%–22.4%) occurred, which were caused by hemorrhage and infection. The ED rate of validation cohort was somewhat lower than that of the training cohort (P=0.113). Two factors may contribute to the result. First, the patients in the validation cohort were admitted for treatment more recently than those in the training cohort; thus, the monitoring techniques and the symptomatic and supportive measures were better. Second, all 10 patients who died within 12 hours of hospital admission without receiving ATO treatment were included in the training cohort.
Table 2 Causes of ED in this study
Univariate analysis
The ROC curve of the PLT count climbed along the +45° diagonal reference line with an AUC of 0.507 (95% CI, 0.421–0.592; P=0.879) (), indicating that the variable had no ED discriminatory value and no optimal cutoff could be found; thus, the variable was excluded from further analysis. Therefore, 9 variables were included in the subsequent analyses.
Figure 1 Results of the ROC curve analyses for prognostic factors for early death in the training cohort (N=275).
Notes: (A–I) ROC curves for the 10 candidate predictors. (J) Results of the ROC curve analyses for the 10 candidate predictors. Solid circles, the areas under the ROC curves; open circles, P-values. (A–G) 1, original variables; 2, variables that were dichotomized using the ROC curve analysis; 3, variables that were dichotomized based on normal and abnormal bounds. For the continuous variables FIB (D), Alb (F), and PLT (I), the test direction is high risk vs low value, whereas for the other 5 continuous variables (A–C, E, G) the test direction is reversed. For the 2 categorical variables, relapse and male sex were unfavorable categories (H).
Abbreviations: Cr, creatinine; AST, aspartate aminotransferase; WBC, white blood cell count; FIB, fibrinogen; UA, uric acid; Alb, albumin; De/Re, de novo/relapse; PLT, platelet; ROC, receiver operator characteristic; AUC, area under the ROC curve.
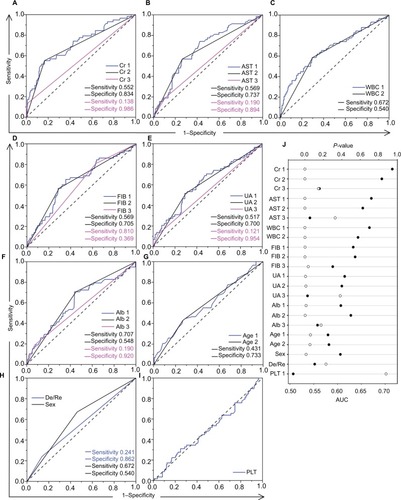
When dichotomizing continuous variables using the ROC curve analysis, we found that setting the cutoff at the threshold between normal and abnormal levels was not appropriate because this practice often caused an obvious reduction in the AUC, indicating a significant decline in the discriminatory power of the variable for ED ().
The results of the univariate analyses are shown in and . Of the 9 variables, all but de novo/relapse classification were significantly associated with ED (P<0.05).
Table 3 Univariate and multivariate analyses of predictive factors for ED in the training cohort (N=275)
Multivariate analysis
Eight of the 9 candidate variables were retained in the multiple logistic regression model. Sex did not appear to have independent prognostic significance and was removed from the multiple logistic regression model. FIB <1 g/L, Cr >75 μmol/L, and Alb <40 g/L maintained their strong prognostic significance for poor survival, and AST ≥26 U/L only just retained poor prognostic significance in multivariate analyses, whereas relapse obtained poor prognostic significance. WBC count >7×10⁹/L, UA level >290 μmol/L, and age >48 years were retained in the multiple logistic regression model with a P-value >0.05 (). Due to the relatively small sample size used for modeling, no interaction terms were added to the main effects model to avoid overfitting. In the internal validation, the apparent and optimism-corrected AUCs were 0.851 and 0.816±0.028, respectively, suggesting excellent discriminatory ability. In the external validation cohort (N=89), the model also showed good discrimination performance (AUC =0.798). The Hosmer–Lemeshow test revealed that the model fit well for both the training (χ2=5.369, df=8, P=0.718) and the external validation data sets (χ2=10.22, df=8, P=0.25). The optimism-corrected calibration slope in the training data set was 0.817±0.12. All these results suggested that the prediction model was well calibrated.
Construction of a risk classification system
A risk score was designed based on the coefficients of the variables contained in the regression model (): risk score=1.149 (relapse)+0.638 (age>48 years)+0.676 (WBC count>7×10⁹/L)+1.476 (FIB<1 g/L)+1.759 (serum Cr level >75 μmol/L)+0.562 (serum UA level>290 μmol/L)+1.099 (Alb <40 g/L)+0.798 (AST≥26 U/L).
Risk scores were calculated for each individual in the training cohort. By setting risk score cutoffs at the lower and upper quartiles, the patients were stratified into 3 prognostic groups: low-, intermediate-, and high-risk groups. The proportion of the patients in the 3 groups was about 1:2:1, and the corresponding predicted probabilities of ED were no more than 5%, 5%–30%, and >30%, respectively ().
Table 4 Classification of ED risk groups within training/validation cohorts and de novo/relapse cohorts based on summed risk scores
The univariate logistic regression analysis revealed that the risk classification system could effectively identify a small proportion of patients with an increased risk of ED at diagnosis in both the training and external validation cohorts. In the training cohort, 70 patients (25.5%; 95% CI, 20.4%–31.0%) comprised the high-risk group, whose ED rate (55.7%) was >3 times the rate observed in the intermediate-risk group (15%; OR=0.140, P<0.001). In the validation cohort, 25 patients (28.1%; 95% CI, 19.1%–38.6%) made up the high-risk group, whose ED rate (32%) was also significantly higher than that of the intermediate-risk group (9.5%; OR=0.224, P=0.027). Notably, because no patients in the low-risk group (0%) died in either the training cohort or the validation cohort, no estimate of the OR can be calculated.
The risk classification system was informative when applied to the de novo and relapse cohorts
There were totally 285 de novo and 79 relapsed patients in the training and external validation cohorts, and 51 de novo (17.9%) and 19 relapsed (24.1%) patients died within the first 30 days of induction treatment (P=0.219). The baseline clinical characteristics of the de novo and relapse cohorts were shown in . There were more male patients in the relapse cohort than in the de novo cohort (P=0.014), and compared with the de novo patients, the relapsed patients had significantly lower WBC counts and higher PLT counts and serum Alb level (all P<0.05).
The developed model exhibited good performance in terms of discrimination (AUCs 0.832 and 0.850, respectively; both P<0.001) and goodness-of-fit (Hosmer–Lemeshow test: χ2=7.74, df=8, P=0.459 and χ2=6.441, df=7, P=0.489, respectively) in both the de novo and relapse cohorts.
The univariate logistic regression analysis revealed that the risk classification system was also informative when applied to the de novo and relapse cohorts (). In the de novo cohort, 67 of the 285 patients (23.5%; 95% CI, 18.7%–28.9%) were identified as high-risk of ED by the risk classification system, and the ED rate in the high-risk group (44.8%) was 3 times the rate observed in the intermediate-risk group (15.9%; OR =0.233, P<0.001). In the relapse cohort, 28 of 79 patients (35.4%; 95% CI, 25.0%–47.0%) were identified as high risk of ED by the risk classification system with an ED rate of 53.6% in the high-risk group, which was >5 times the rate observed in the intermediate-risk group (10.8%; OR=0.105, P=0.001).
Discussion
Consistent with previous studies,Citation1–Citation5,Citation19 this study found a high ED rate in patients with APL, which highlights the need to accurately identify high-risk patients to provide more efficient intervention rapidly and adequately for this special subgroup, thereby improving the prognosis for APL patients. In this study, we derived and validated a risk classification system that may identify a small proportion of patients with an increased risk of ED at diagnosis within a pool of patients treated with ATO alone for remission induction.
Ten simple and widely available clinical variables were chosen for the analyses. Although some studiesCitation1,Citation20 have considered the Eastern Cooperative Oncology Group performance status a powerful predictor of ED/induction death in APL, it was not included in this study due to its subjective nature. In a large series of 732 patients with newly diagnosed APL who received all-trans retinoic acid plus idarubicin as induction therapy by de la Serna et al,Citation7 univariate analysis disclosed no correlation between PLT count and induction death. In our study, the univariate analyses also showed that the PLT count had no discriminatory ability for ED. Surprisingly, Walter et alCitation13 found that PLT count ≥50×109/L was a risk factor for treatment-related mortality, which was defined as death within 28 days after initiation of therapy in patients with acute myeloid leukemia who received chemotherapy as induction therapy. Maybe in acute myeloid leukemia, the PLT functions are abnormal, which results in the irrelevance of low PLT count to ED, or even the relevance of high platelet count to ED. Since no discriminatory ability for ED, the PLT count was removed and finally 9 variables remained for the further analyses.
Using these candidate risk factors, a multivariable logistic regression model was derived and internally validated by bootstrapping analysis and was externally validated in an independent data set, where the model showed good discriminatory ability and goodness-of-fit. A prognostic classification system for ED was then designed based on the model, which could select a small subgroup comprisinĝ25% of patients who were at a significant and clinically relevant greater risk of ED in the training or validation cohort. The prognostic classification system can be easily and expeditiously used by clinicians because only simple and widely available variables that can be evaluated at the time of diagnosis are used to calculate the scores.
Currently, ATO is considered the most effective treatment for relapsed APL,Citation21–Citation26 whereas very limited data are available regarding ED in patients with relapsed APL who received single-agent ATO as induction therapy. To the best of our knowledge, this is the first study that provides useful information on predicting the ED risk in such patients. Despite the differences observed in the initial patient characteristics across the de novo and relapse cohorts, the developed model showed equally good performance, and the classification system effectively identified the subgroup of patients at high risk of ED in both cohorts, highlighting its high practical value.
It is because the de novo/relapse classification were entered into the logistic regression model that the developed model presented good performance in not only the de novo but also the relapse cohorts, and furthermore, the classification system could effectively identify the subgroup of patients at high risk of ED in both cohorts. Because our study cohorts exclusively consisted of patients with de novo or relapse APL undergoing treatment with ATO alone, our results can only be applied to such patients.
Our study has several limitations. First, the study was retrospective, which carries the associated risk of missing data. Fortunately, few data were missing for the selected candidate variables because all such parameters were readily available and commonly tested. Next, ours was a dual-center study that used a small data set. Large-scale prospective studies using multicenter cohorts with various ethnicities and geographic locations are needed to validate the established model and risk classification system. Third, currently, although ATO is considered the most effective treatment for relapsed APL, the standard treatment for de novo APL is all-trans retinoic acid combined with ATO. So, the risk grading system will be of limited application. But our results can offer a reference for choosing candidate variables to build models for predict ED risk in APL patients receiving standard treatment, since both treatments are differentiation-inducing therapy.
For the subgroup of APL patients at higher risk of ED, more effective methods for urgent reversal of coagulopathy should be developed. Appropriate use of anticoagulant and/or antifibrinolytic agents will be a potential treatment option on condition that the occurrence mechanism of coagulopathy is clarified, and accurate identification of patients at high risk of ED lays a foundation for in-depth study of the occurrence mechanism of coagulopathy in the subgroup.
Conclusion
We established the first prediction model and risk classification system for predicting ED in patients with APL who received ATO alone as induction therapy. Our risk classification system will allow the identification of a subgroup of patients at high risk of ED in not only de novo but also relapse cohorts. This patient subgroup may benefit from specifically designed trials aimed to mitigate ED.
Acknowledgments
This work was supported by the National Natural Science Foundation of China (no. 81270589 and 81430088) and the Natural Science Foundation of Heilongjiang Province of China (no. H2017032).
Disclosure
The authors report no conflicts of interest in this work.
References
- LehmannSRavnACarlssonLContinuing high early death rate in acute promyelocytic leukemia: a population-based report from the Swedish Adult Acute Leukemia RegistryLeukemia20112571128113421502956
- McClellanJSKohrtHECoutreSTreatment advances have not improved the early death rate in acute promyelocytic leukemiaHaematologica201297113313621993679
- RashidiAGoudarRKSayedianFAll-trans retinoic acid and early mortality in acute promyelocytic leukemiaLeuk Res201337101391139223906626
- KimDYLeeJHLeeJHSignificance of fibrinogen, D-dimer, and LDH levels in predicting the risk of bleeding in patients with acute promyelocytic leukemiaLeuk Res201135215215820554322
- JácomoRHMeloRASoutoFRClinical features and outcomes of 134 Brazilians with acute promyelocytic leukemia who received ATRA and anthracyclinesHaematologica200792101431143218024380
- ParkJHQiaoBPanageasKSEarly death rate in acute promyelocytic leukemia remains high despite all-trans retinoic acidBlood201111851248125421653939
- de la SernaJMontesinosPVellengaECauses and prognostic factors of remission induction failure in patients with acute promyelocytic leukemia treated with all-trans retinoic acid and idarubicinBlood200811173395340218195095
- HeBHuSQiuGGuWClinical characteristics of acute promyelocytic leukemia manifesting as early deathMol Clin Oncol20131590891024649269
- GhavamzadehAAlimoghaddamKRostamiSPhase II study of single-agent arsenic trioxide for the front-line therapy of acute promyelocytic leukemiaJ Clin Oncol201129202753275721646615
- Di BonaEAvvisatiGCastamanGEarly haemorrhagic morbidity and mortality during remission induction with or without all-trans retinoic acid in acute promyelocytic leukaemiaBr J Haematol2000108468969510792270
- TestaULo-CocoFPrognostic factors in acute promyelocytic leukemia: strategies to define high-risk patientsAnn Hematol201695567368026920716
- KrugURölligCKoschmiederAComplete remission and early death after intensive chemotherapy in patients aged 60 years or older with acute myeloid leukaemia: a web-based application for prediction of outcomesLancet201037697572000200821131036
- WalterRBOthusMBorthakurGPrediction of early death after induction therapy for newly diagnosed acute myeloid leukemia with pretreatment risk scores: a novel paradigm for treatment assignmentJ Clin Oncol201129334417442321969499
- JeddiRGhédiraHBen AmorRTreatment of acute promyelocytic leukemia with AIDA based regimen. Update of a Tunisian Single Center StudyMediterr J Hematol Infect Dis201131e201103322084648
- JeddiRGhédiraHMenifSTreatment of acute promyelocytic leukemia with PETHEMA LPA 99 protocol: a Tunisian single center experienceHematology201015420420920670478
- LouYMaYSuoSPrognostic factors of patients with newly diagnosed acute promyelocytic leukemia treated with arsenic trioxide-based frontline therapyLeuk Res201539993894426183877
- PosadaDBuckleyTRModel selection and model averaging in phylogenetics: advantages of Akaike information criterion and Bayesian approaches over likelihood ratio testsSyst Biol200453579380815545256
- SteyerbergEWVickersAJCookNRAssessing the performance of prediction models: a framework for traditional and novel measuresEpidemiology201021112813820010215
- RashidiARileyMGoldinTADelay in the administration of all-trans retinoic acid and its effects on early mortality in acute promyelocytic leukemia: final results of a multicentric study in the United StatesLeuk Res20143891036104025035073
- MitrovicMSuvajdzicNBogdanovicAInternational Society of Thrombosis and Hemostasis Scoring System for disseminated intra-vascular coagulation ≥6: a new predictor of hemorrhagic early death in acute promyelocytic leukemiaMed Oncol201330147823371042
- ShenZXChenGQNiJHUse of arsenic trioxide (As2O3) in the treatment of acute promyelocytic leukemia (APL): II. Clinical efficacy and pharmacokinetics in relapsed patientsBlood1997899335433609129042
- NiuCYanHYuTStudies on treatment of acute promyelocytic leukemia with arsenic trioxide: remission induction, follow-up, and molecular monitoring in 11 newly diagnosed and 47 relapsed acute promyelocytic leukemia patientsBlood199994103315332410552940
- SoignetSLMaslakPWangZGComplete remission after treatment of acute promyelocytic leukemia with arsenic trioxideN Engl J Med199833919134113489801394
- ThomasXPigneuxARaffouxEHuguetFCaillotDFenauxPSuperiority of an arsenic trioxide-based regimen over a historic control combining all-trans retinoic acid plus intensive chemotherapy in the treatment of relapsed acute promyelocytic leukemiaHaematologica200691799699716757416
- SoignetSLFrankelSRDouerDUnited States multicenter study of arsenic trioxide in relapsed acute promyelocytic leukemiaJ Clin Oncol200119183852386011559723
- FoxERazzoukBIWidemannBCPhase 1 trial and pharmacokinetic study of arsenic trioxide in children and adolescents with refractory or relapsed acute leukemia, including acute promyelocytic leukemia or lymphomaBlood2008111256657317959855