
Abstract
Background
Postoperative management and survival of gastric cancer is mainly determined by pathologic TNM stage. However, gastric cancer is a heterogeneity group, and the survival is quite different even when they are in the same TNM stage. Moreover, TNM stage system does not grasp other important clinicopathologic factors to determine the survival. The aim of the present study is to propose and validate prognostic score based on age, tumor size, and grade.
Materials and methods
Patients diagnosed with gastric cancer in the Surveillance, Epidemiology, and End Results database from 1988 to 2012 were included in the present study. Kaplan–Meier methods were adopted and multivariable Cox regression models were built for the analysis of long-term survival outcomes and risk factors.
Results
A total of 26,091 eligible patients diagnosed with noncardia gastric cancer were included in the study. In the univariate and multivariate survival analysis, age at diagnosis, tumor grade, and tumor size were validated as independent prognostic factors (P<0.05). Then, we proposed a prognostic score calculated from the number of risk factors, with 0, 1, and 2 points each given for favorable, intermediate, and poor prognostic categories of age (≤50, 50–70, and >70), grade (well, moderate, and poor differentiation), and size (≤3, 3–6, ≥7 cm). The prognostic score was verified as independent predictor in both univariate and multivariate survival analyses (P<0.001). In addition, nomograms on cause-specific survival were established according to prognostic factor and all other significant factors, and c-index was 0.715 (95% CI: 0.706–0.725).
Conclusion
Prognostic score based on age, tumor size, and grade is an independent predictor of survival after gastrectomy. The novel prognostic score can improve the accuracy of prediction for current TNM stage system. Patients who are with a high prognostic score should undergo extensive follow-up after surgery.
Introduction
Gastric cancer is one of the deadliest malignancies, ranking as the fourth most common cancer in the worldCitation1 and the second most common cancer in China.Citation2 Surgical resection with extensive lymphadenectomy remains the only curative treatment option for gastric cancer. The postoperative adjunctive therapy and prognosis is mainly decided based on the TNM system, which is comprehensively evaluated based on the depth of tumor invasion and the presence of lymph node metastasis and distant metastasis.Citation3 However, gastric cancer is a heterogeneity group, and the survival is quite different even when they are in the same TNM stage. Moreover, TNM stage system does not grasp other important clinicopathologic factors to determine the survival.
Several studies have demonstrated the clinical significance of some common factors as valuable predictors. Tumor size is significantly correlated with gastric cancer progression, and can be regarded as a reliable prognostic factor after gastrectomy. It can supply TNM stage system to improve the prognostic prediction accuracy for gastric cancer patients.Citation4,Citation5 Moreover, age and tumor grade have been validated as independent prognostic markers in patients with resectable gastric cancer.Citation6–Citation8 However, few reports have investigated tumor depth, tumor grade, and tumor size simultaneously as predictive markers for prognosis in patients with gastric cancer after surgery.
In the present study, we first use the Surveillance, Epidemiology, and End Results (SEER) population-based cohort to investigate the prognostic value of tumor size, tumor grade, and age in gastric cancer and then develop a prognostic score based on these three factors in reference with previously published study to improve accuracy of prognostic prediction in gastric cancer.
Materials and methods
Data collection
The SEER database and SEER-stat software (SEER*Stat 8.3.5) were used to search patients diagnosed with gastric cancer released on March 6, 2018. The inclusion criteria were pathologic diagnosis with gastric adenocarcinoma, mucinous adenocarcinoma, and signet ring cell carcinoma; with no distant metastases; receiving surgical resection; having detailed information about the depth of tumor invasion and lymph node metastases; with known tumor size; with intact follow-up information. The years were limited from 1988 to 2012. Patients diagnosed after 2012 were excluded from the study to guarantee sufficient follow-up time. depicts the flowchart of the selection.
Figure 1 Flowchart of patients’ selection in Surveillance, Epidemiology, and End Results database.
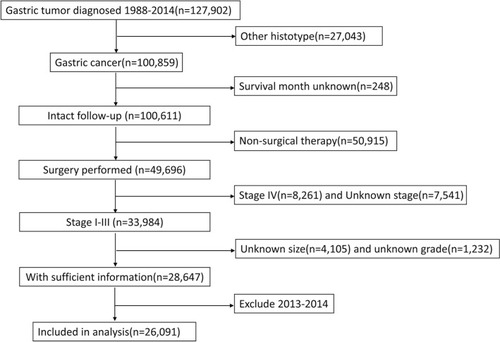
Years of diagnosis, sex, race, marital status, grade, histotype, and surgery performed or not, depth of tumor invasion, lymph node status, survival months, and cause-specific survival (CSS) were extracted from the SEER database. All patients were restaged according to eighth TNM stage.
Ethical approval
According to the Ethical Committee and Institutional Review Board of the Minhang Hospital, Fudan University on Research involving Human Subjects, this type of study does not require approval from an ethics committee in our institute. All procedures were conducted in accordance with the Helsinki Declaration of 1964 and later versions.Citation9 All patients were de-identified.
Statistical analysis
Age and tumor size were first treated as continuous variables, and incorporated into univariate and multivariable Cox regression analyses. After they were validated as independent prognostic factors, they were classified as classification variables. Age was divided into three subgroups by cutoff 50 and 70 years. X-tile programCitation10 was performed to select the most appropriate cutoff points for tumor size to stratify patients at different risk of cancer-related death. Analyses of years of diagnosis were performed for five consecutive periods of 5 years, from 1988–1992 to 2008–2012.
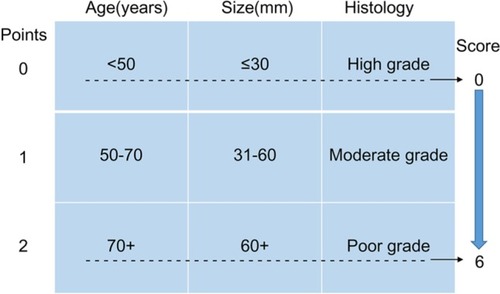
The prognostic score was constructed with three patient and tumor characteristics (age at diagnosis, tumor grade, and tumor size) as previously described,Citation11,Citation12 and detailed information has been demonstrated in . The total score was calculated by summing up the scores of age, grade, and tumor size together.
Figure 2 Patient prognostic score: risk stratification.
Notes: Data from Smith et al.Citation12
The primary endpoint of the study was CSS. The 5-year CSS was calculated by the Kaplan–Meier method. The differences in survival between the groups were compared by the log-rank test. Variables that seemed to be significantly associated with survival on univariate analysis were entered into multivariate analysis, which was performed with Cox proportional hazard model. P-value <0.05 was considered significant. All analyses were conducted using SPSS® version 23 (IBM, Armonk, NY, USA).
Nomograms for possible prognostic factors associated with CSS were established by R software, and the model performance for predicting outcome was evaluated by Harrell’s concordance index (c-index),Citation13,Citation14 which is a measure of discrimination. The maximum value of the c-index is 1.0, indicating a perfect discrimination, whereas 0.5 indicates a random chance to correctly discriminate outcome. In addition to measuring discriminative capacity by c-index, each model was evaluated with calibration curve in which predicted outcomes vs observed outcomes are graphically depicted, which made it possible to conduct further comparison of accuracy in estimating prognosis.
Results
Patients’ characteristics
A total of 26,091 eligible patients diagnosed with noncardia gastric cancer were included in the study, of whom 16,663 were male and 9,428 (36.1%) were female. There were 7,021 (26.9%) patients diagnosed at stage I, 7,094 (27.2%) at stage II, and 11,976 (45.9%) at stage III disease. The percentage of well-differentiated, moderately differentiated, poorly differentiated, and undifferentiated tumor were 5.4%, 30.9%, 61.6%, and 2.1%, respectively. The mean age was 68 years. Median duration of follow-up was 51 months.
Construct prognostic score
The 5-year CSS of the cohort was 53%. In the univariate analysis, years of diagnosis, sex, age at diagnosis, race, tumor grade, histologic type, primary tumor size, TNM stage, and marital status were significant risk factors for survival (). Multivariate analysis with Cox regression was performed and all these factors except histologic type were validated as independent prognostic factors for CSS in gastric cancer after gastrectomy ().
Table 1 Univariate and multivariate survival analyses for evaluating the clinicopathologic characteristics on gastric cancer cause-specific survival in SEER database
Then, we used X-tile program to divide the patients into high, middle, and low risk of cancer-related death with optimal cutoff of 3 and 6 cm in terms of tumor diameters. The 5-year CSS for patients with tumor diameter ≤3, 4–6, and >6 cm were 69.9%, 48.1%, and 39.9%, respectively, and the difference was statistical (χ2=1443.42, P<0.001) (). We also used cutoff 50 and 70 years to divide patients into three subgroups with score 0–2 based on prior cohort studies concerning the prognostic factors of age.Citation15,Citation16 Patients with poorly and undifferentiated tumor were gathered together and were scored 2, and those with well and moderately differentiated were scored 0 and 1, respectively.
Figure 3 X-tile analyses of 5-year cause-specific survival were performed by using patients’ data to determine the optimal cutoff values for tumor size.
Notes: Tumor size was treated as category variable for each 1 cm. The sample of gastric cancer patients was equally divided into training and validation sets. X-tile plots of training sets are shown in the left panels, with plots of matched validation sets shown in the smaller inset. The optimal cutoff values highlighted by the black circles in left panels are shown in histograms of the entire cohort (middle panels), and Kaplan–Meier plots are displayed in right panels. P-values were determined by using the cutoff values defined in training sets and applying them to validation sets. The optimal cutoff values were 3 and 6 cm (P<0.001).

After summing up the score from age, tumor grade, and tumor size, we generate total score. There were 0.2% patients in score 0 subgroup, 2.2% in score 1 subgroup, 10.4% in score 2 subgroup, 23.6% in score 3 subgroup, 31.5% in score 4 subgroup, 23.0% in score 5 subgroup, and 9.1% in score 6 subgroup. For there were only 0.2% patients with score 0, we gathered scores 0 and 1 together to generate new score 1.
Prognostic significance of prognostic score
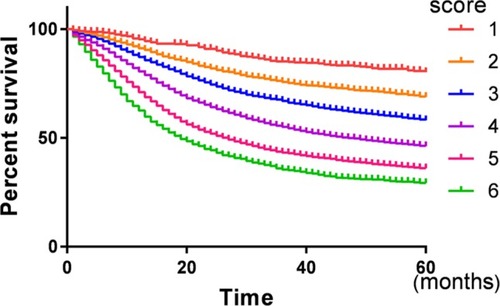
There was a gradual decrease in CSS as prognostic score increased. The 5-year CSS for patients with 1, 2, 3, 4, 5, and 6 score were 82.2%, 71.4%, 62.0%, 51.1%, 41.6%, and 35.5%, respectively, and the difference was statistically significant (P<0.001) (, ). Then, a multivariate Cox regression model was conducted to identify the variables that were independently associated with CSS in gastric cancer and it was found that years of diagnosis, sex, race, TNM stage, marital status, and prognostic score are independent prognostic factors in patients with gastric cancer, and the HRs gradually increased as the score increased (P<0.05) ().
Table 2 Multivariate survival analysis for evaluating the prognostic score on gastric cancer cause-specific survival in SEER database
Figure 4 Survival curve for the different prognostic scores.
Notes: Kaplan–Meier analysis was performed to evaluate the correlation of prognostic score and cause-specific survival. Increased prognostic score was correlated with worse survival (χ2=1509.64, P<0.001).
Development and validation of nomograms for predicting prognosis for gastric cancer
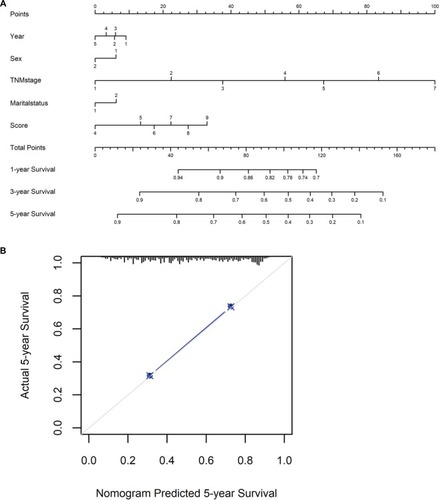
To predict CSS of patients with gastric cancer after gastrectomy, nomograms were established by multivariate Cox regression model according to all significantly independent factors for CSS (). Nomograms can be interpreted by summing up the points assigned to each variable, which is indicated at the top of the scale. The total points can be converted to predict 5-year probability of death and recurrence or metastasis for a patient in the lowest scale.Citation14,Citation17 The Harrell’s c-indexes for CSS were 0.715 (95% CI: 0.706–0.725), which is higher than the TNM stage alone (c-indexes 0.701, 95% CI: 0.692–0.715). Calibration curves for the nomograms () revealed no deviations from the reference line and no need of recalibration.
Figure 5 Nomograms convey the results of prognostic models using clinicopathologic characteristics and prognostic score to predict cause-specific survival of patients with gastric cancer after gastrectomy.
Notes: (A,B) Nomograms can be interpreted by summing up the points assigned to each variable, which is indicated at the top of scale. The total points can be converted to predict 5-year probability of death for a patient in the lowest scale. The Harrell’s c-index for survival prediction was 0.715 (95% CI: 0.706–0.725). Calibration curves for 5-year cause-specific survival using nomograms with clinicopathologic characteristics and prognostic score are shown. The X-axis is nomogram-predicted probability of survival and Y-axis is actual survival. The reference line is 45° and indicates perfect calibration.
Discussion
In our large population-based cohort study, we first assessed the clinical significance of age at diagnosis, tumor size, and grade for predicting prognosis in patients with stage I–III gastric cancer. We then proposed a prognostic score as a new predictor calculated solely from age at diagnosis, tumor size, and grade. Finally, we evaluated the clinical significance of prognostic score as a predictor of survival and developed nomogram-incorporated prognostic score and TNM stage to improve the accuracy of the prediction of survival in patients with stage I–III gastric cancer.
Age plays a significant role in gastric cancers. Age at diagnosis was not only used as an indispensable adjusted element in the observational or interventional studies, but also contained inestimable value for prognosis. A population-based study including 7,762 patients with operable gastric cancer indicated that patients diagnosed at the age of <45 years had the lowest HR of CSS and the risk of death increased with age, being the highest for patients older than 76 yearsCitation16. The worse survival for the elderly might be explained partly by inadequate treatment.Citation18 A bad performance status cannot tolerate the extensive lymphadenectomy and standardized chemotherapy,Citation19 while young patients have a good performance status to quicker return of gastrointestinal function after surgery and to tolerate toxicities of standardized chemotherapy and comprehensive treatment.Citation18,Citation20
Tumor differentiation is a well-known prognostic factor in patients with gastric cancer. Adachi et al reported that the overall 5-year survival rate for patients with well-differentiated tumor was higher than that for patients with poor-differentiated gastric cancer (76% vs 67%), especially for patients with ≥10 cm tumors (42% vs 14%), and multivariate analysis indicated that histologic type was one of the independent prognostic factors.Citation21 The study from Sun et al demonstrated that the clinical response rate in the better differentiated group was significantly higher than that in the poorly differentiated group for patients with locally advanced gastric cancer treated with neoadjuvant chemotherapy.Citation22 Not surprisingly, tumor differentiation was significantly associated with poor prognosis in the present study.
We used tumor size as an additional prognostic factor to construct prognostic score in the present study. Many studies have indicated that greater tumor size is closely related with the depth of tumor invasion and the number of lymph node metastasis.Citation5,Citation23,Citation24 In the present study, we used X-tile program to divide the cohort into three subgroups, and the risk of cancer-related death increased gradually as tumor size increased, which suggested tumor size as a promising marker for predicting survival.
The most noteworthy point of the current study was that we developed a prognostic score derived from age at diagnosis, tumor size, and grade. Total score was calculated from the number of risk factors, with 0, 1, and 2 points each given for favorable, intermediate, and poor prognostic categories of age, grade, and size. Thus, total scores ranged from a minimum of 0 to a maximum of 6, with the best predicted prognosis associated with the lowest scores and the worst predicted prognosis the highest scores.Citation12 The score was verified as an independent prognostic factor in multivariate Cox regression analysis. Importantly, the nomogram-included prognostic score has improved the accuracy of prediction when compared to TNM stage alone.
Limitations
Although we get the results from a large population-based study, our study still has some limitations. First, this was a retrospective study, which may have some inherent limitation. Second, the information regarding the use of neoadjuvant or adjuvant chemotherapy is missing. It is possible that the tumor may become small if patients received neoadjuvant therapy. And patients who received adjuvant chemotherapy may improve survival than those who rejected chemotherapy, resulting in a potential confounder in this study. Third, the quality of surgery is unknown, especially for those who underwent palliative resection, it may cause apparent confound to the current study. But for the patients’ number is very large and the study is more like a real-world study, the above limitations may have limited impact on our results.
Conclusion
In the current large population-based study, we proposed a prognostic score based on age, tumor size, and grade, and validated the score as an independent predictor of survival after gastrectomy. The novel prognostic score can improve the prediction accuracy for the current TNM stage system. Patients who are with a high prognostic score should undergo extensive follow-up after surgery.
Acknowledgments
The authors acknowledge the efforts of the Surveillance, Epidemiology, and End Results (SEER) Program tumor registries in the creation of the SEER database. The interpretation and reporting of these data are the sole responsibility of the authors.
Disclosure
The authors report no conflicts of interest in this work.
References
- TorreLABrayFSiegelRLGlobal cancer statistics, 2012CA Cancer J Clin 2012201565287108
- ChenWZhengRBaadePDCancer statistics in China, 2015CA Cancer J Clin201666211513226808342
- BuyyounouskiMKChoykePLKattanMAminMBAJCC Cancer Staging Manual8th ed.ChicagoSpringer2017715726
- ZuHWangFMaYXueYStage-stratified analysis of prognostic significance of tumor size in patients with gastric cancerPLoS One201381e5450223382906
- ZhaoLYZhangWHChenXZPrognostic significance of tumor size in 2405 patients with gastric cancer: a retrospective cohort studyMedicine20159450e228826683961
- ChiaravalliAMKlersyCVanoliAFerrettiACapellaCSolciaEHistotype-based prognostic classification of gastric cancerWorld J Gastroenterol201218989690422408348
- Schlesinger-RaabAWernerJFriessHHölzelDEngelJAge and outcome in gastrointestinal cancers: a population-based evaluation of oesophageal, gastric and colorectal cancerVisc Med201733424525329034252
- FujiwaraYFukudaSTsujieMEffects of age on survival and morbidity in gastric cancer patients undergoing gastrectomyWorld J Gastrointest Oncol20179625726228656076
- RickhamPPHuman experimentation. Code of Ethics of the World Medical Association. Declaration of HelsinkiBr Med J19642540217714150898
- CampRLDolled-FilhartMRimmDLX-tile: a new bio-informatics tool for biomarker assessment and outcome-based cut-point optimizationClin Cancer Res200410217252725915534099
- SagaraYFreedmanRAVaz-LuisIPatient prognostic score and associations with survival improvement offered by radiotherapy after breast-conserving surgery for ductal carcinoma in situ: a population-based longitudinal cohort studyJ Clin Oncol201634111190119626834064
- SmithGLSmithBDHafftyBGRationalization and regionalization of treatment for ductal carcinoma in situ of the breastInt J Radiation Oncol Biol Phys200665513971403
- AltmanDGVergouweYRoystonPMoonsKGPrognosis and prognostic research: validating a prognostic modelBMJ2009338b60519477892
- LiYJiaHYuWNomograms for predicting prognostic value of inflammatory biomarkers in colorectal cancer patients after radical resectionInt J Cancer2016139122023126933932
- LiangYXDengJYGuoHHCharacteristics and prognosis of gastric cancer in patients aged ≥ 70 yearsWorld J Gastroenterol201319396568657824151383
- ChenJChenJXuYImpact of age on the prognosis of operable gastric cancer patients: an analysis based on SEER databaseMedicine20169524e394427311007
- IasonosASchragDRajGVPanageasKSHow to build and interpret a nomogram for cancer prognosisJ Clin Oncol20082681364137018323559
- NelenSDVerhoevenRHALemmensVde WiltJHWBosschaKIncreasing survival gap between young and elderly gastric cancer patientsGastric Cancer201720691992828275933
- LimJHLeeDHShinCMClinicopathological features and surgical safety of gastric cancer in elderly patientsJ Korean Med Sci201429121639164525469063
- KubotaTHikiNSanoTPrognostic significance of complications after curative surgery for gastric cancerAnn Surg Oncol201421389189824254205
- AdachiYYasudaKInomataMSatoKShiraishiNKitanoSPathology and prognosis of gastric carcinoma: well versus poorly differentiated typeCancer20008971418142411013353
- SunLBZhaoGJDingDYComparison between better and poorly differentiated locally advanced gastric cancer in preoperative chemotherapy: a retrospective, comparative study at a single tertiary care instituteWorld J Surg Oncol20141228025200958
- RioPDVianiLBertocchiEThe prognostic role of tumor size in patients with gastric cancerAnn Ital Chir20178847848429339593
- DengJZhangRPanYTumor size as a recommendable variable for accuracy of the prognostic prediction of gastric cancer: a retrospective analysis of 1,521 patientsAnn Surg Oncol201522256557225155400