
 ?Mathematical formulae have been encoded as MathML and are displayed in this HTML version using MathJax in order to improve their display. Uncheck the box to turn MathJax off. This feature requires Javascript. Click on a formula to zoom.
Abstract
Purpose
The PI3K/AKT/mTOR pathway is frequently activated in various squamous cell carcinomas (SCCs). Although mTOR inhibitors are suggested as effective treatments in immunosuppressed patients with metastatic SCC, they are still not proven to be favorable in treating skin SCC patients not undergoing immunosuppressive therapy. Moreover, the exact mechanism of the mTOR signaling pathway in SCC has not yet been identified. In this study, we aimed to determine the genes associated with mTOR inhibitors in skin SCC.
Materials and methods
The identification of cell viability according to concentration of everolimus and Western blot was done. To analyze the global gene expression profiles, A431 and HSC-1 cells were treated with dimethyl sulfoxide (DMSO) or 100 nM of everolimus for 72 hours. Furthermore, differentially expressed genes (DEGs) were identified using Affymetrix analysis. To identify the gene network associated with everolimus resistance in SCC cells, pathway analysis was performed using the Ingenuity Pathway Analysis (IPA) tool.
Results
The effects of cell death with respect to the mTOR inhibitor concentration were observed in the HSC-1 cell line; however, the mTOR inhibitor did not show effective cytotoxic activity in the A431 cell line. p-mTOR concentration also diminished with respect to everolimus concentrations in the HSC-1 cell line. Moreover, the microarray results showed that the MYC/CCND1/TP73/NUPR1/SBD/ERBB2/CDKN2B genes were related to mTOR inhibitor resistance. However, CCND1 gene overexpression was most closely related to mTOR inhibitor resistance.
Conclusion
We identified mTOR inhibitor resistance genes, and our findings may help select therapeutic targets in skin SCC.
Introduction
Squamous cell carcinoma (SCC) is the second-most common type of skin cancer after basal cell carcinoma. Some risk factors for cutaneous SCC include sunlight, HPV infection, burn wounds, and immunosuppression.Citation1 Cutaneous SCC is the most common type of malignancy in transplant recipients,Citation2 where the occurrence rate is approximately 65-folds higher than the general population.Citation3 In cutaneous SCC, the risk of metastasis tends to increase several years after diagnosis. SCC of the lip and ears has a high rate of local recurrence and distant metastasis (20%–50%). It mainly spreads to local nerves or the lymph nodes. Several systemic chemotherapy agents, such as cisplatin, fluoropyrimidines, bleomycin, doxorubicin, 13-cis-retinoic acid, and interferon alpha-2a, have been used to treat SCC of the skin. Unfortunately, the efficacy of systemic chemotherapy is unsatisfactory, and prospective large clinical studies are unavailable. Only small studies have shown a response to systemic chemotherapy in patients with metastatic SCC of the skin.Citation4–Citation8 One particular study demonstrated that EGFR inhibitor-combined cytotoxic therapy reduced tumor load in locoregional disease. However, efficacy of this combination therapy has not yet been proven in distant metastatic disease.Citation9,Citation10 Nowadays, immune checkpoint inhibitors are being tested in several clinical trials. Although the US Food and Drug Administration (FDA) recently approved nivolumab and pembrolizumab to treat patients with recurrent or metastatic head and neck squamous cell cancer, no phase III trials in cutaneous SCC have yet been approved.Citation11,Citation12 Interestingly, many clinical trials showed that mTOR inhibitors significantly reduced tumor size in transplant recipients with cutaneous SCC. Therefore, mTOR inhibitors can be considered to be new therapeutic strategies in posttransplant skin cancer.Citation13–Citation15
However, the use of mTOR inhibitors is still not proven to be a favorable mode of treatment for SCC patients not undergoing immunosuppressive therapy, and the exact mechanism of the mTOR signaling pathway in SCC has not yet been identified. In this study, we tried to identify the genes associated with the therapeutic effects of mTOR inhibitors in cutaneous SCC.
Materials and methods
Cell culture
Skin SCC cell lines, A431 and HSC-1, were obtained from the American Type Culture Collection (ATCC) and Japanese Collection of Research Bioresources (JCRB) Cell Bank (Osaka, Japan), respectively. Both cell lines were cultured in DMEM (HyClone Laboratories, Logan, UT, USA) supplemented with 10% or 20% FBS (HyClone Laboratories) and 1% penicillin/streptomycin (HyClone Laboratories). The cell lines were maintained at 37°C in a humidified atmosphere containing 5% CO2.
Cell viability assay
To determine cell viability with respect to everolimus (Sigma-Aldrich Co., St Louis, MO, USA) concentrations, A431 and HSC-1 cells (0.5×10⁴) were seeded in 96-well tissue culture plates. The following day, the cells were treated with different concentrations of everolimus (0.001–2,000 nM) for 72 hours. Cell viability was measured using MTT reagent (Sigma-Aldrich Co.). Briefly, the surviving cells were treated with 500 µg/mL of MTT solution for 2 hours, after which the absorbance was measured at 540 nm. The survival rate was calculated as the ratio of the absorbance of the treated wells to that of the control wells.
Apoptosis analysis
The cells were treated with control and 100 nM everolimus for 72 hours and were harvested after washing by ice-cold PBS. Apoptosis was investigated using Annexin V and propidium iodide (PI; Molecular Probes, Eugene, OR, USA). Flow cytometry analyses (Supplementary material) were performed using BD FACSVerse System (BD Biosciences, San Jose, CA, USA).
Western blot analysis
Cells were lysed using RIPA buffer containing 50 mM Tris-HCl (pH 7.4), 1% NP-40, 0.25% sodium deoxycholate, 150 mM NaCl, 1 mM EDTA, 1 mM Na3VO4, 1 mM NaF, and proteinase inhibitors. Proteins in the cell lysates were separated using 8% SDS–polyacrylamide gels and transferred to polyvinylidene difluoride membranes (EMD Millipore, Billerica, MA, USA). The blots were incubated in 5% skim milk (Difco, Franklin Lakes, NJ, USA) for 1 hour and then probed overnight with primary antibodies against p-mTOR (Cell Signaling, Danvers, MA, USA), mTOR (Cell Signaling), p-p70S6K (Cell signaling), p70S6K (Cell Signaling), cyclin D1 (Santa Cruz Biotechnology Inc., Dallas, TX, USA), and GAPDH (Santa Cruz Biotechnology Inc.). Next day, the blots were incubated with horseradish peroxidase-conjugated anti-rabbit secondary antibodies (Supplementary material). The immunoreactive proteins were detected using an enhanced chemiluminescence kit (Thermo Fisher Scientific, Waltham, MA, USA) and visualized using ImageQuant ver. 5.2 (Molecular Dynamics, Sunnyvale, CA, USA). Phosphorylation proteins were quantified using Image J (https://imagej.nih.gov/ij/).
Microarray analysis and gene expression profiling
To analyze the global gene expression profiles, A431 and HSC-1 cells were treated with dimethyl sulfoxide (DMSO) or 100 nM of everolimus for 72 hours. Total RNA from the cells was extracted using TRI reagent® (Ambion, Waltham, MA, USA). RNA purity and integrity were evaluated using the ND-1000 Spectrophotometer (NanoDrop, Wilmington, NC, USA) and Agilent 2100 Bioanalyzer (Agilent Technologies, Santa Clara, CA, USA), respectively. The Affymetrix whole transcript expression array process was executed according to the manufacturer’s protocol (GeneChip Whole Transcript PLUS Reagent Kit; Thermo Fisher Scientific). Briefly, cDNA was synthesized using the GeneChip WT (Whole Transcript) Amplification kit (Thermo Fisher Scientific) as described by the manufacturer. The sense cDNA was then fragmented and biotin labeled with TdT using the GeneChip WT Terminal Labeling Kit (Thermo Fisher Scientific). Approximately 5.5 µg of the labeled DNA target was hybridized to the Affymetrix GeneChip Human 2.0 ST Array at 45°C for 16 hours. Hybridized arrays were washed and stained on the GeneChip Fluidics Station 450 and scanned on a GCS3000 Scanner (Affymetrix). The signal values were computed using the Affymetrix® GeneChip™ Command Console software. Furthermore, the data were summarized and normalized via the robust multi-array average (RMA) method implemented using the Affymetrix® Expression Console™ (EC) software. We exported the gene-level RMA analysis results and analyzed the differentially expressed genes (DEGs). The results of the gene expression data have been deposited under the GEO reference GSE112079.
Statistical significance of the expression data was determined using the Local Pooled Error test and fold change ≥1.5 in which the null hypothesis was set as no difference existed among the groups. The false discovery rate (FDR) was controlled by adjusting the P-value using the Benjamini–Hochberg algorithm. For a DEG set, hierarchical cluster analysis was performed using complete linkage and Euclidean distance as a measure of similarity.
Gene-enrichment and functional annotation analyses for the significant probe list were performed using the Database for Annotation, Visualization, and Integrated Discovery (DAVID) tool (http://david.abcc.ncifcrf.gov). All data analysis and DEG visualization were conducted using R 3.0.2 (http://www.r-project.org).
Ingenuity Pathway Analysis (IPA)
To identify the gene network associated with everolimus resistance in SCC cells, pathway analysis was performed using the IPA tool (Ingenuity® Systems, Red Wood city, CA, USA; http://www.ingenuity.com).
Quantitative real-time PCR (qRT-PCR) analysis
Total RNA was extracted using TRI reagent® (Ambion), and cDNAs were synthesized using M-MLV Reverse Transcriptase (Promega Corporation, Fitchburg, WI, USA) according to the manufacturer’s instructions. qRT-PCR reactions were carried out in triplicates using the iQ™ SYBR Green Supermix and CFX96 qPCR instrument (Bio-Rad Laboratories Inc., Hercules, CA, USA). The primers used are as follows: forward, 5′-tgaggagacaccgcccac-3′ and reverse, 5′-caacatcgatttcttcctcatcttc-3′ for MYC proto-oncogene; forward, 5′-gccgagaagctgtgcatctac-3′ and reverse, 5′-tccacttgagcttgttcaccag-3′ for cyclin D1 (CCND1); forward, 5′-ttgagcacctctggagctct-3′ and reverse, 5′-atctggtccatggtgctgc-3′ for TP73; forward, 5′-aagctgctgccaacaccaac-3′ and reverse, 5′-ccctcgcttcttcctctctgaa-3′ for NUPR1; forward, 5′-atcgcctgctacaaaaacaag-3′ and reverse, 5′-ttggcaacctgacctttagaa-3′ for ribosome maturation factor (SBDS); forward, 5′-agccttgccccatcaactg-3′ and reverse, 5′-aatgccaaccaccgcaga-3′ for ERBB2; forward, 5′-tgattagcacttgggtgacg-3′ and reverse, 5′-cctcctccactttgtcctca-3′ for CDKN2B; and forward, 5′-acagtcagccgcatcttctt-3′ and reverse, 5′-acgaccaaatccgttgactc-3’ for GAPDH. The amplification conditions included a predenaturation step at 95°C for 3 minutes, followed by 40 cycles of denaturation at 95°C for 15 seconds, annealing at 60°C or 58°C for 15 seconds, and extension at 72°C for 15 seconds. The comparative threshold cycle (Ct) method, , was used to calculate fold amplification.
CCND1 gene overexpression
To investigate the effects of everolimus on cell viability via cyclin D1 (CCND1) gene overexpression in HSC-1 cells, the cells were transfected with pcDNA cyclin D1 HA (Addgene plasmid #11181)Citation16 using Lipofectamine 3000 (Thermo Fisher Scientific) according to the manufacturer’s recommended protocol. pcDNA cyclin D1 HA was a gift from Dr Bruce Zetter. CCND1 gene overexpression was confirmed using qRT-PCR.
Statistical analyses
All graphed data are presented as mean±SD. The results were analyzed using Student’s t-test. P<0.05 was considered to be statistically significant.
Results
Everolimus reduces cell viability of skin SCC
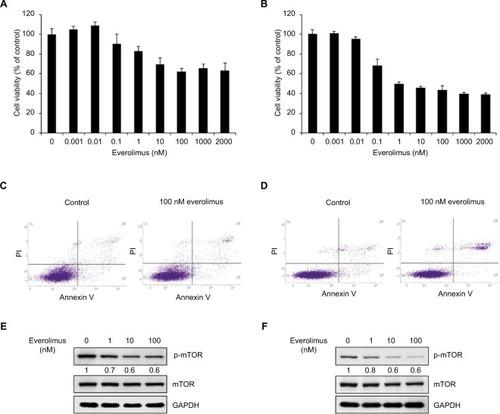
To understand the basis for everolimus sensitivity in skin SCC, we examined the effect of everolimus on cell viability in HSC-1 and A431 cells. First, both cell lines were treated with various doses of everolimus ranging from 0.001 to 2,000 nM for 72 hours. Interestingly, the skin SCC cells showed different patterns of cell viability after everolimus treatment (). Everolimus reduced cell viability in a dose-dependent manner in HSC-1 cell lines when compared to the control non-treated cells. However, A431 cell viability was not dependent on everolimus concentrations. Moreover, Annexin V/PI binding assay was performed to investigate the influence of treatment with everolimus. The data showed that the percentage of late apoptotic cells increased in HSC-1 cells when compared to control cells. However, the percentage of late apoptotic cells in A431 cells was unchanged (). Since everolimus is reported to be a drug that targets mTORC1, we also confirmed mTOR activity in both cell lines treated with everolimus. As expected, mTOR phosphorylation levels clearly decreased in HSC-1 cells after everolimus treatment in a dose-dependent manner, suggesting that everolimus-mediated cell viability was strongly associated with mTOR activity. On the other hand, phosphorylated mTOR proteins only slightly decreased in A431 cells when compared to HSC-1 cells (). These results suggest that the A431 cell line exhibits a different type of sensitivity to the everolimus treatment when compared to the HSC-1 cell line. Therefore, these differences between the HSC-1 and A431 cell lines might be connected with the therapeutic efficacy of everolimus in skin SCC. p70S6K protein is direct target of mTOR downstream. We also confirmed everolimus-mediated inhibition of mTOR pathway by simply checking reduction of p70S6K activity in both HSC-1 and A431 cells treated with everolimus ().
Figure 1 Inhibition of mTOR activity via everolimus treatment reduces the proliferation of skin SCC cells.
Notes: Cell viability of A431 (A) and HSC-1 (B) cells after 72-hour everolimus treatment at different dosages. Apoptosis analysis of A431 (C) and HSC-1 (D) by Annexin V/PI double staining after treatment with 100 nM everolimus for 72 hours. Everolimus-induced changes in mTOR activity in A431 (E) and HSC-1 (F) cells were analyzed by performing immunoblotting assays.
Abbreviations: SCC, squamous cell carcinoma; PI, propidium iodide.
Identification of everolimus-resistant genes in skin SCC
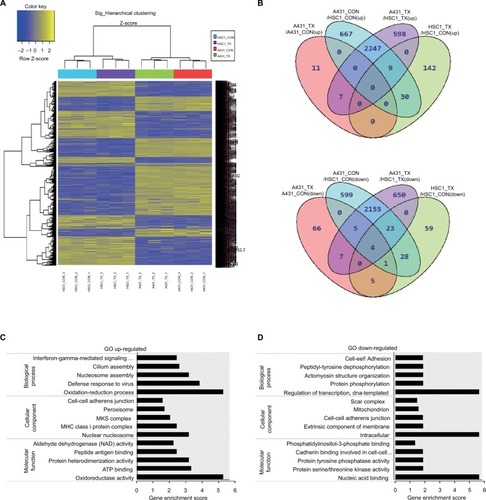
To investigate the molecular mechanisms underlying the different cellular responses to everolimus treatment, we analyzed the global gene expression profiles in everolimus-resistant A431 and everolimus-sensitive HSC-1 cells. Micro-array analysis was performed on both cell lines treated with or without 100 nM of everolimus. Hierarchical clustering analysis from the microarray data showed DEGs in A431 and HSC-1 cells. The variation between the control and everolimus-treated cells in the same cell line was smaller than that between the two cell lines, suggesting that the differential gene expression profiles may be related to different everolimus sensitivity mechanisms (). To further define the difference in cellular response between everolimus-resistant A431 and everolimus-sensitive HSC-1 cells, we identified 7,313 DEGs that changed >1.5-fold and had P-values <0.05 in at least one of four comparisons (A431_CON vs A431_TX, A431_CON vs HSC-1_CON, A431_TX vs HSC-1_TX, and HSC-1_CON vs HSC-1_TX; ). Based on these results, we isolated the everolimus-resistant genes, 2,247 of which were upregulated and 2,155 of which were downregulated. Next, to investigate the functional annotation of the everolimus resistance-related genes, we performed a gene-enrichment analysis using the bioinformatics tool DAVID (http://david.abcc.ncifcrf.gov/). The top five gene ontology (GO) terms are listed in . We found that the highest enriched GOs targeted by the upregulated genes and related to everolimus resistance were oxidation–reduction process (GO: biological processes), nuclear nucleosome (GO: cellular components), and oxidoreductase activity (GO: molecular functions) (), whereas the downregulated transcripts were regulation of transcription, DNA-templated (GO: biological processes), intracellular (GO: cellular components), and nucleic acid binding (GO: molecular functions; ). DEG ontology had enrichment P-values <0.05. Most of the tumors compared to normal exhibited higher ROS levels. ROS promotes tumor progression and development, and alteration of reactions with respect to ROS induces drug resistance.Citation17 Therefore, these results indicate that the “oxidation–reduction process” under “biological processes” and “oxidoreductase activity” under “molecular functions” are associated with drug resistance.
Figure 2 Identification of genes related to everolimus resistance in skin SCC cells using microarray analysis.
Notes: (A) Hierarchical clustering of the significant differences in gene expression for control and everolimus treatments in A431 and HSC-1 cells. (B) Venn diagram of the upregulated and downregulated genes after everolimus treatments. (C) GO enrichment analysis of the upregulated genes associated with everolimus resistance. (D) GO enrichment analysis of the downregulated genes associated with everolimus resistance.
Abbreviations: SCC, squamous cell carcinoma; GO, gene ontology.
Identification of the network associated with everolimus resistance
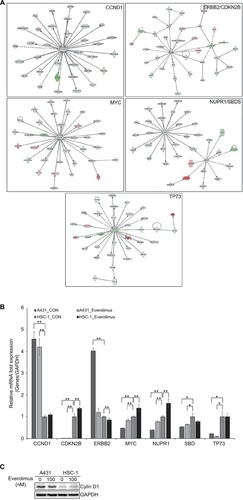
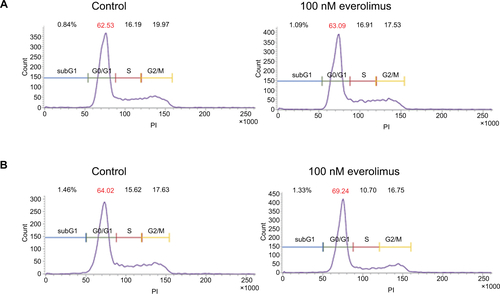
Next, we performed IPA to identify the key regulator(s) within the DEGs that were related to everolimus resistance. Bioinformatics analyses predicted five signaling networks in the gene content associated with everolimus resistance from the differential gene expression profiles. MYC proto-oncogene, bHLH transcription factor (MYC); cyclin D1 (CCND1); TP73; NUPR1/SBDS, ribosome maturation factor (SBDS); and ERBB2/CDKN2B were observed to be the core proteins in each IPA network (). To further confirm the IPA data, we performed qRT-PCR and Western blot analysis (). Expression levels of CCND1 or ERBB2 were highly upregulated in everolimus-resistant A431 cells when compared to everolimus-sensitive HSC-1 cells, suggesting that both genes played a significant role in acquired resistance to everolimus in A431 cells. Moreover, chemotherapeutic drugs are also known to induce ROS overexpression.Citation18 Excessive ROS regulates the cell cycle via proteasomal degradation of CCND1.Citation19 Therefore, we investigated cell cycle in both A431 and HSC-1 cells. The result showed that treatment of everolimus in HSC-1 leads to accumulation of the cells at the G0/G1 phase (). However, ERBB2 levels were clearly downregulated by the everolimus treatment. These results suggest CCND1 to be a molecular marker of everolimus resistance in skin SCC.
Figure 3 IPA of the genes associated with everolimus resistance.
Notes: (A) The functional pathway analysis network using IPA. (B) Validation of the DEG expression levels significantly involved in the pathway network using qRT-PCR analysis (*P<0.05 and **P<0.01). (C) Validation of the cyclin D1 using Western blot analysis.
Abbreviations: IPA, Ingenuity Pathway Analysis; DEG, differentially expressed gene; qRT-PCR, quantitative real-time PCR.
CCND1 induces everolimus resistance
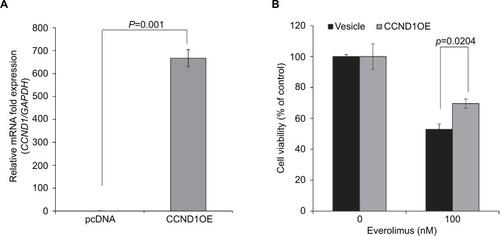
To further understand the roles of CCND1 in cellular responses associated with everolimus resistance, we investigated the effect of CCND1 on everolimus-sensitive HSC-1 cells. CCND1 was recently suggested as a diagnostic marker in skin tumors by Shen et al.Citation20 Moreover, Noel et alCitation21 reported that CCND1 overexpression was related to cisplatin resistance in several cancers. Therefore, we exogenously overexpressed CCND1 in everolimus-sensitive HSC-1 cells. As expected, CCND1-overexpressing HSC-1 cells demonstrated elevated cell viability after everolimus treatment when compared to control cells (). Therefore, upregulated CCND1 leads to everolimus resistance in skin SCC.
Figure 4 CCND1 overexpression induces everolimus resistance in HSC-1 cells.
Notes: (A) qRT-PCR analysis of exogenous CCND1 expression. (B) Cell viability in control and CCND1-overexpressing cells following treatment with 100 nM of everolimus.
Abbreviation: qRT-PCR, quantitative real-time PCR.
Discussion
The mTOR signaling system plays key roles in several transduction pathways necessary for cellular regulation.Citation22,Citation23 mTOR has two protein kinase complexes: mTOR complex 1 and mTOR complex 2. Among them, the mTOR complex 1 pathway activates several oncogenic signaling pathways.Citation24,Citation25 New insights into the mTOR signaling system are helping to develop new anticancer agents that induce apoptosis and prevent angiogenesis. Thus, drugs known as mTOR inhibitors have been passed for use in certain cancers and included in ongoing cancer trials.Citation26,Citation27 Everolimus, temsirolimus, and zotarolimus have already been approved for therapeutic use and have been commercialized. These drugs are used to treat kidney, skin, breast, and neuroendocrine cancers. Many other mTOR inhibitors are being developed for clinical and preclinical studies.Citation28 Recently, an Australian skin cancer trial showed that cutaneous SCC occurred at a significantly lower rate in the sirolimus group of transplant patients over a 2-year observation period.Citation13 In the TUMORAPA-1 and TUMORAPA-N trials, in which a total of 120 patients were enrolled, the rate of SCC-free survival was significantly longer in the sirolimus group than in the calcineurin inhibitor group.Citation14 Some case reports and small single-center series suggest that mTOR inhibitors show excellent therapeutic effects in posttransplant malignancies.Citation29 However, there are no studies that clarify why mTOR inhibitors are more effective in posttransplantation patients with cutaneous SCC.
In the current study, we demonstrated that the cytotoxic effects of an mTOR inhibitor induced apoptosis in human cutaneous SCC cell lines. MTT and apoptosis assays showed that the mTOR inhibitor exhibited antiproliferative effects in the HSC-1 cell line after 72 hours of incubation. Furthermore, the HSC-1 cell line showed decreased phosphorylated mTOR levels in relation to the mTOR inhibitor concentration using Western blot analysis. Gene profiling was also conducted using microarray analysis. MYC/CCND1/TP73/NUPR1/SBD/ERBB/CDKN2B genes were associated with the cytotoxic effects of the mTOR inhibitor. Among them, CCND1 was most closely associated with resistance to mTOR inhibitor efficacy with the help of the IPA network.
Unfortunately, this study is limited as it does not include more cutaneous SCC cell lines. However, the response of the mTOR inhibitor was shown to be completely different in both cell lines. Therefore, the obvious difference in gene expression between the two cell lines may be helpful in predicting mTOR inhibitor efficacy. To the best of our knowledge, this study is the first study to determine the genes associated with the therapeutic resistance of mTOR inhibitors.
Conclusion
The results of our study show that the CCND1 gene is a predictive marker of mTOR inhibitor efficacy. In the future, we aim to determine the gene expressions that are more related to therapeutic effects.
Acknowledgments
This research was funded by grants from the Konyang University Myunggok Research Fund of 2016 and the National Research Foundation of Korea (grant number: NRF-2017R1A2B4003684).
Supplementary Material
Western blot analysis of p-p70S6K
The cells were treated control and 100 nM everolimus for 48 h and were harvested after washing by ice cold phosphate-buffered saline (PBS). Cells were lysed using RIPA buffer. Proteins in the cell lysates were separated using 8% SDS-polyacrylamide gels and transferred to polyvinylidene difluoride membranes (Millipore, Billerica, MA, USA). The blots were incubated in 5% skim milk (Difco, Franklin Lakes, NJ, USA) for 1 h and then probed overnight with primary antibodies against p-p70S6K (Cell signaling), p70S6K (Cell Signaling) and GAPDH (Santa Cruz Biotechnology). Next day, the blots were incubated with horseradish peroxidase-conjugated anti-rabbit secondary antibodies. The immunoreactive proteins were detected using an enhanced chemiluminescence kit (Thermo Fisher Scientific, Waltham, MA, USA) and visualized using ImageQuant ver. 5.2 (Molecular Dynamics, Sunnyvale, CA, USA). Phosphorylation proteins were quantified using Image J (https://imagej.nih.gov/ij/).
Cell cycle analysis
The cells were treated control and 100 nM everolimus for 72 h and were harvested after washing by ice cold phosphate-buffered saline (PBS). Change of cell cycle were investigated using PI (Molecular Probes). Flow cytometry analyses were performed using BD FACSVerse System (BD Biosciences, Franklin Lakes, NJ, USA).
Figure S1 Inhibition of p70S6K activity via everolimus treatment in skin SCC cells.
Notes: Everolimus-induced changes in p70S6K activity in A431 (A) and HSC-1 (B) cells were analyzed by performing immunoblotting assays.
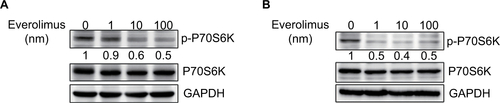
Figure S2 Cell cycle analysis using propididum iodide (PI) staining.
Notes: A431 (A) and HSC-1 (B) cells were treated with 100nM everolimus for 72h and were stained with PI. DNA content was measured with fluorescence activated cell sorting (FACS).
Disclosure
The authors declare no conflicts of interest.
References
- AlamMRatnerDCutaneous squamous-cell carcinomaN Engl J Med20013441397598311274625
- EuvrardSKanitakisJClaudyASkin cancers after organ transplantationN Engl J Med2003348171681169112711744
- LindelöfBSigurgeirssonBGäbelHSternRSIncidence of skin cancer in 5356 patients following organ transplantationBr J Dermatol2000143351351910971322
- IkegawaSSaidaTObayashiHCisplatin combination chemotherapy in squamous cell carcinoma and adenoid cystic carcinoma of the skinJ Dermatol19891632272302551943
- KhansurTKennedyACisplatin and 5-fluorouracil for advanced locoregional and metastatic squamous cell carcinoma of the skinCancer1991678203020322004320
- GuthrieTHPorubskyESLuxenbergMNShahKJWurtzKLWatsonPRCisplatin-based chemotherapy in advanced basal and squamous cell carcinomas of the skin: results in 28 patients including 13 patients receiving multimodality therapyJ Clin Oncol1990823423462405109
- SadekHAzliNWendlingJLTreatment of advanced squamous cell carcinoma of the skin with cisplatin, 5-fluorouracil, and bleomycinCancer1990668169216961698529
- ShinDMGlissonBSKhuriFRPhase II and biologic study of interferon alfa, retinoic acid, and cisplatin in advanced squamous skin cancerJ Clin Oncol200220236437011786562
- ReigneauMRobertCRoutierEEfficacy of neoadjuvant cetuximab alone or with platinum salt for the treatment of unresectable advanced nonmetastatic cutaneous squamous cell carcinomasBr J Dermatol2015173252753425704233
- LuSMLienWWConcurrent Radiotherapy With Cetuximab or Platinum-based Chemotherapy for Locally Advanced Cutaneous Squamous Cell Carcinoma of the Head and NeckAm J Clin Oncol2018411959926353121
- FerrisRLBlumenscheinGFayetteJNivolumab for Recurrent Squamous-Cell Carcinoma of the Head and NeckN Engl J Med2016375191856186727718784
- ChowLQMHaddadRGuptaSAntitumor Activity of Pembrolizumab in Biomarker-Unselected Patients With Recurrent and/or Metastatic Head and Neck Squamous Cell Carcinoma: Results From the Phase Ib KEYNOTE-012 Expansion CohortJ Clin Oncol201634323838384527646946
- CampbellSBWalkerRTaiSSJiangQRussGRRandomized controlled trial of sirolimus for renal transplant recipients at high risk for nonmelanoma skin cancerAm J Transplant20121251146115622420843
- EuvrardSMorelonERostaingLTUMORAPA Study GroupSirolimus and secondary skin-cancer prevention in kidney transplantationN Engl J Med2012367432933922830463
- Hoogendijk-van den AkkerJMHardenPNHoitsmaAJTwo-year randomized controlled prospective trial converting treatment of stable renal transplant recipients with cutaneous invasive squamous cell carcinomas to sirolimusJ Clin Oncol201331101317132323358973
- NewmanRMMobascherAMangoldUAntizyme targets cyclin D1 for degradation. A novel mechanism for cell growth repressionJ Biol Chem200427940415044151115277517
- LiuYLiQZhouLCancer drug resistance: redox resetting renders a wayOncotarget2016727427404276127057637
- LauATWangYChiuJFReactive oxygen species: current knowledge and applications in cancer research and therapeuticJ Cell Biochem2008104265766718172854
- PyoCWChoiJHOhSMChoiSYOxidative stress-induced cyclin D1 depletion and its role in cell cycle processingBiochim Biophys Acta20131830115316532523920145
- ShenYXuJJinJTangHLiangJCyclin D1 expression in Bowen’s disease and cutaneous squamous cell carcinomaMol Clin Oncol20142454554824940492
- NoelEEYeste-VelascoMMaoXThe association of CCND1 overexpression and cisplatin resistance in testicular germ cell tumors and other cancersAm J Pathol201017662607261520395447
- KennedyBKLammingDWThe Mechanistic Target of Rapamycin: The Grand ConducTOR of Metabolism and AgingCell Metab2016236990100327304501
- ShimobayashiMHallMNMaking new contacts: the mTOR network in metabolism and signalling crosstalkNat Rev Mol Cell Biol201415315516224556838
- JewellJLRussellRCGuanKLAmino acid signalling upstream of mTORNat Rev Mol Cell Biol201314313313923361334
- ZoncuREfeyanASabatiniDMmTOR: from growth signal integration to cancer, diabetes and ageingNat Rev Mol Cell Biol2011121213521157483
- SchulerWSedraniRCottensSSDZ RAD, a new rapamycin derivative: pharmacological properties in vitro and in vivoTransplantation199764136429233698
- YuPLairdADduXCharacterization of the activity of the PI3K/mTOR inhibitor XL765 (SAR245409) in tumor models with diverse genetic alterations affecting the PI3K pathwayMol Cancer Ther20141351078109124634413
- XieJWangXProudCGmTOR inhibitors in cancer therapyF1000Res201652078
- HoldaasHDe SimonePZuckermannAEverolimus and Malignancy after Solid Organ Transplantation: A Clinical UpdateJ Transplant20162016111